

Abstract
While DNA microarray analysis is widely accepted as an essential tool for modern biology, its use still eludes many researchers for several reasons, especially when microarrays are not commercially available. In that case, the design, construction, and use of microarrays for a sequenced organism constitute substantial, time-consuming, and expensive tasks. Recently, it has become possible to construct custom microarrays using industrial manufacturing processes, which offer several advantages, including speed of manufacturing, quality control, no up-front setup costs, and need-based microarray ordering. Here, we describe a strategy for designing and validating DNA microarrays manufactured using a commercial process. The 22K microarrays for the solvent producer Clostridium acetobutylicum ATCC 824 are based on in situ-synthesized 60-mers employing the Agilent technology. The strategy involves designing a large library of possible oligomer probes for each target (i.e., gene or DNA sequence) and experimentally testing and selecting the best probes for each target. The degenerate C. acetobutylicum strain M5 lacking the pSOL1 megaplasmid (with 178 annotated open reading frames [genes]) was used to estimate the level of probe cross-hybridization in the new microarrays and to establish the minimum intensity for a gene to be considered expressed. Results obtained using this microarray design were consistent with previously reported results from spotted cDNA-based microarrays. The proposed strategy is applicable to any sequenced organism.
Global-scale transcriptional analysis is now established as the first level of characterization following sequence analysis and annotation. Whereas sequencing tools can be applied to any organism, transcriptional analysis by DNA microarrays is specific for each organism. With the ever-increasing number of sequenced organisms, there is a clear need for the development of organism-specific microarrays. Yet commercial microarrays are available for only a few model organisms. Thus, small groups or individual investigators interested in other organisms must generate the DNA microarrays themselves. The first choice an investigator faces is the type of microarray to be employed. Although there are now several available platforms, the choice is typically between spotted arrays (using either PCR-generated cDNA [33] or synthesized oligomers [11]) and in situ-synthesized oligomer arrays (8, 9, 35). Spotted microarrays require large up-front investments in materials and effort to generate the material to be spotted (the probes), verify the material to be spotted if PCR products are used, and provide quality control for the spotting process. Significantly, they lack flexibility in terms of changes in probe design, the number of arrays that can be printed before a new round of probes must be synthesized, and the minimum number of arrays that can be printed at any given time. In contrast, commercially manufactured microarrays (8, 9, 21), whereby the oligomer probes are synthesized in situ, offer several advantages, such as flexibility in changing the probe design and microarray format, good quality control, no up-front setup costs, production in small or large batches as desired, and no need to store presynthesized probes over long time periods. Yet relatively few investigators have taken advantage of such microarray-manufacturing opportunities. Oligomer probes produce hybridization signals comparable to those from spotted cDNA microarrays (11, 34). Frequently, one probe may suffice to detect the expression of a gene (9, 26), thus making it easier to characterize paralog genes and splice variants, and can reach a level of sensitivity of close to 1 copy of mRNA (9).
Once a microarray platform has been chosen, the next choice to be made is which of the available programs to use for microarray oligomer probe design. As stated by Li and Stormo (13), “Empirically, the optimum probe for a gene would be the one with minimum hybridization free energy for that gene (under the appropriate hybridization conditions) and maximum hybridization free energy for all other genes in the hybridizing pool. Unfortunately, those energies depend on knowledge that is not computable from the sequence alone, at least not currently.” We are not aware of any established method for predicting the melting temperature (Tm) of a surface-immobilized probe and the corresponding labeled mRNA or reverse-transcribed cDNA (its target). As a consequence, probe design programs (2, 4, 14, 15, 20, 28, 30-32, 40, 41, 43) use different criteria for selecting the best set of probes for a given set of parameters, such as G+C content, the percentage of sequence identity or similarity, and Tms, assuming that the probe and its target are both in solutions. Each criterion by itself yields an “optimal” set of probes, but to capture the best possible probe set, several different criteria are used by the various design programs to rate each probe. Unfortunately, there are fewer reports on the performance of whole-genome microarrays created by using these programs than there are programs themselves. Given the different optimality criteria used by different programs, the best way to assess the quality of the probe design outcomes of these programs is experimentally.
This paper presents a general two-part strategy for developing high-quality microarrays for any sequenced organism. The first part consists of the in silico creation of a library of optimal probes for each target sequence and the selection of a first set of probes to be experimentally tested. The second part includes the experimental evaluation of the performance of the previously selected probes by using two mRNA pools corresponding to different strains of Clostridium acetobutylicum. The careful selection of the mRNA pools allowed for the estimation of the minimum intensity that a target has to achieve to be considered to be expressed. Finally, we compared the results obtained by using the newly designed array to those obtained by using our previously existing (1) cDNA microarray platform.
MATERIALS AND METHODS
Strains and culture.
The two C. acetobutylicum strains used in this study were the wild-type strain ATCC 824 (American Type Culture Collection, Manassas, VA) and strain M5 (6), which has lost the 178-gene-long pSOL1 megaplasmid. This megaplasmid harbors the solvent production genes and some not-yet-identified but essential sporulation genes. Both strains were stored at −85°C in clostridial growth medium (42) containing 15% glycerol. Cells were plated onto agar-solidified 2× YTG (1× YTG is 8 g of tryptone/liter, 5 g of yeast extract/liter, 2 g of NaCl/liter, 2.5 g of glucose/liter, and 7.5 g of agar/liter, pH 5.8) plates. Liquid cultures in flasks (200-ml working volume) of the wild-type strain were inoculated with single colonies at least 4 days old from plates after heat shocking at 70 to 80°C for 10 min. Liquid cultures of the M5 strain were inoculated with single colonies no more than 2 days old and without heat shock. Cultures were grown in an anaerobic chamber (Forma Scientific, Marietta, OH) in clostridial growth medium supplemented with 80 g of glucose/liter. For the time course experiment, C. acetobutylicum was grown in pH-controlled (pH >5) bioreactors (Bioflow II and 110; New Brunswick Scientific, Edison, NJ) (1). Cell concentrations were measured as the optical densities at 600 nm (OD600).
Probe design software.
Several oligomer design programs were tested (2, 4, 14, 15, 20, 28, 30-32, 40, 41, 43), and six programs (CommOligo [14], ROSO [28], YODA [20], ArrayOligoSelector [2], OligoWiz 2.0 [41], and PICKY [4]) were selected based on the higher numbers of criteria (e.g., the level of sequence identity, the number of contiguous matches, Tm, and the level of free binding energy) employed by these programs than by the other programs to select each probe, the extent of available details for individual algorithms, and the ease of use per our assessment.
Probe design parameters.
All programs were set to return as many 60-mer probes as possible with a maximum similarity to any nontarget sequence on the genome of 75 to 85%. This relatively high similarity level was chosen to attain maximal genome coverage at the expense of allowing some (low) level of cross hybridization. The targets to be covered were 3,916 of the 4,024 annotated C. acetobutylicum ATCC 824 (19) sequences identified as CACXXXX or CAPXXXX, where X's represent numbers in the gene designations. The remaining 108 sequences (rRNAs and tRNAs), together with the intergenic regions separating the annotated sequences, were used as background sequences in the programs featuring that option. We use the term background sequences to describe those sequences for which a probe is not designed but against which all probes will be tested so as to avoid cross hybridization. All other parameters were set to the program defaults.
Computational probe selection.
The potential of each probe for cross-hybridization was estimated by finding the minimum difference in Tm between probe homodimers (i.e., the probes and their intended targets) and the corresponding probe heterodimers (i.e., the probes and likely nonspecific matches found in the C. acetobutylicum ATCC 824 genome) (Fig. 1). For each probe, the set of nonspecific matches contained the first four hits returned by FASTA (22, 23). Tm calculations were done using Hybrid 2.5 (16) as described in reference 32.
FIG. 1.
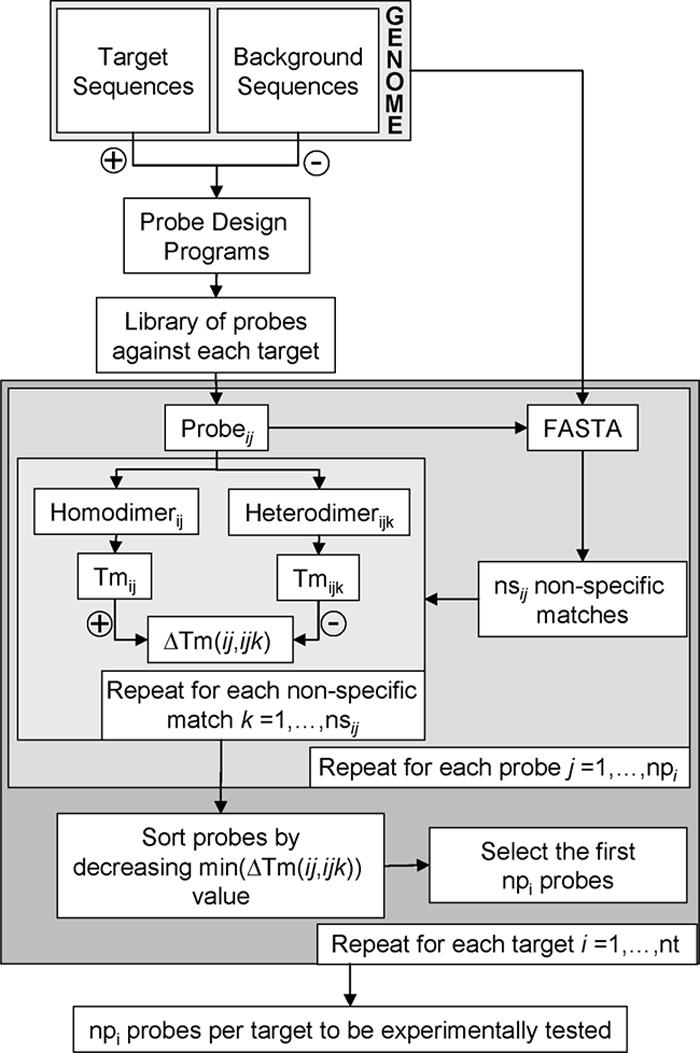
Flow diagram for designing a library of probes for all the target sequences of the C. acetobutylicum genome and selecting several probes per target to be experimentally tested. A target sequence is any sequence in the genome for which a probe has to be designed. The total number of target sequences is represented by nt. A background sequence is any sequence in the genome for which a probe will not be designed. Subscript i indicates a particular target sequence, and subscript j indicates a particular probe; thus, probeij is the jth probe designed for the ith target sequence, and the total number of probes per target is denoted by npi. The total number of selected nonspecific matches for each probe is denoted by nsij, and subscript k is used to denote a particular nonspecific match for probeij. Homodimerij is the dimer formed by probeij and its complementary sequence (i.e., its target), whereas heterodimerijk is the dimer formed by probeij and the complementary sequence of its kth nonspecific match. The difference in Tm between a homodimer and a heterodimer in a pair is represented by ΔTm. The number of desired probes per target to be tested is represented by npi.
DNA microarrays.
All newly designed arrays featured in this study were fabricated by Agilent using the 22K format that contains 22,575 features, 1,080 of which are reserved for Agilent's control spots. All user-defined probes were uploaded through the Agilent eArray Web portal (http://earray.chem.agilent.com/earray/). The spotted cDNA microarrays for this organism were designed, constructed, and tested as described previously (1).
RNA isolation and labeling.
Cell samples were treated as described previously (1) and stored at −85°C. Prior to RNA isolation, cells were washed in 1 ml of SET buffer (1), centrifuged at 5,000 × g for 10 min at 4°C, and processed as described previously (1) but with the following modifications. Proteinase K (4.55 U/ml; Roche Applied Science, Indianapolis, IN) was added to the buffer, and the mixture was incubated for 6 min, followed by 4 min of subjection to a continuous vortex with glass beads (Sigma, St. Louis, MO) at room temperature; the RNeasy mini kit was used according to the instructions of the manufacturer (QIAGEN, Valencia, CA), and genomic DNA contamination was minimized by incubating buffer RW1 (1) at room temperature for 4 min; isolated RNA was eluted in 30 to 40 μl of RNase-free water. RNA samples for microarray hybridizations were labeled with the cyanine dye Cy3 or Cy5 (GE Healthcare Bio-Sciences, Piscataway, NJ) by using an indirect labeling protocol (1). Two mRNA pools were used for all experiments: pool A was created by mixing equal amounts of mRNA samples from wild-type flask cultures sampled at OD600 of 1.09, 1.8, 2.6, and 2.0, whereas pool B was composed of equal amounts of mRNA samples from strain M5 flask cultures sampled at OD600 of 0.454, 0.868, 1.36, 2.40, 3.20, and 4.20. The integrity of the mRNA was tested using a Bioanalyzer 2100 (Agilent, Palo Alto, CA).
Microarray hybridization, scanning, spot quantitation, and intensity normalization.
Spotted cDNA arrays were hybridized as described previously (1). After hybridizing different amounts of labeled material on a total of 10 design II arrays (see “ChIP-on-chip-capable probes” in Results), we determined that the best results were obtained using 0.75 μg of labeled material (data not shown), and this amount was used for all subsequent hybridizations of oligomer arrays. All oligomer arrays were hybridized and washed per Agilent's recommendations except that incubation was at 65°C for 17 h. Scanning was performed as described previously (1). Spot intensities were quantitated using Agilent's Feature Extraction software version 8.5 for the first set of experiments. Normalization and averaging of slide values were carried out as described previously (1) except that intensity ratios (calculated by comparing results for M5 and wild-type strains) and the mean intensities of probes corresponding to the same target were calculated after normalization.
Experimental probe selection.
The final selection of DNA microarray probes was carried out by analyzing the intensities, minus the background, of the probes coming from the in silico procedure diagrammed in Fig. 1 (design I; see “Computational design and selection of probes”), together with those of an additional set of probes (design II). This second set of probes was chosen to evaluate the potential of the probes for chromatin immunoprecipitation (ChIP)-on-chip applications (see “ChIP-on-chip-capable probes” in Results). Probe performance was evaluated by hybridizing a total of eight slides (four for design I and four for design II). For each design, two pairs of slides were employed in a dye swap configuration (5, 12) to account for gene-specific dye bias and technical replication effects. By using the procedure detailed in Fig. 2, each mRNA pool (A and B) was used to contribute a probe to the final array design (design III). To do so, the median of the ranks of all experimentally tested probes for a given target and mRNA pool was calculated, and the probe with the rank closest to the median was selected.
FIG. 2.
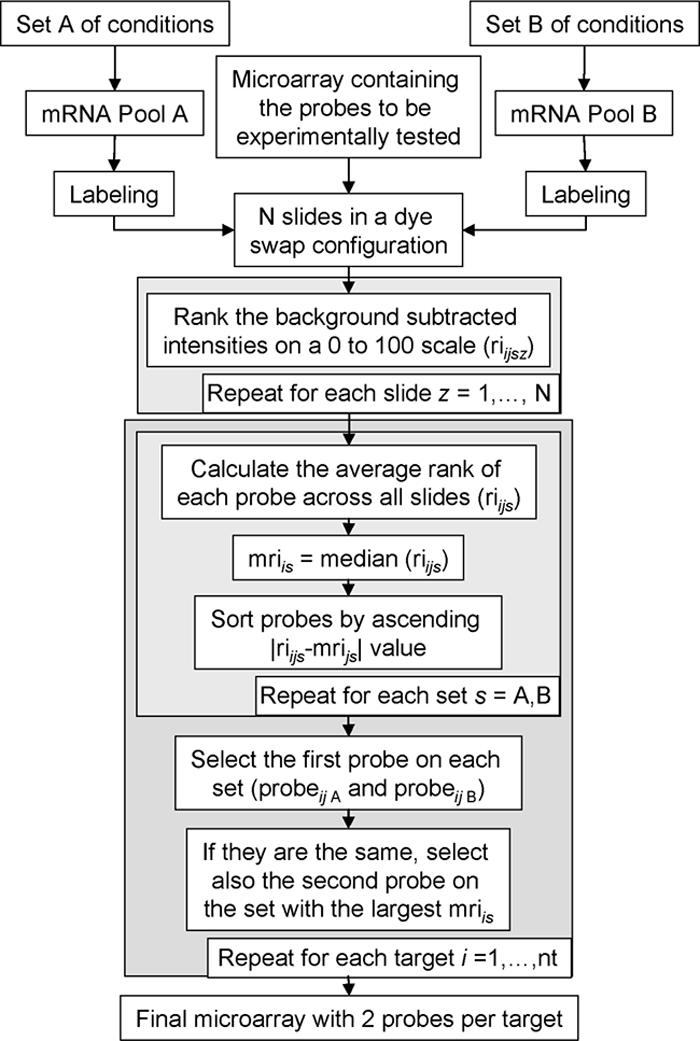
Flow chart detailing the process of selecting two probes per target by using two-color microarrays. Two different mRNA pools (A and B) representing two different conditions or phenotypes are used to maximize the number of targets expressed. Subscript s is used to refer to an mRNA pool, nt represents the total number of target sequences, subscript i is used to denote one of the nt target sequences, and subscript j indicates a particular probe. To account for target-specific dye bias, a dye swap configuration is needed, and to account for technical replication variability, several slides are required. We represent the total number of arrays hybridized as N, and subscript z is used to refer to a particular array. We use riijsz to indicate the ranked intensity, minus the background, of the jth probe against the ith target as measured on the zth slide on the channel containing the sth mRNA pool. Intensities, minus the background, were sorted in increasing order; a rank of zero was assigned the first member of the sorted list, whereas a rank of 100 was assigned the last member of the list, and the ranks of the remaining members of the list were proportional to their ordinals on the sorted list.
Microarray data accession numbers.
The data discussed here have been deposited in NCBI's Gene Expression Omnibus (GEO; http://www.ncbi.nlm.nih.gov/geo/). The GEO accession numbers for the microarray designs are as follows: GPL3820 for the spotted cDNA microarrays (1), GPL4030 for design I, GPL4029 for design II, and GPL4412 for design III. The accession numbers for the microarray series described here are as follows: GSE5383 for the platform and protocol test and GSE5384 for the platform comparison.
RESULTS
Computational design and selection of probes.
The general procedure for the computational probe design and selection is shown in Fig. 1. The first step of our in silico procedure is the generation of as many probes as possible for each of the selected targets by using several programs: CommOligo (14), ROSO (28), YODA (20), ArrayOligoSelector (2), OligoWiz 2.0 (41), and PICKY (4). Figure 3 shows the distribution of the numbers of probes per target (Fig. 3A) and the distributions of Tms (Fig. 3B) and G+C contents (Fig. 3C).
FIG. 3.

Most relevant properties of the library of probes generated in the first step of our microarray design. (A) Distribution of the numbers of probes per target. An average of 32 different probes per target was obtained. (B) Tm distribution. As different programs use different methods and/or sets of constants to calculate the Tm of a probe, all of the Tms were recalculated using Hybrid 2.5 (16) as described in reference 32. (C) G+C content distribution.
The second step of the computational procedure is the selection of the subset of probes to be experimentally tested. This selection is accomplished by evaluating how strong the potential of each probe for cross hybridization may be. An estimation of the specificity of each probe can be obtained by comparing the Tm of the probe-target homodimer to the Tm of a corresponding probe-nonspecific match heterodimer (10, 18, 24). For each probe, we used the first four sequences (besides that of the probe itself) returned by FASTA as the most likely sources of cross hybridization. We selected the smallest of the four homodimer-heterodimer Tm differences as the indicator of the potential of each probe for cross hybridization. This procedure was carried out for each probe corresponding to a given target, the list was sorted in decreasing order of the Tm difference obtained previously, and the first three probes were selected to be experimentally tested. The set of probes resulting from the application of this methodology to every target sequence is referred to herein as design I.
ChIP-on-chip-capable probes.
At the time of the creation of this 60-mer array, we considered the possibility of a hybrid design capable of transcriptional profiling and ChIP-on-chip DNA array (3, 27) applications by employing probes targeting the region closest to the translational start site of each gene instead of the gene's promoter region. The detailed calculations supporting the feasibility of such an approach will be presented elsewhere, along with the experimental data. In the context of this work, suffice it to say that any probes located more than 500 bp from the beginning of the target sequence and those located past the half point of the target sequence were discarded and that the first three probes in this restricted sorted list were selected for experimental testing. We refer to this set of probes as design II.
Probes common between designs I and II.
The two sets of probes are not mutually exclusive. In fact, designs I and II share 6,745 probes corresponding to 3,119 targets. A total of 797 of the 3,916 targets do not have a probe that is common between the two designs. Moreover, every target has at least one probe, while 99.5% of the targets are represented by two probes or more in each design.
Degree of probe replication (designs I and II).
One of our self-imposed limitations was the use of the 22K Agilent array format. These arrays could accommodate up to 21,495 user-designed 60-mers. This limitation prevented us from having two features (spots) for each of the three previously selected probes per target, as this scenario would require 23,496 features (23,496 = 3,916 [targets] × 3 [probes/target] × 2 [features/probe]). Design I contains 9,842 probes in duplicate and 1,811 single probes, whereas design II contains 9,848 probes in duplicate and 1,799 single probes. For either design, the probes which were represented by a single feature were chosen randomly.
Experimental selection of probes.
The general procedure that we devised for the selection of the final probe set based on experimental data is depicted in Fig. 2. To maximize the number of expressed targets, we used two mRNA pools, one coming from the wild-type strain and another from strain M5. The intensities, minus the background, from two pairs of slides per design hybridized in a dye swap configuration were ranked, and those from the same probe and the same mRNA pool were averaged as described in Materials and Methods. Among all probes for each target, the median rank per mRNA pool was calculated, and the probe with the rank closest to this median was chosen. According to this procedure, each mRNA pool independently provides a probe candidate. In some cases, these probes may be the same, and in the absence of other information, we suggest the selection of the probe with the rank second closest to the higher of the two medians as the second probe for that target (Fig. 2). In our case, given the availability of an alternative microarray platform (1), we selected the probe with the rank second closest to the median of the mRNA pool with the highest-ranked intensity for that target in our cDNA arrays. The probes selected according to this procedure are referred to as design III.
Contribution of designs I and II to design III.
Table 1 shows the contributions of each program to designs I, II, and III and reveals that the majority of probes were designed by CommOligo (14) and OligoWizard (41). Fifty percent of the probes in design III are common between designs I and II, and the remaining 50% are equally distributed between design I and design II.
TABLE 1.
Number of oligomers generated by each programa
| Program | No. of probes in designs I and II | No. of probes in design III | % of design III probesb |
|---|---|---|---|
| YODA | 734 | 318 | 4 |
| PICKY | 1,682 | 756 | 11 |
| ROSO | 580 | 256 | 4 |
| OligoWizard | 3,370 | 1,406 | 20 |
| CommOligo | 8,855 | 3,735 | 52 |
| ArrayOligoSelector | 2,116 | 995 | 14 |
When a probe design was generated by more than one program, it was included in the count for each program.
The percentages were calculated relative to the total number of distinct probes (7,165) appearing in design III.
Degree of probe replication (design III).
The shorter the target, the more difficult it is to find more than one representative probe corresponding to a large difference in melting temperature between the intended target and the probe's nonspecific matches. Based on this premise, we decided to use only one probe for the 667 shortest targets to accommodate the maximum number of probes in triplicate, as this strategy would use all 21,495 available features {21,495 = [(3,916 − 667) (targets) × 2 (probes/target) + 667 (targets) × 1 (probes/target)] × 3 (features/probe)} on a 22K array design. Most of the genes with only one or two probes in designs I and II are annotated as genes for hypothetical proteins and have lengths of less than 200 bp.
Assessing the level of nonspecific hybridization.
Although every probe has been designed to ensure the minimum amount of cross hybridization with any other sequence occurring in the C. acetobutylicum genome, the cumulative effect of the cross hybridization of all labeled cDNA elements may not be negligible. By following the approach used previously for our cDNA microarrays (1), we obtained an estimation of the level of cross hybridization by using the signal intensities coming from the labeled cDNA obtained from mRNA pool B. This pool is made up of mRNAs from strain M5 (6, 7), which has lost the 178-gene-long pSOL1 plasmid. By studying the distribution of the intensities of the 321 probes directed towards these missing pSOL1 targets, we could assess the level of cross hybridization that may be expected for any probe when its target is not expressed. Figure 4 shows that under the experimental conditions used, around 95% of the probes for pSOL1 targets exhibited an intensity, minus the background, of 50 U or less when their target transcripts were not present. We will refer to this value of 50 U as the threshold of expression.
FIG. 4.
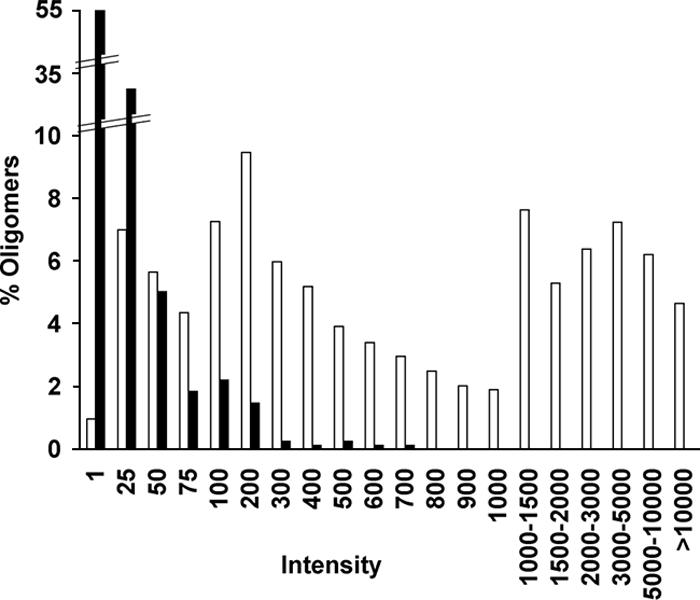
Distribution of intensities, minus the background, of the array probes on the M5 channel for pSOL1 genes (solid bars) and chromosomal genes (open bars) when 1 μg of labeled cDNA was used. Intensities are expressed in units.
Consistency of ratios obtained by different probes directed against the same target.
According to Fig. 2, each mRNA pool (A and B) contributes one probe design per target to our final array (design III). This selection is done based on the average rank of the intensities, minus the background, per channel. Figure 5 shows the excellent consistency of the ratios for the pairs of probes against the same targets produced by our approach.
FIG. 5.

Reproducibility of expression ratios measured by the duplicate probes of the final array (design III). All duplicate probes are shown regardless of their mean intensity values. The regression line between ratios has a slope of 0.9418, an intercept (x = 0) of 0.0022, and an R2 value of 0.8881.
Comparison of outputs of design III oligomer microarrays and our previous cDNA microarrays.
Previous studies based on cDNA microarrays have provided invaluable insights into the transcriptional programs of C. acetobutylicum, and we have been able to relate several cellular programs to macroscopically observable morphological and physiological characteristics of the cells (36-39). We thus desired to examine the difference between the expression ratios for the probes in design III and those obtained using the cDNA microarrays. To do so, aliquots of labeled pools A and B were hybridized onto two pairs of our cDNA arrays (1) by using a dye swap configuration, and the results corresponding to probes with signal intensities above the previously determined threshold of expression are presented in Fig. 6. The correlation between the average log10 expression ratio for a target measured using design III probes and that measured using the cDNA platform probes is characterized by an R2 value of 0.8089, a slope of 0.9715, and an intercept (x = 0) of 0.0380 (data not shown). The correlation is thus deemed to be good, if not excellent.
FIG. 6.

Consistency between our previous cDNA platform and the probes from our final array (design III). The three outer rings represent the chromosomal genes, whereas the three inner rings represent the pSOL1 genes. For each set of rings, the central ring shows the ratio measured using the cDNA array whereas the other two rings present the ratios obtained using the two different probes in the oligomer array. Gray segments indicate probes (either cDNA or oligomer) with intensities below the mean intensity cutoffs of 300 U for cDNA probes and 50 U for oligomer probes. White segments on the cDNA rings indicate open reading frames not previously covered in our array. For those targets with only one probe on the array, the corresponding segment in either the external or internal ring is white. Ratios were calculated as the M5 value divided by the wild-type value; saturated red indicates a ratio of 3 or greater, black indicates a ratio of 1, and saturated green indicates a ratio of 1/3 or smaller. Quantitative data for this figure can be found in the supplemental material.
DISCUSSION
Genome coverage.
We have presented a general framework for the creation and validation of oligomer microarrays for any organism with a sequenced genome. The design III C. acetobutylicum microarray contains probes for 3,916 out of the 4,024 originally annotated sequences of the organism (19). The remaining 108 sequences (rRNAs and tRNAs) were discarded as they account for the vast majority of the RNA complement of a bacterial cell (17) and would yield saturated signals. We were able to provide at least one probe for each target by choosing a maximum similarity to any other sequence in the genome of 75 to 85%. There are 11 genes with only one (4 genes) or two (7 genes) probes. Eight (CAC1152, CAC1446, CAC1844, CAC1873, CAC2248, CAC2790 CAC3633, and CAP0007) of these 11 genes have been annotated as genes for hypothetical proteins, two (CAC1409 and CAC1659) have been annotated as genes for predicted membrane proteins, and the remaining gene (CAC3739) has been annotated as ribosomal protein L34. The lengths of these genes range between the 81 bp of CAP007 and the 234 bp of CAC1152. This small departure from the recommended similarity level of 75% (11) has little to no effect on the probes included in designs I and II. These probes have been short listed based on the differences in melting temperatures of the heterodimers corresponding to each one of the four most likely cross hybridization matches. A large amount of similarity will result in a high melting temperature of the heterodimer, making its selection unlikely. Moreover, Fig. 7 shows that 95% of the probes included in designs I and II have a level of similarity to our calculated four most likely nonspecific matches of 68% or lower, and 99% of them have a level of similarity of 71% or lower. On top of that, the final probe selection is made based on experimental data, not any computational prediction.
FIG. 7.

Percentages of similarity between the probes from designs I and II and their four nonspecific matches. The percentage of similarity between each probe and each one of its four highest-scoring nonspecific matches returned by FASTA was calculated by using the rigorous Needleman-Wunsch global alignment algorithm as implemented in EMBOSS (29). Despite allowing the probe generation programs a maximum similarity of up to 80%, the bulk of the probes presented a similarity to their nonspecific matches of 70% or less.
Experimental testing of the computationally selected probes.
All approximations needed for the computational selection of probes were subjected to experimental testing in the second round of our procedure (Fig. 2). We used ranked intensities, minus the background, to make the process as impervious as possible to variations in signal intensity due to gene-specific dye bias and experimental variation. The good level of agreement among the expression ratios obtained for different probes corresponding to the same target (Fig. 5) suggests that the selection of probes based on the independent use of mRNA pools did not bias the ratios.
Estimation of the level of cross hybridization.
One of the most promising applications of the large amount of data generated by high-throughput methods is the generation of new knowledge by using data-mining techniques. When dealing with microarray data, these techniques require the use of ratios corresponding to genes that are truly expressed. An indication of the minimum observed intensity of a probe when its target sequence is truly expressed can be obtained by spiking a selected set of targets (25) or by obtaining an experimental measure of the intensity that can be attributed to nonspecific cross hybridization. As in the previous study (1), we chose the second option by using an mRNA pool from a strain (M5) resulting from a significant deletion event (the loss of the 178-gene-long pSOL1 megaplasmid) and then measuring the intensities of the probes corresponding to the deleted targets (Fig. 4). We then used this information to calculate a threshold value above which it can be safely assumed that a gene is expressed and that its ratio contains meaningful information. Although this strategy may seem specific for C. acetobutylicum, similar strategies can be devised for other organisms whenever it is clear that a group of genes is expressed under some culture conditions but not under other conditions. Examples of such groups of genes would include genes related to motility and chemotaxis or to the catabolism of unusual substrates. In the former case, one would compare signal intensities from two mRNA pools, one from the motile and the other from the nonmotile stage of a culture, and a value for the expression threshold could be estimated. In general, a threshold of expression can be calculated whenever clearly distinguishable phenotypic traits or metabolic pathways are uniquely and robustly related to the expression of a relatively large set of genes. For a discussion about the use of cDNA to calculate the expression threshold, see the supplemental material.
Use of more than one probe per target.
Our strategy of creating a library of microarray probes allows us to increase the number of probes per gene, as the price per feature decreases without the need for generating an entirely new set of probes. For instance, Agilent's 44,000-element array allows the user to specify the contents of up to 42,034 features or, equivalently, 14,011 probes printed in triplicate. In our case, and after discounting the 126 features needed for targets with one (four targets), two (seven targets), or three (eight targets [CAC0624, CAC1087, CAC1112, CAC1288, CAC1704, CAC2811, CAC3175 and CAP0170]) probes, we could print 2,278 targets in quadruplicate and the shortest 1,619 targets in triplicate, leaving only one unoccupied feature {42,033 = (4 [targets] × 1 [probe/target] × 3 [features/probe] + 7 [targets] × 2 [probes/target] × 3 [features/probe] + 8 [targets] × 3 [probes/target] × 3 [features/probe]) + 2,278 (targets) × 4 (probes/target) × 3 (features/probe) + 1,619 (targets) × 3 (probes/target) × 3 (features/probe)}. Use of more than one probe per target would make it possible to quickly check the consistency of the expression results for each and every gene based on the principle that properly designed probes targeting the same gene should yield similar expression ratios (Fig. 5). As the number of microarray expression data capturing different phenotypes increases, probes reporting conflicting results can be singled out, and once the true level of expression of the target is determined through quantitative reverse transcription-PCR, the best probes can be identified and the array design can be revised. Moreover, this method would make it possible to revisit and refine any previously obtained transcriptional data instead of simply writing off inconsistent results for a particular target.
Supplementary Material
Acknowledgments
This work was supported by NSF grant BES-0418157. We acknowledge financial support by the Robert H. Lurie Comprehensive Cancer Center at Northwestern University towards the purchase of the microarray scanner. J.R.B. was supported by an NIH/NIGMS Biotechnology Training grant (T32-GM08449-11).
Footnotes
Published ahead of print on 25 May 2007.
Supplemental material for this article may be found at http://aem.asm.org/.
REFERENCES
- 1.Alsaker, K. V., C. J. Paredes, and E. T. Papoutsakis. 2005. Design, optimization and validation of genomic DNA microarrays for examining the Clostridium acetobutylicum transcriptome. Biotechnol. Bioprocess Eng. 10:432-443. [Google Scholar]
- 2.Bozdech, Z., J. C. Zhu, M. P. Joachimiak, F. E. Cohen, B. Pulliam, and J. L. DeRisi. 2003. Expression profiling of the schizont and trophozoite stages of Plasmodium falciparum with a long-oligonucleotide microarray. Genome Biol. 4:R9. [DOI] [PMC free article] [PubMed] [Google Scholar]
- 3.Casci, T. 2001. Technology. ChIP on chips. Nat. Rev. Genet. 2:88. [DOI] [PubMed] [Google Scholar]
- 4.Chou, H. H., A. P. Hsia, D. L. Mooney, and P. S. Schnable. 2004. PICKY: oligo microarray design for large genomes. Bioinformatics 20:2893-2902. [DOI] [PubMed] [Google Scholar]
- 5.Churchill, G. A. 2002. Fundamentals of experimental design for cDNA microarrays. Nat. Genet. 32:490-495. [DOI] [PubMed] [Google Scholar]
- 6.Clark, S. W., G. N. Bennett, and F. B. Rudolph. 1989. Isolation and characterization of mutants of Clostridium acetobutylicum ATCC 824 deficient in acetoacetyl-coenzyme A:acetate/butyrate:coenzyme A-transferase (EC 2.8.3.9) and in other solvent pathway enzymes. Appl. Environ. Microbiol. 55:970-976. [DOI] [PMC free article] [PubMed] [Google Scholar]
- 7.Cornillot, E., R. V. Nair, E. T. Papoutsakis, and P. Soucaille. 1997. The genes for butanol and acetone formation in Clostridium acetobutylicum ATCC 824 reside on a large plasmid whose loss leads to degeneration of the strain. J. Bacteriol. 179:5442-5447. [DOI] [PMC free article] [PubMed] [Google Scholar]
- 8.Fodor, S. P. A., R. P. Rava, X. H. C. Huang, A. C. Pease, C. P. Holmes, and C. L. Adams. 1993. Multiplexed biochemical assays with biological chips. Nature 364:555-556. [DOI] [PubMed] [Google Scholar]
- 9.Hughes, T. R., M. Mao, A. R. Jones, J. Burchard, M. J. Marton, K. W. Shannon, S. M. Lefkowitz, M. Ziman, J. M. Schelter, M. R. Meyer, S. Kobayashi, C. Davis, H. Y. Dai, Y. D. D. He, S. B. Stephaniants, G. Cavet, W. L. Walker, A. West, E. Coffey, D. D. Shoemaker, R. Stoughton, A. P. Blanchard, S. H. Friend, and P. S. Linsley. 2001. Expression profiling using microarrays fabricated by an ink-jet oligonucleotide synthesizer. Nat. Biotechnol. 19:342-347. [DOI] [PubMed] [Google Scholar]
- 10.Kaderali, L., and A. Schliep. 2002. Selecting signature oligonucleotides to identify organisms using DNA arrays. Bioinformatics 18:1340-1349. [DOI] [PubMed] [Google Scholar]
- 11.Kane, M. D., T. A. Jatkoe, C. R. Stumpf, J. Lu, J. D. Thomas, and S. J. Madore. 2000. Assessment of the sensitivity and specificity of oligonucleotide (50mer) microarrays. Nucleic Acids Res. 28:4552-4557. [DOI] [PMC free article] [PubMed] [Google Scholar]
- 12.Kerr, M. K., and G. A. Churchill. 2001. Statistical design and the analysis of gene expression microarray data. Genet. Res. 77:123-128. [DOI] [PubMed] [Google Scholar]
- 13.Li, F. G., and G. D. Stormo. 2001. Selection of optimal DNA oligos for gene expression arrays. Bioinformatics 17:1067-1076. [DOI] [PubMed] [Google Scholar]
- 14.Li, X. Y., Z. L. He, and J. Z. Zhou. 2005. Selection of optimal oligonucleotide probes for microarrays using multiple criteria, global alignment and parameter estimation. Nucleic Acids Res. 33:6114-6123. [DOI] [PMC free article] [PubMed] [Google Scholar]
- 15.Liu, S. L., N. A. Tinker, S. J. Molnar, and D. E. Mather. 2004. EC_oligos: automated and whole-genome primer design for exons within one or between two genomes. Bioinformatics 20:3668-3669. [DOI] [PubMed] [Google Scholar]
- 16.Markham, N. R., and M. Zuker. 2005. DINAMelt web server for nucleic acid melting prediction. Nucleic Acids Res. 33:W577-W581. [DOI] [PMC free article] [PubMed] [Google Scholar]
- 17.Neidhardt, F. C. 1987. Chemical composition of Escherichia coli, p. 3-6. In F. C. Neidhardt, J. L. Ingraham, K. B. Low, B. Magasanik, M. Schaechter, and H. E. Umbarger (ed.), Escherichia coli and Salmonella typhimurium: cellular and molecular biology, 1st ed., vol. 1. American Society for Microbiology, Washington, DC. [Google Scholar]
- 18.Nielsen, H. B., R. Wernersson, and S. Knudsen. 2003. Design of oligonucleotides for microarrays and perspectives for design of multi-transcriptome arrays. Nucleic Acids Res. 31:3491-3496. [DOI] [PMC free article] [PubMed] [Google Scholar]
- 19.Nölling, J., G. Breton, M. V. Omelchenko, K. S. Makarova, Q. Zeng, R. Gibson, H. M. Lee, J. Dubois, D. Qiu, J. Hitti, GTC Sequencing Center Production, Finishing, and Bioinformatics Teams, Y. I. Wolf, R. L. Tatusov, F. Sabathe, L. Doucette-Stamm, P. Soucaille, M. J. Daly, G. N. Bennett, E. V. Koonin, and D. R. Smith. 2001. Genome sequence and comparative analysis of the solvent-producing bacterium Clostridium acetobutylicum. J. Bacteriol. 183:4823-4838. [DOI] [PMC free article] [PubMed] [Google Scholar]
- 20.Nordberg, E. K. 2005. YODA: selecting signature oligonucleotides. Bioinformatics 21:1365-1370. [DOI] [PubMed] [Google Scholar]
- 21.Nuwaysir, E. F., W. Huang, T. J. Albert, J. Singh, K. Nuwaysir, A. Pitas, T. Richmond, T. Gorski, J. P. Berg, J. Ballin, M. McCormick, J. Norton, T. Pollock, T. Sumwalt, L. Butcher, D. Porter, M. Molla, C. Hall, F. Blattner, M. R. Sussman, R. L. Wallace, F. Cerrina, and R. D. Green. 2002. Gene expression analysis using oligonucleotide arrays produced by maskless photolithography. Genome Res. 12:1749-1755. [DOI] [PMC free article] [PubMed] [Google Scholar]
- 22.Pearson, W. R. 1990. Rapid and sensitive sequence comparison with Fastp and Fasta. Methods Enzymol. 183:63-98. [DOI] [PubMed] [Google Scholar]
- 23.Pearson, W. R., and D. J. Lipman. 1988. Improved tools for biological sequence comparison. Proc. Natl. Acad. Sci. USA 85:2444-2448. [DOI] [PMC free article] [PubMed] [Google Scholar]
- 24.Rahmann, S. 2002. Rapid large-scale oligonucleotide selection for microarrays, p. 434. In R. Guigó and D. Gusfield (ed.), Lecture notes in computer science, vol. 2452. Proceedings of the Second International Workshop on Algorithms in Bioinformatics. Springer-Verlag, London, United Kingdom. [PubMed] [Google Scholar]
- 25.Redman, J. C., B. J. Haas, G. Tanimoto, and C. D. Town. 2004. Development and evaluation of an Arabidopsis whole genome Affymetrix probe array. Plant J. 38:545-561. [DOI] [PubMed] [Google Scholar]
- 26.Relogio, A., C. Schwager, A. Richter, W. Ansorge, and J. Valcarcel. 2002. Optimization of oligonucleotide-based DNA microarrays. Nucleic Acids Res. 30:e51. [DOI] [PMC free article] [PubMed] [Google Scholar]
- 27.Ren, B., F. Robert, J. J. Wyrick, O. Aparicio, E. G. Jennings, I. Simon, J. Zeitlinger, J. Schreiber, N. Hannett, E. Kanin, T. L. Volkert, C. J. Wilson, S. P. Bell, and R. A. Young. 2000. Genome-wide location and function of DNA binding proteins. Science 290:2306-2309. [DOI] [PubMed] [Google Scholar]
- 28.Reymond, N., H. Charles, L. Duret, F. Calevro, G. Beslon, and J. M. Fayard. 2004. ROSO: optimizing oligonucleotide probes for microarrays. Bioinformatics 20:271-273. [DOI] [PubMed] [Google Scholar]
- 29.Rice, P., I. Longden, and A. Bleasby. 2000. EMBOSS: the European molecular biology open software suite. Trends Genet. 16:276-277. [DOI] [PubMed] [Google Scholar]
- 30.Rimour, S., D. Hill, C. Militon, and P. Peyret. 2005. GoArrays: highly dynamic and efficient microarray probe design. Bioinformatics 21:1094-1103. [DOI] [PubMed] [Google Scholar]
- 31.Rouillard, J. M., C. J. Herbert, and M. Zuker. 2002. OligoArray: genome-scale oligonucleotide design for microarrays. Bioinformatics 18:486-487. [DOI] [PubMed] [Google Scholar]
- 32.Rouillard, J. M., M. Zuker, and E. Gulari. 2003. OligoArray 2.0: design of oligonucleotide probes for DNA microarrays using a thermodynamic approach. Nucleic Acids Res. 31:3057-3062. [DOI] [PMC free article] [PubMed] [Google Scholar]
- 33.Schena, M., D. Shalon, R. W. Davis, and P. O. Brown. 1995. Quantitative monitoring of gene-expression patterns with a complementary-DNA microarray. Science 270:467-470. [DOI] [PubMed] [Google Scholar]
- 34.Shoemaker, D. D., E. E. Schadt, C. D. Armour, Y. D. He, P. Garrett-Engele, P. D. McDonagh, P. M. Loerch, A. Leonardson, P. Y. Lum, G. Cavet, L. F. Wu, S. J. Altschuler, S. Edwards, J. King, J. S. Tsang, G. Schimmack, J. M. Schelter, J. Koch, M. Ziman, M. J. Marton, B. Li, P. Cundiff, T. Ward, J. Castle, M. Krolewski, M. R. Meyer, M. Mao, J. Burchard, M. J. Kidd, H. Dai, J. W. Phillips, P. S. Linsley, R. Stoughton, S. Scherer, and M. S. Boguski. 2001. Experimental annotation of the human genome using microarray technology. Nature 409:922-927. [DOI] [PubMed] [Google Scholar]
- 35.Singh-Gasson, S., R. D. Green, Y. J. Yue, C. Nelson, F. Blattner, M. R. Sussman, and F. Cerrina. 1999. Maskless fabrication of light-directed oligonucleotide microarrays using a digital micromirror array. Nat. Biotechnol. 17:974-978. [DOI] [PubMed] [Google Scholar]
- 36.Tomas, C. A. 2003. DNA-array based transcriptional analysis of solvent tolerance and degeneration in Clostridium acetobutylicum: groESL overexpression, butanol challenges and a novel DNA-array normalization. Ph.D. thesis. Northwestern University, Evanston, IL.
- 37.Tomas, C. A., K. V. Alsaker, H. P. J. Bonarius, W. T. Hendriksen, H. Yang, J. A. Beamish, C. J. Paredes, and E. T. Papoutsakis. 2003. DNA array-based transcriptional analysis of asporogenous, nonsolventogenic Clostridium acetobutylicum strains SKO1 and M5. J. Bacteriol. 185:4539-4547. [DOI] [PMC free article] [PubMed] [Google Scholar]
- 38.Tomas, C. A., J. A. Beamish, and E. T. Papoutsakis. 2004. Transcriptional analysis of butanol stress and tolerance in Clostridium acetobutylicum. J. Bacteriol. 186:2006-2018. [DOI] [PMC free article] [PubMed] [Google Scholar]
- 39.Tomas, C. A., N. E. Welker, and E. T. Papoutsakis. 2003. Overexpression of groESL in Clostridium acetobutylicum results in increased solvent production and tolerance, prolonged metabolism, and large changes in the cell's transcriptional program. Appl. Environ. Microbiol. 69:4951-4965. [DOI] [PMC free article] [PubMed] [Google Scholar]
- 40.Wang, X. W., and B. Seed. 2003. Selection of oligonucleotide probes for protein coding sequences. Bioinformatics 19:796-802. [DOI] [PubMed] [Google Scholar]
- 41.Wernersson, R., and H. B. Nielsen. 2005. OligoWiz 2.0: integrating sequence feature annotation into the design of microarray probes. Nucleic Acids Res. 33:W611-W615. [DOI] [PMC free article] [PubMed] [Google Scholar]
- 42.Wiesenborn, D. P., F. B. Rudolph, and E. T. Papoutsakis. 1988. Thiolase from Clostridium acetobutylicum ATCC 824 and its role in the synthesis of acids and solvents. Appl. Environ. Microbiol. 54:2717-2722. [DOI] [PMC free article] [PubMed] [Google Scholar]
- 43.Zheng, J., J. T. Svensson, K. Madishetty, T. J. Close, T. Jiang, and S. Lonardi. 2006. OligoSpawn: a software tool for the design of overgo probes from large unigene datasets. BMC Bioinformatics 7:7. [DOI] [PMC free article] [PubMed] [Google Scholar]
Associated Data
This section collects any data citations, data availability statements, or supplementary materials included in this article.