


Abstract
We present a comprehensive and efficient gene set analysis tool, called ‘GeneTrail’ that offers a rich functionality and is easy to use. Our web-based application facilitates the statistical evaluation of high-throughput genomic or proteomic data sets with respect to enrichment of functional categories. GeneTrail covers a wide variety of biological categories and pathways, among others KEGG, TRANSPATH, TRANSFAC, and GO. Our web server provides two common statistical approaches, ‘Over-Representation Analysis’ (ORA) comparing a reference set of genes to a test set, and ‘Gene Set Enrichment Analysis’ (GSEA) scoring sorted lists of genes. Besides other newly developed features, GeneTrail's statistics module includes a novel dynamic-programming algorithm that improves the P-value computation of GSEA methods considerably. GeneTrail is freely accessible at http://genetrail.bioinf.uni-sb.de
INTRODUCTION
Modern high-throughput methods generate large sets of genes and proteins that cannot be analyzed manually. Therefore, computer-aided gene set analysis tools that try to identify significantly enriched functional categories in these sets have gained increasing importance.
For the statistical evaluation of gene sets two basic approaches have been developed. The first method, the so called ‘Over-Representation Analysis’ (ORA), compares the set of interest to a reference set. When considering a certain functional category, i.e. a GO term, this method tries to detect if this category is over-represented or under-represented in the respective set and estimates how likely this is due to chance. The second method is called ‘Gene Set Enrichment Analysis’ (GSEA). Here, the input set is sorted by some specific criteria (e.g. gene expression values). When considering an arbitrary functional category, GSEA tests if the genes in the set that belong to the category are uniformly distributed or accumulated on top or on bottom of the sorted input list.
Some of the developed tools focus on the analysis of only one type of functional categories for example various Gene Ontology (GO) (1) based tools, among them FatiGO (2), BiNGO (3), and GOstat (4). Other tools focus on certain types of high-throughput data as microarray gene expression data [ErmineJ (5), CRSD (6), GSEA-P (7)] or offer only one type of statistical analysis, as the GSEA-P tool (7), that is designed for GSEA only. Furthermore, some tools, like Catmap (8), do not include biochemical categories and it is left to the user to define these categories. A few tool packages, however, allow for the analysis of different types of functional categories, e.g. WebGestalt (9) and Babelomics (10).
Here, we present GeneTrail, a web-based application, allowing for the identification of enriched functional categories in protein or gene sets. GeneTrail supports the ORA as well as the GSEA approach. In addition, our implementation of the GSEA analysis includes a novel algorithm that computes the correct p-value instead of estimating it by permutation tests. Since our tool is based on the comprehensive integrative system BN++ (11), GeneTrail allows the evaluation of a broad range of functional categories. The advantage of using the BN++ database BNDB is that we are able to find cross-links (e.g. using the data of different protein–protein interaction databases), which remain undetected using single databases. The current version of BN++ integrates for example the following biological data sources: RefSeq (12), KEGG (13), TRANSPATH (14), TRANSFAC (15), DIP (16), MINT (17), HPRD (18), IntAct (19). Besides the categories mentioned above, GeneTrail also offers amino acid sequence analyses as motif search, coiled-coil prediction or granzyme B cleavage site prediction, a chromosomal location analysis and a protein–protein interaction analysis.
With GeneTrail, we developed a user friendly web-based application, which can be easily extended concerning new functional categories or statistical methods for the evaluation of arbitrary high-throughput data. GeneTrail is freely accessible (http://genetrail.bioinf.uni-sb.de).
MATERIALS AND METHODS
Information resources and databases
GeneTrail imports KEGG (13) and TRANSPATH pathways (14), TRANSFAC transcription factors (15) and protein–protein interactions from DIP (16), MINT (17), HPRD (18) and IntAct (19) from the biochemical network database (BNDB). BNDB is a powerful relational database platform, allowing a complete semantic integration of an extensive collection of external databases. It is built upon a comprehensive and extensible object model called BioCore, which is powerful enough to model most known biochemical processes and at the same time it is easily extensible to be adapted to new biological concepts. This database is part of BN++ (11), the biochemical network library, which is freely available at http://www.bnplusplus.org. Additionally, GeneTrail uses a local copy of the GO database (1) that includes electronically inferred annotations (IEAs) and manually curated annotations. GeneTrail provides the user the option to analyze the complete data set or to exclude the IEAs. To complement the above mentioned data sources, our application imports different flat files from the NCBI containing current versions of gene identifiers and amino acid sequences. By using BN++ together with the described annotation files, GeneTrail allows for using many identifier types. A survey on supported gene identifiers is provided in Table 1. The listed identifiers are initially mapped to NCBI Gene IDs. These can directly be associated with most of the integrated categories, for example Gene Ontology terms. Thereby, a minimal loss of information is guaranteed.
Table 1.
Overview of the identifier types currently supported by GeneTrail
| Identifier | Examples |
|---|---|
| NCBI GeneID | 5894, 11186, 11848 |
| NCBI NP/XP number (Protein RefSeq) | NP_006261, XP_941900, NP_872606 |
| NCBI Protein GI | 28201876, 113431221, 121114292 |
| NCBI NM/XM number (RNA RefSeq) | NM_018993, NM_008284, NM_021168 |
| NCBI RNA GI | 54792783, 51093847, 91105420 |
| SwissProt/UniProt | Q9NZD4, P55008, O15155 |
| UniGene | Hs.652097, Hs.652094, Hs.652089 |
| Ensembl Gene ID | ENSG00000003147, ENSG00000005801 |
| SGD yeast ORF ID | YCR024C-B, YCR108C, YLR157W-E |
| Amersham Human Whole Genome | GE200018, GE897528, GE519380 |
| Affymetrix HG-U133A | 1487_at, 1320_at, 1316_at |
| Affymetrix HG-U95A | 1014_at, 1015_s_at, 1017_at |
| Affymetrix HG-U133 Plus 2.0 | 1552258_at, 1487_at, 1438_at |
| Affymetrix HG-U133B | 200017_at, 200018_at, 200013_at |
We have developed update routines ensuring that GeneTrail imports the most recent versions of flat files. The underlying database and all flat files are updated monthly.
Supported functional categories
Besides the functional categories from the KEGG, TRANSPATH and GO databases, GeneTrail also offers the possibility to study amino acid sequence properties, e.g. the presence of specific amino acid motifs, coiled–coiled structures [as described by Lupas et al. (20)] and granzyme B cleavage sites (21). Additionally, GeneTrail studies the enrichment of genes regulated by certain transcription factors from the TRANSFAC database or significant protein–protein interactions in the test set. Moreover, GeneTrail allows for studying the distribution of the genes in the test set on the chromosomes and chromosome arms.
GeneTrail can also be used to perform statistical analyses for self-defined functional categories. To use this option, a category file can be uploaded by the user. This file has to contain the category name with a leading ‘#’ symbol and the identifiers belonging to this category each separated by a line break.
To provide insight into tested categories, GeneTrail offers a comprehensive log file that can be accessed and downloaded from the web page. For each category, the log file contains the source of that category, and the number of genes in the considered category.
Statistical methods
GeneTrail provides two different types of statistical approaches. First, genes of a test set can be compared to a reference set (ORA). Second, a sorted test set can be analyzed without a reference set (GSEA). For each biological category, a significance value (P-value) is computed. Since many categories are usually tested, the raw P-values need to be adjusted for multiple testing.
Over-representation analysis (ORA)
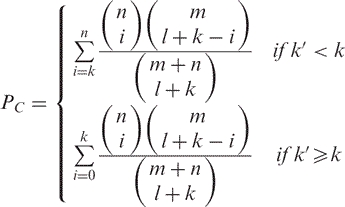
Suppose that we are given a test set of n genes of which k belong to a certain category C and a reference set of m genes of which l belong to C. Since l elements of the reference set belong to C, we expect to find k′ = l·n/m elements in the test set. If k is larger than k′, C is said to be enriched, if k is smaller than k′, C is said to be depleted. To estimate the statistical significance, P-values are computed. If the test set is a subset of the reference set, the hypergeometric test is applied to compute a one tailed P-value for C:
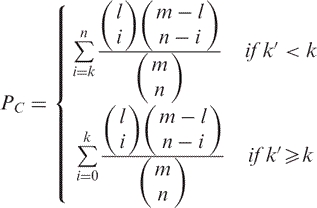 |
If test and reference set are disjoint, Fisher's exact test is used instead:
 |
Gene Set Enrichment Analysis (GSEA)
If the genes in the test set are sorted, e.g. by expression values, a running sum statistic is computed for each category C. This statistic shows whether the genes of C are accumulated on top (Figure 1A, B) or bottom (Figure 1C) of the sorted test set, or if they are randomly distributed (Figure 1D). Given a set of m genes of which l belong to C, the sorted list is processed from top to bottom. Whenever a gene of C is found, the running sum is increased by a certain amount, otherwise it is decreased. We consider the unweighted case where the running sum is increased by m − l or decreased by l, corresponding to a Kolmogorov–Smirnov non-parametric rank statistic [as described in (22) and (23)]. The minimum and maximum of the running sum statistic are used to estimate the significance of the enrichment. The P-value is computed as the probability that a random running sum reaches a value as high as the maximum of the running sum (accumulation on top) or as low as the minimum of the running sum (accumulation on bottom). Usually, these probabilities are computed by so-called permutation tests that are time consuming and provide only an estimation of the correct P-value. We developed a dynamic programming algorithm that computes the correct P-value time efficient (manuscript in preparation).
Figure 1.

Visualization of different running sum statistics when applying a ‘Gene Set Enrichment Analysis’. The running sum (y-axis) is shown as function of the index in the sorted list (x-axis). Part A and B of the figure illustrate a ‘mountain-like shape’ for top ranked genes. In part C, a ‘valley-like shape’ for bottom ranked genes is shown. Part D illustrates a ‘zigzag’ shape which is not statistically significant; the genes are randomly distributed.
Multiple testing adjustment
Since many categories are tested simultaneously, we are facing the well-known multiple testing problem. Therefore, GeneTrail offers two adjustment methods, the conservative Bonferroni adjustment and the control of the false discovery rate (FDR) according to Benjamini and Hochberg (24). Please note that the adjustment is performed separately for different category types like KEGG or TRANSPATH pathways.
Handling of replicates
For example in microarray experiments, genes are frequently represented by several transcripts of the microarray. Therefore, the uploaded sorted lists may include several data points for one gene. GeneTrail offers three possibilities to select a transcript, or in general a unique position for each gene in the sorted list: the first occurrence, the last occurrence or the median position of each gene can be selected. For the third option, in the case of an even number of positions for a given gene, we calculate the average of the two ‘middle’ positions in the sorted list. The new calculated ‘position’ must not be a natural number. If several genes have the same position, the one with the first occurrence in the original list is placed first etc.
GENETRAIL WEB SERVER
Workflow
The intuitive user interface of GeneTrail guides the user through several steps as illustrated for the ORA in Figure 2. First, the user has to select the organism and the identifier types (see also Table 1) for the genes or proteins. After uploading a test set the user can also upload a reference set or select a set from a pre-defined list. Before starting the analysis, the user has to specify the functional categories to be evaluated and the required parameters. The results of the computation are presented in two different ways. An HTML result page containing significant categories sorted by the calculated P-values and an interactive graph visualization. Figure 3 shows an excerpt of the HTML result page of the example set provided on the GeneTrail homepage. Figure 4 presents the graph visualization of the same example. The following two sections discuss the output of the web server in detail.
Figure 2.

This figure exemplifies the workflow of the GeneTrail server. The five steps needed to perform an ‘Over-Representation Analysis’ are shown in consecutive order. First, the organism and the identifier type have to be selected. Afterwards, a test set should be uploaded and a reference set can be uploaded or selected from a pre-defined list. Finally, the user can specify the desired analysis methods and the required parameters. For each step, we show small screenshots in the background taken from the GeneTrail user interface.
Figure 3.

HTML view excerpt of the output of the ORA performed on the example set provided on the GeneTrail web server homepage. The illustration shows the two significant KEGG pathway categories with the highest P-value. The red arrows denote the over-representation of these two categories. If available, the categories and the genes are connected via weblink to their external data sources.
Figure 4.

Graph visualization of the output of the ORA performed on the example set provided on the GeneTrail web server homepage. The left hand side shows an excerpt of the complete overview graph presented on the upper right. There are two types of nodes: oval nodes representing the genes in the example set and logos representing the categories. Blue edges connect the genes and the categories they are found in, black edges denote interactions of gene products.
Representation of the results
HTML-output
The results page summarizes the statistical significant functional categories that are enriched with respect to the test set. For each type of category we provide an overview, which can be extended to see details. The details comprise the functional category name (e.g. the name of a pathway or GO term), the computed P-value, a red or green arrow illustrating over- or under-representation with respect to ORA, the number of observed and expected genes, and, in the case of GSEA, an image of the running sum statistic. If possible, the functional categories are also linked to their original sources, e.g. KEGG or NCBI. For a better overview, we additionally visualize the results of the GO term analysis using the GO graph representation. Likewise, the protein–protein interactions are provided as a static graph. Images for GO and protein–protein interactions are, however, only available for sparse graphs.
GeneTrail also illustrates the distribution of genes along chromosomes. Usually, the genes are only represented by points or crosses at their genomic localization. To prevent problems with the visualization of genes that are located very closely to each other, we additionally describe the location of each gene using Gaussian normal distributions with user selectable variance and compute their joint distribution. Since the normal distributions of neighboring genes overlap, we get a more interpretable view of the chromosomal distribution of genes.
All generated files are compressed in a zip file that can be downloaded. This archive contains the HTML result page as well as a comprehensive PDF file.
Graph representation of the results
For a concise overview of the computed results, GeneTrail provides an interactive graph visualization implemented as a Java applet (see Figure 4).
There are two types of nodes in the graph. Oval nodes represent genes and logos categories. For the categories, the nodes’ shape corresponds to the data source, the nodes’ label to the category. In addition, we indicate an over- or under-representation by a red up-arrow or green down-arrow, respectively. Each gene node is labeled with its gene symbol. The edges are divided in four different classes. Blue edges connect genes and the categories they are found in, black edges denote interactions of gene products, green edges represent activation and red edges indicate inhibition.
We used a circular layout for the graph where genes that belong to the same category are located next to each other. This representation allows the user to easily identify the significant categories for each gene and the associated genes for each category. The user can stepwise include the categories or can include them all at once. This greatly facilitates the analysis of the categories and the corresponding genes by the user. Another useful feature permits to highlight significant categories for a given gene or the genes that belong to a significant category.
DISCUSSION
With GeneTrail we present a web-based application facilitating the statistical evaluation of high-throughput genomic or proteomic data sets. The statistical analysis takes into account the identification of a variety of functional categories that are ‘enriched’. The analysis is based on two different statistical approaches, namely ORA and GSEA.
The selection of the analysis method depends on the performed experiment. GSEA is only applicable for sorted gene sets, whereas ORA can be applied to the detection of over- or under-representations of categories in any data set compared to a reference set. In contrast to comparable methods, GSEA represents a threshold free approach. Frequently in ORA of microrarray data, the user determines which genes are considered as upregulated by choosing an expression threshold X. In contrast, GSEA does not rely on a chosen parameter but considers the entire sorted list of transcripts.
The relation of the data and the reference set is crucial. If the data set is a subset of the reference set, the hypergeometric distribution is used to compute P-values. For disjoint data and reference sets, Fisher's exact test is applied instead. In all other cases, GeneTrail offers the possibility to download an appropriate reference set disjoint to the data set.
One important feature of GeneTrail is a novel algorithm for computing the exact P-value in GSEA. So far, the statistical significance of GSEA is approximated by so-called permutation tests that usually consider only a small amount of all possible permutations. For example, regarding a microarray containing 20 000 genes and a category containing about 2000 genes, the number of possible arrangements is given as  , approximately 4·102821. Even if thousands of permutations are computed, this will probably not yield a good estimation of the P-value. However, with our approach, we are able to compute the correct P-value efficiently.
The offered statistical approaches treat the genes to work individually. This of course does not reflect the reality, where genes act together. The significance of findings, especially their sensitivity, may be improved by integrating additional information concerning the genes and their interactions, especially the topology of biological pathways. However, we have to carefully select the a priori biological information to be included. Since this information could be related to biological coherences we want to detect, we would introduce a bias into the data set.
A common problem of biological data management is the usage of appropriate identifier for genes or proteins. External identifiers need to be mapped to the identifiers used internally. In our case, the NCBI Gene IDs are the internal identifiers. If a provided data set does not contain NCBI Gene IDs, GeneTrail needs to convert these IDs. Therefore, we recommend the usage of NCBI Gene IDs to avoid possible mismatches.
The interactive graph visualization offers the possibility to grasp the interactions between genes of a data set and computed significant categories. However, large gene sets lead to complex graphs that are hard to visualize and to interpret. Currently, we are developing improved methods for online visualization of large graphs that we plan to integrate into future versions of GeneTrail.
GeneTrail offers the possibility to extract information from complex proteome data, microarray data or data generated by other high-throughput methods with minimal effort. Two examples of GeneTrail analyses can be found in the Supplementary Data. In conclusion, GeneTrail complements the conventional evaluation of experimental data and offers new starting points for further experimental investigation.
SUPPLEMENTARY DATA
Supplementary Data are available at NAR Online.
ACKNOWLEDGEMENTS
We appreciate the assistance of Tobias Zimmer in designing the web pages for the GeneTrail server. This work was supported in parts by the ‘Deutsche Forschungsgemeinschaft’, grant BIZ 4:1-4, the ‘Deutsche Krebshilfe’, grant 107342 and the ‘Klaus-Tschira-Stiftung’. Funding to pay the Open Access publication charges for this article was provided by internal funds of the Saarland University.
Conflict of interest statement. None declared.
REFERENCES
- 1.Ashburner M, Ball CA, Blake JA, Botstein D, Butler H, Cherry JM, Davis AP, Dolinski K, Dwight SS, et al. Gene Ontology: tool for the unification of biology. The Gene Ontology Consortium. Nat. Genet. 2000;25:25–29. doi: 10.1038/75556. [DOI] [PMC free article] [PubMed] [Google Scholar]
- 2.Al-Shahrour F, Diaz-Uriarte R, Dopazo J. FatiGO: a web tool for finding significant associations of Gene Ontology terms with groups of genes. Bioinformatics. 2004;20:578–580. doi: 10.1093/bioinformatics/btg455. [DOI] [PubMed] [Google Scholar]
- 3.Maere S, Heymans K, Kuiper M. BiNGO: a Cytoscape plugin to assess overrepresentation of gene ontology categories in biological networks. Bioinformatics. 2005;21:3448–3449. doi: 10.1093/bioinformatics/bti551. [DOI] [PubMed] [Google Scholar]
- 4.Beissbarth T, Speed TP. GOstat: find statistically overrepresented Gene Ontologies within a group of genes. Bioinformatics. 2004;20:1464–1465. doi: 10.1093/bioinformatics/bth088. [DOI] [PubMed] [Google Scholar]
- 5.Lee HK, Braynen W, Keshav K, Pavlidis P. ErmineJ: tool for functional analysis of gene expression data sets. BMC Bioinformatics. 2005;6:269. doi: 10.1186/1471-2105-6-269. [DOI] [PMC free article] [PubMed] [Google Scholar]
- 6.Liu CC, Lin CC, Chen WS, Chen HY, Chang PC, Chen JJ, Yang PC. CRSD: a comprehensive web server for composite regulatory signature discovery. Nucleic Acids Res. 2006;34:W571–W577. doi: 10.1093/nar/gkl279. [DOI] [PMC free article] [PubMed] [Google Scholar]
- 7.Subramanian A, Tamayo P, Mootha VK, Mukherjee S, Ebert BL, Gillette MA, Paulovich A, Pomeroy SL, Golub TR, et al. Gene set enrichment analysis: a knowledge-based approach for interpreting genome-wide expression profiles. Proc. Natl Acad. Sci. USA. 2005;102:15278–15279. doi: 10.1073/pnas.0506580102. [DOI] [PMC free article] [PubMed] [Google Scholar]
- 8.Breslin T, Eden P, Krogh M. Comparing functional annotation analyses with Catmap. BMC Bioinformatics. 2004;5:193. doi: 10.1186/1471-2105-5-193. [DOI] [PMC free article] [PubMed] [Google Scholar]
- 9.Zhang B, Kirov S, Snoddy J. WebGestalt: an integrated system for exploring gene sets in various biological contexts. Nucleic Acids Res. 2005;33:W741–W748. doi: 10.1093/nar/gki475. [DOI] [PMC free article] [PubMed] [Google Scholar]
- 10.Al-Shahrour F, Minguez P, Vaquerizas JM, Conde L, Dopazo J. BABELOMICS: a suite of web tools for functional annotation and analysis of groups of genes in high-throughput experiments. Nucleic Acids Res. 2005;33:W460–W464. doi: 10.1093/nar/gki456. [DOI] [PMC free article] [PubMed] [Google Scholar]
- 11.Küntzer J, Blum T, Gerasch A, Backes C, Hildebrandt A, Kaufmann M, Kohlbacher O, Lenhof H-P. BN++ – A biological information system. J. Integr. Bioinformatics. 2006;3:34. [Google Scholar]
- 12.Pruitt KD, Tatusova T, Maglott DR. NCBI reference sequence (RefSeq): a curated non-redundant sequence database of genomes, transcripts and proteins. Nucleic Acids Res. 2005;33:D501–D504. doi: 10.1093/nar/gki025. Database Issue. [DOI] [PMC free article] [PubMed] [Google Scholar]
- 13.Kanehisa M, Goto S, Hattori M, Aoki-Kinoshita KF, Itoh M, Kawashima S, Katayama T, Araki M, Hirakawa M. From genomics to chemical genomics: new developments in KEGG. Nucleic Acids Res. 2006;34:D354–D357. doi: 10.1093/nar/gkj102. Database Issue. [DOI] [PMC free article] [PubMed] [Google Scholar]
- 14.Krull M, Pistor S, Voss N, Kel A, Reuter I, Kronenberg D, Michael H, Schwarzer K, Potapov A, et al. TRANSPATH: an information resource for storing and visualizing signaling pathways and their pathological aberrations. Nucleic Acids Res. 2006;34:D546–D551. doi: 10.1093/nar/gkj107. Database Issue. [DOI] [PMC free article] [PubMed] [Google Scholar]
- 15.Matys V, Kel-Margoulis O, Fricke E, Liebich I, Land S, Barre-Dirrie A, Reuter I, Chekmenev D, Krull M, et al. TRANSFAC and its module TRANSCompel: transcriptional gene regulation in eukaryotes. Nucleic Acids Res. 2006;34:D108–D110. doi: 10.1093/nar/gkj143. Database Issue. [DOI] [PMC free article] [PubMed] [Google Scholar]
- 16.Salwinski L, Miller CS, Smith AJ, Pettit FK, Bowie JU, Eisenberg D. The database of interacting proteins: 2004 update. Nucleic Acids Res. 2004;32:D449–D451. doi: 10.1093/nar/gkh086. Database Issue. [DOI] [PMC free article] [PubMed] [Google Scholar]
- 17.Zanzoni A, Montecchi-Palazzi L, Quondam M, Ausiello G, Helmer-Citterich M, Cesareni G. MINT: a Molecular INTeraction database. FEBS Lett. 2002;513:135–140. doi: 10.1016/s0014-5793(01)03293-8. [DOI] [PubMed] [Google Scholar]
- 18.Peri S, Navarro JD, Amanchy R, Kristiansen TZ, Jonnalagadda CK, Surendranath V, Niranjan V, Muthusamy B, Gandhi TK, et al. Development of human protein reference database as an initial platform for approaching systems biology in humans. Genome Res. 2003;13:2363–2371. doi: 10.1101/gr.1680803. [DOI] [PMC free article] [PubMed] [Google Scholar]
- 19.Hermjakob H, Montecchi-Palazzi L, Lewington C, Mudali S, Kerrien S, Orchard S, Vingron M, Roechert B, Roepstorff P, et al. IntAct – an open source molecular interaction database. Nucleic Acids Res. 2004;32:D452–D455. doi: 10.1093/nar/gkh052. Database Issue. [DOI] [PMC free article] [PubMed] [Google Scholar]
- 20.Lupas A, Van Dyke M, Stock J. Predicting coiled coils from protein sequences. Science. 1991;252:1162–1164. doi: 10.1126/science.252.5009.1162. [DOI] [PubMed] [Google Scholar]
- 21.Backes C, Küntzer J, Lenhof HP, Comtesse N, Meese E. GraBCas: a bioinformatics tool for score-based prediction of Caspase- and Granzyme B-cleavage sites in protein sequences. Nucleic Acids Res. 2005;33:W208–W213. doi: 10.1093/nar/gki433. [DOI] [PMC free article] [PubMed] [Google Scholar]
- 22.Hollander M, Wolfe D. Nonparametric Statistical Methods. 1999. 2nd edn. Wiley, New York, USA. [Google Scholar]
- 23.Lamb J, Ramaswamy S, Ford HL, Contreras B, Martinez RV, Kittrell FS, Zahnow CA, Patterson N, Golub TR, et al. A mechanism of cyclin D1 action encoded in the patterns of gene expression in human cancer. Cell. 2003;114:323–332. doi: 10.1016/s0092-8674(03)00570-1. [DOI] [PubMed] [Google Scholar]
- 24.Benjamini Y, Hochberg Y. Controlling the false discovery rate: a practical and powerful approach to multiple testing. J. R. Stat. Soc. B. 1995;57:289–300. [Google Scholar]