Abstract
Onto-Tools is a freely available web-accessible software suite, composed of an annotation database and nine complementary data-mining tools. This article describes a new tool, Onto-Express-to-go (OE2GO), as well as some new features implemented in Pathway-Express and Onto-Miner over the past year. Pathway-Express (PE) has been enhanced to identify significantly perturbed pathways in a given condition using the differentially expressed genes in the input. OE2GO is a tool for functional profiling using custom annotations. The development of this tool was aimed at the researchers working with organisms for which annotations are not yet available in the public domain. OE2GO allows researchers to use either annotation data from the Onto-Tools database, or their own custom annotations. By removing the necessity to use any specific database, OE2GO makes the functional profiling available for all organisms, with annotations using any ontology. The Onto-Tools are freely available at http://vortex.cs.wayne.edu/projects.htm.
INTRODUCTION
Together with the ability of generating a large amount of data per experiment, high-throughput technologies also brought the challenge of translating such data into a better understanding of the underlying biological phenomena. First released in 2001, Onto-Tools is a freely available web-accessible software suite that addresses some of these challenges. The Onto-Tools suite includes: (i) Onto-Express—used to translate lists of differentially regulated genes into a better understanding of the underlying biological phenomena (1–5); (ii) Onto-Design—used to select the best set of genes to be included on a custom microarray designed for the study of a given biological phenomenon (2,4); (iii) Onto-Compare—used to analyze the functional bias of various focused commercial microarrays and select the one that is most appropriate for a given biological hypothesis (2,6); (iv) Onto-Translate—used to translate lists of genes from one reference system to another (e.g. from GenBank accession numbers to UniGene cluster IDs to Affymetrix probe IDs, etc.) (2,5,7,8); (v) Onto-Miner—provides a unified access point and an application programming interface (API) allowing queries for various information such as the gene name, official symbol, reference accession number, coded protein, etc. (4); (vi) Promoter-Express—which allows the users to find condition-specific transcription factor binding sites (TFBSs) (7,9) and (vii) nsSNPCounter—which allows analysis of synonymous and non-synonymous codon substitutions in protein coding genes (7). Previous publications have described in detail the motivation, implementation and validation of these tools. The logical workflow between the Onto-Tools applications has also been previously explained (2,4). This article describes two new tools added to the ensemble and discusses other enhancements recently made to the existing tools.
OE2GO
Onto-Express (OE) is a web-based tool in the Onto-Tools suite that performs automated function profiling for a list of differentially expressed genes. However, Onto-Express does not support functional profiling for the organisms that do not have annotations in public domain, or use of custom (i.e. user-defined) ontologies. This limitation is also true for most of the other existing tools for functional profiling (10), which means that researchers working with uncommon organisms and/or new annotations or ontologies may be forced to construct such profiles manually.
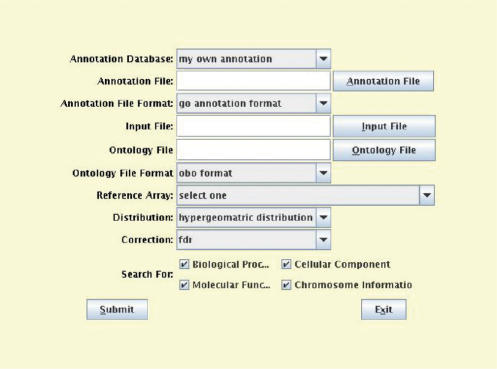
Onto-Express-to-go (OE2GO) is a new tool added to the Onto-Tools ensemble to address these issues. OE2GO is built on top of OE to leverage its existing functionality. In OE2GO, the users now have an option to use either the Onto-Tools database as a source of functional annotations or provide their own annotations in a separate file (Figure 1). Currently, OE2GO supports annotation file in the Gene Ontology format. A GO-formatted annotation file has 15 tab-delimited columns that contain a database name, a unique ID for an entity being annotated, its corresponding symbol, one or more references supporting an annotation, type of evidence, date of annotation, type of entity (e.g. a gene or a protein), etc. The detailed description of the format and each column is available at www.geneontology.org/GO.annotation.shtml. The annotation files for approximately 40 organisms in GO format are available for download from GO ftp site that can be directly used with OE2GO (ftp://ftp.geneontology.org/pub/go/gene-associations/).
Figure 1.
OE2GO input interface for using custom annotations. When the user selects ‘my own annotations’, OE2GO allows the user to specify the name of the annotation file in GO format and the ontology file in OBO format. When using custom annotations, OE2GO assumes that the identifiers in the input file are of the same type as those used in the annotations file.
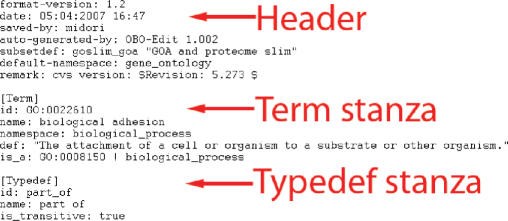
As shown in Figure 1, when using custom annotations, the user must also specify the ontology file in OBO format. Figure 2 shows an example ontology file in OBO format. An ontology file in OBO format contains a header section and a number of stanzas consisting of a set of tag-value pairs. A tag-value pair consists of a tag name, a colon and a tag value. The header section must be before any stanzas, and contains meta-information about the ontology such as its creation date, default namespace, remarks, format version, etc. (Figure 2). A stanza can be of type ‘Term’ or ‘Typedef’, where a term stanza describes an ontology term, and a typedef stanza describes a type of relationship between two terms in the ontology. A complete detailed description of the format is available at www.geneontology.org/GO.format.shtml. OE2GO uses Java code from an open-source tool OBO-edit in order to parse the ontology file in OBO format. The Gene Ontology Consortium provides an ontology file in OBO format that can be directly used with OE2GO (www.geneontology.org/ontology/gene_ontology_edit.obo).
Figure 2.
An example OBO formatted ontology file that contains a header, a term stanza and a typedef stanza. Each stanza starts with either ‘[Term]’ or ‘[Typedef]’. The header and the stanzas contain a set of tag-value pairs in <tag>:<value> format. The complete list of allowed tags for each type of stanza and the header are described on GO web site.
For each gene in the input file, OE2GO searches the annotation file specified by the user. Hence, the functional profiles created by OE2GO depend on the information present in the annotation file. If the file does not contain the annotations that are otherwise well known, they are not provided in the OE2GO results. The strength of OE2GO is that it enables the researchers to use the functional annotations that are not yet in the public domain, by allowing them to be included in the annotation file. Another advantage of OE2GO is that it enables the researchers to avoid annotation bias (10) by allowing them to remove the biological processes that are more studied than the others from the annotation file.
PATHWAY-EXPRESS
The automated functional profiling approach, first proposed by Onto-Express in 2001, has now become the de facto standard in the second stage analysis of gene expression data (10). A large number of tools performing similar ontological analysis are available today. Although this approach is widely adopted, it considers each biological process independent of the others, and ignores dependencies and interactions among them (10).
At the same time, a number of pathway databases available in public domain describe how genes interact with each other in metabolic and signaling pathways (e.g. KEGG (11), BioCarta (www.biocarta.com), Reactome (12), etc.). Several tools that allow researchers to reveal the pathways associated with a given set of differentially expressed genes already exist (13–23).
Pathway-Express (PE) is a tool in the Onto-Tools ensemble that is designed to perform a pathway analysis. When a user submits a list of genes, PE searches the Onto-Tools database and builds a list of all associated pathways. The Onto-Tools database currently contains signaling pathways from KEGG. However, PE can analyze any collection of pathways described in SBML (24). PE performs a classical enrichment analysis based on a hypergeometric distribution in order to identify those pathways that contain a proportion of differentially expressed genes that is significantly different from what is expected just by chance. This analysis produces a set of P-values that characterize the significance of the pathway from this statistical perspective (a lower P-value corresponds to a higher significance).
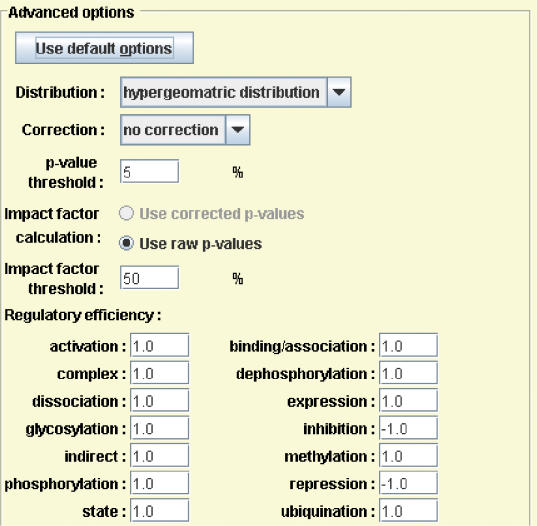
PE also calculates a perturbation factor PF(g) for each gene on each pathway. This perturbation factor takes into consideration the (i) normalized fold change of the gene and (ii) the number and amount of perturbation of genes upstream of it (i.e. its position on a pathway). The users can use ‘Advanced Options’ button to specify different weights for different types of interactions between genes on the pathways (Figure 3). As shown in Figure 3, PE uses negative weights for ‘inhibition’ and ‘repression’. This gene perturbation factor reflects the relative importance of each differentially expressed gene on the pathway. The impact factor of the entire pathway is calculated using a probabilistic term that takes into consideration the proportion of differentially expressed genes on the pathway and gene perturbation factors of all genes in the pathway. More details about the gene perturbation factors and pathway impact factors, a comparison with the existing methods, and a full discussion of the advantages and disadvantages of these methods are described elsewhere.
Figure 3.
Pathway-Express advanced options. Pathway-Express allows the users to choose advanced options such as the distribution to use for calculating significance of pathways, the type of correction to apply for multiple hypotheses, whether to use P-values or corrected P-values for calculating impact factor, etc. It also allows a user to specify different weights for different types of interactions (e.g. activation, binding, repression, phosphorylation, etc.) between genes on the pathways.
When a user submits a list of input IDs, PE converts the list into a list of gene IDs using the Onto-Tools database. The Onto-Tools database integrates a number of public databases including GenBank, dbEST, UniGene, Entrez Gene, RefSeq, KEGG, etc. After creating a list of gene IDs, PE searches the KEGG pathways in the Onto-Tools database for each input gene, and builds a list of pathways containing at least one input gene. Note that the pathways returned by PE depend on the annotations available in KEGG. If a gene is known to be involved in a pathway, but is not annotated as such in KEGG, PE does not return the pathway in its output.
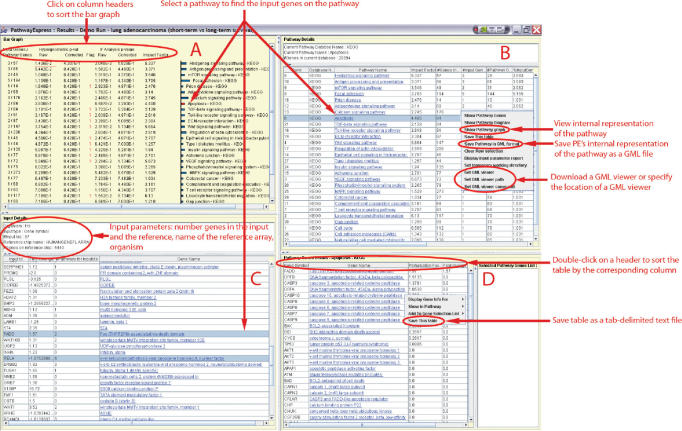
The output of PE is shown in Figure 4. The top left panel displays detailed results for each pathway including: number of input genes and total number of genes on a pathway, probability of obtaining the same number of genes on a given pathway by random chance, impact factor and probability of obtaining the impact factor by random chance for a given pathway, etc. The bar graph in panel A can be sorted in increasing or decreasing order of any column by clicking on the corresponding column header. The bar graph in panel A, pathway details in panel B and input details in panel C are synchronized with each other. For instance, in Figure 4, selecting the apoptosis pathway in panel B, highlights the corresponding bar in red color in panel A and also selects the input genes in panel C (i.e. genes FADD and RELA).
Figure 4.
Pathway-Express output. PE output is organized in four panels. Panel A summarizes the results as a bar graph. Panel B provides details about each pathway including: (i) number of genes on the pathway, (ii) number of genes found in the reference array that are on the pathway, (iii) number of input genes found on the pathway, (iv) its impact factor, (v) database identifier of the pathway, etc. Panel C provides input details including the input ID, its corresponding gene name and symbol, number of pathways the gene is found on, and the fold change as provided by the user. Double-clicking a pathway name in panel B provides a list of genes on that pathway in panel D along with their perturbation factor.
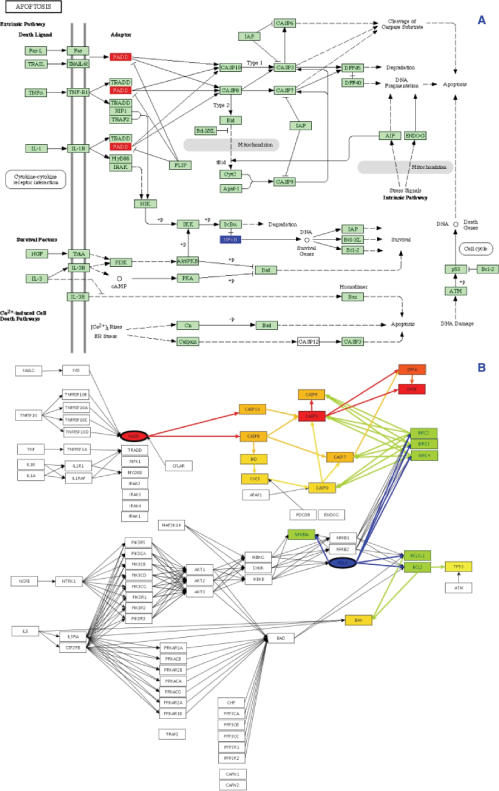
Right-clicking a mouse in the PE output window brings up a context-sensitive popup menu (Figure 4). For instance, the menu displayed by clicking a mouse on a pathway name allows the user to view the corresponding KEGG pathway diagram, download and specify a GML viewer to use with PE, etc. The KEGG pathway diagram that corresponds to the selected pathway can also be viewed by double-clicking the pathway name in either panel A or panel B. PE highlights the input genes in red (up-regulated genes) or blue (down-regulated) in the KEGG diagram (Figure 5). The popup menu also allows to save a pathway in GML format that can be viewed in any GML viewer. This can be done by selecting ‘Save in GML format’ from the popup menu. If a program able to read GML files (e.g. yEd (www.yed.com) or Cytoscape (21)) is already installed on the local machine, the user can specify its location by selecting ‘Set GML viewer command’ from the popup menu. After specifying the GML viewer, a user can select ‘Show pathway graph’ to access GML representation of the pathway from within PE. All tables in the PE output can be saved as a tab-delimited text file by selecting ‘Save this table’ from the popup menu.
Figure 5.
The apoptosis pathway as described by KEGG (panel A) and its internal representation, as constructed by Pathway-Express (panel B). PE can save this internal representation in a GML file that can be exported to any other visualization application. In this internal representation, each node corresponds to a gene, and each edge represents an interaction between two genes. In this example, the up-regulated input gene FADD is highlighted with red color and down-regulated gene RELA is highlighted with blue color in both panels. The internal graph also shows how PE propagates the perturbation through the pathway, where the direction of an arrow represents the direction of propagation. Note that in some cases, a gene in KEGG diagram may represent a group of genes. For instance, gene PI3K in the KEGG diagram in fact corresponds to a group of eight nodes in PE's internal representation: PIK3R5, PIK3CA, PIK3CB, PIK3CD, PIK3CG, PIK3R1, PIK3R2 and PIK3R3.
Figure 5 also shows the internal representation of the apoptosis pathway (read from the GML file) with the two input genes represented by elliptic nodes. PE's internal representation also shows how perturbation introduced by the genes FADD and RELA is propagated throughout the pathway in the given condition. The perturbed genes on the apoptosis pathway are shown with colored background, whereas the unperturbed genes are shown with white background, and the direction of the propagation is indicated by an arrow between two genes. In Figure 5, notice that only the area of the pathway downstream of the input genes is perturbed, while the rest of the pathway is unperturbed.
ENHANCEMENTS
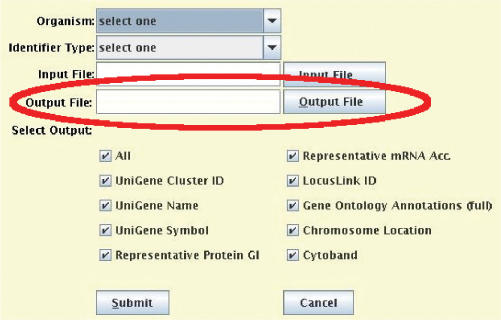
Over the past year, Onto-Miner (OM) has been reimplemented as a Java tool to make its interface user friendly and consistent with the Onto-Tools suite. The previous HTML input interface of OM is replaced by a new Java interface that is easier to use (Figure 6). Unlike previous version of OM that required the user to manually download the results from the server, OM now automatically downloads the result file from the Onto-Tools server and saves it in the location specified by the user.
Figure 6.
New Onto-Miner input interface. OM automatically retrieves the results from the Onto-Tools server and saves them into the output file specified by the user.
ACKNOWLEDGMENTS
This material is based upon work supported by the following grants: NSF DBI-0234806, CCF-0438970, 1R01HG003491-01A1, 1U01CA117478-01, 1R21CA100740-01, 1R01NS045207-01, 5R21EB000990-03 and 2P30 CA022453-24. Onto-Tools currently runs on equipment provided by Sun Microsystems EDU 7824-02344-U and by NIH(NCRR) 1S10 RR017857-01. Any opinions, findings and conclusions or recommendations expressed in this material are those of the author(s) and do not necessarily reflect the views of the NSF, NIH, DOD or any other of the funding agencies. Funding to pay the Open Access publication charges for this article was provided by NSF DBI-0234806.
Conflict of interest statement. None declared.
REFERENCES
- 1.Khatri P, Draghici S, Ostermeier GC, Krawetz SA. Profiling gene expression using onto-express. Genomics. 2002;79:266–270. doi: 10.1006/geno.2002.6698. [DOI] [PubMed] [Google Scholar]
- 2.Draghici S, Khatri P, Bhavsar P, Shah A, Krawetz SA, Tainsky MA. Onto-tools, the toolkit of the modern biologist: Onto-express, onto-compare, onto-design and onto-translate. Nucleic Acids Res. 2003;31:3775–3781. doi: 10.1093/nar/gkg624. [DOI] [PMC free article] [PubMed] [Google Scholar]
- 3.Draghici S, Khatri P, Martins RP, Ostermeier GC, Krawetz GA. Global functional profiling of gene expression. Genomics. 2003;81:98–104. doi: 10.1016/s0888-7543(02)00021-6. [DOI] [PubMed] [Google Scholar]
- 4.Khatri P, Bhavsar P, Bawa G, Draghici S. Onto-tools: an ensemble of web-accessible, ontology-based tools for the functional design and interpretation of high-throughput gene expression experiments. Nucleic Acids Res. 2004;32:W449–W456. doi: 10.1093/nar/gkh409. [DOI] [PMC free article] [PubMed] [Google Scholar]
- 5.Khatri P, Sellamuthu S, Malhotra P, Amin K, Done A, Draghici S. Recent additions and improvements to the onto-tools. Nucleic Acids Res. 2005;33:W762–W765. doi: 10.1093/nar/gki472. [DOI] [PMC free article] [PubMed] [Google Scholar]
- 6.Draghici S, Khatri P, Shah A, Tainsky M. BioTechniques, Microarrays and Cancer: Research and Applications. 2003. Assessing the functional bias of commercial microarrays using the onto-compare database; pp. 55–61. [PubMed] [Google Scholar]
- 7.Khatri P, Desai V, Tarca AL, Sellamuthu S, Wildman DE, Romero R, Draghici S. New onto-tools: Promoter-express, nsSNPCounter and onto-translate. Nucleic Acids Res. 2006;34:W626–W631. doi: 10.1093/nar/gkl213. [DOI] [PMC free article] [PubMed] [Google Scholar]
- 8.Draghici S, Sellamuthu S, Khatri P. Babel's tower revisited: a universal resource for cross-referencing across annotation databases. Bioinformatics. 2006;22:2934–2939. doi: 10.1093/bioinformatics/btl372. [DOI] [PMC free article] [PubMed] [Google Scholar]
- 9.Desai V, Khatri P, Done A, Friedman A, Tainsky M, Draghici S. A novel bioinformatics technique for predicting condition-specific transcription factor binding sites. Proceedings of IEEE Symposium on Computational Intelligence in Bioinformatics and Computational Biology; USA: San Diego; 2005. [Google Scholar]
- 10.Khatri P, Draghici S. Ontological analysis of gene expression data: current tools, limitations, and open problems. Bioinformatics. 2005;21:3587–3595. doi: 10.1093/bioinformatics/bti565. [DOI] [PMC free article] [PubMed] [Google Scholar]
- 11.Ogata H, Goto S, Sato K, Fujibuchi W, Bono H, Kanehisa M. Kegg: Kyoto encyclopedia of genes and genomes. Nucleic Acids Res. 1999;27:29–34. doi: 10.1093/nar/27.1.29. [DOI] [PMC free article] [PubMed] [Google Scholar]
- 12.Joshi-Tope G, Gillespie M, Vasrik I, D’Eustachio P, Schmidt E, de Bone B, Jassal B, Gopinath GR, Wu GR, et al. Reactome: a knowledgebase of biological pathways. Nucleic Acids Res. 2005;33:D428–D432. doi: 10.1093/nar/gki072. [DOI] [PMC free article] [PubMed] [Google Scholar]
- 13.Chung H-J, Kim M, Park CH, Kim J, Kim JH. Arrayxpath: mapping and visualizing microarray gene-expression data with integrated biological pathway resources using scalable vector graphics. Nucleic Acids Res. 2004;32:W460–W464. doi: 10.1093/nar/gkh476. [DOI] [PMC free article] [PubMed] [Google Scholar]
- 14.Dahlquist KD, Salomonis N, Vranizan K, Lawlor SC, Conklin BR. Genmapp, a new tool for viewing and analyzing microarray data on biological pathways. Nat. Genet. 2002;31:19–20. doi: 10.1038/ng0502-19. [DOI] [PubMed] [Google Scholar]
- 15.Doniger SW, Salomonis N, Dahlquist KD, Vranizan K, Lawlor SC, Conklin BR. Mappfinder: using gene ontology and genmapp to create a global gene expression profile from microarray data. Genome biol. 2003;4:R7. doi: 10.1186/gb-2003-4-1-r7. [DOI] [PMC free article] [PubMed] [Google Scholar]
- 16.Grosu P, Townsend JP, Hartl DL, Cavalieri D. Pathway processor: a tool for integrating whole-genome expression results into metabolic networks. Genome Res. 2002;12:1121–1126. doi: 10.1101/gr.226602. [DOI] [PMC free article] [PubMed] [Google Scholar]
- 17.Holford M, Li N, Nadkarni P, Zhao H. Vitapad: visualization tools for the analysis of pathway data. Bioinformatics. 2004;21:1596–1602. doi: 10.1093/bioinformatics/bti153. [DOI] [PubMed] [Google Scholar]
- 18.Nikitin A, Egorov S, Daraselia N, Mazo I. Pathway studio – the analysis and navigation of molecular networks. Bioinformatics. 2003;19:2155–2157. doi: 10.1093/bioinformatics/btg290. [DOI] [PubMed] [Google Scholar]
- 19.Pan D, Sun N, Cheung K-H, Guan Z, Ma L, Holford M, Deng X, Zhao H. Pathmapa: a tool for displaying gene expression and performing statistical tests on metabolic pathways at multiple levels for arbidopsis. BMC Bioinformatics. 2003;4:56. doi: 10.1186/1471-2105-4-56. [DOI] [PMC free article] [PubMed] [Google Scholar]
- 20.Pandey R, Guru RK, Mount DW. Pathway miner: extracting gene association networks from molecular pathways for predicting the biological significance of gene expression microarray data. Bioinformatics. 2004;20:2156–2158. doi: 10.1093/bioinformatics/bth215. [DOI] [PubMed] [Google Scholar]
- 21.Shannon P, Markiel A, Ozier O, Baliga NS, Wang JT, Ramage D, Amin N, Schwikowski B, Ideker T. Cytoscape: a software environment for integrated models of biomolecular interaction networks. Genome Res. 2003;13:2498–2504. doi: 10.1101/gr.1239303. [DOI] [PMC free article] [PubMed] [Google Scholar]
- 22.Hosack DA, Dennis G, Jr, Sherman BT, Lane HC, Lempicki RA. Identifying biological themes within lists of genes with EASE. Genome Biol. 2003;4:P4. doi: 10.1186/gb-2003-4-10-r70. [DOI] [PMC free article] [PubMed] [Google Scholar]
- 23.Durinck S, Moreau Y, Kasprzyk A, Davis S, De Moor B, Brazma A, Huber W. BioMart and Bioconductor: a powerful link between biological databases and microarray data analysis. Bioinformatics. 2005;21:3439–3440. doi: 10.1093/bioinformatics/bti525. [DOI] [PubMed] [Google Scholar]
- 24.Hucka M, Finney A, Sauro HM, Bolouri H, Doyle JC, Kitano H, Arkin AP, Bornstein BJ, Bray D, et al. The systems biology markup language (sbml): a medium for representation and exchange of biochemical network models. Bioinformatics. 2003;19:524–531. doi: 10.1093/bioinformatics/btg015. [DOI] [PubMed] [Google Scholar]


