


Abstract
Correct interactions between transcription factors (TFs) and their binding sites (TFBSs) are of central importance to gene regulation. Recently developed chromatin-immunoprecipitation DNA chip (ChIP-chip) techniques and the phylogenetic footprinting method provide ways to identify TFBSs with high precision. In this study, we constructed a user-friendly interactive platform for dynamic binding site mapping using ChIP-chip data and phylogenetic footprinting as two filters. MYBS (Mining Yeast Binding Sites) is a comprehensive web server that integrates an array of both experimentally verified and predicted position weight matrixes (PWMs) from eleven databases, including 481 binding motif consensus sequences and 71 PWMs that correspond to 183 TFs. MYBS users can search within this platform for motif occurrences (possible binding sites) in the promoters of genes of interest via simple motif or gene queries in conjunction with the above two filters. In addition, MYBS enables users to visualize in parallel the potential regulators for a given set of genes, a feature useful for finding potential regulatory associations between TFs. MYBS also allows users to identify target gene sets of each TF pair, which could be used as a starting point for further explorations of TF combinatorial regulation. MYBS is available at http://cg1.iis.sinica.edu.tw/~mybs/.
INTRODUCTION
Eukaryotic gene expression is achieved by multiple layers of regulation, including transcription regulation, which requires transcription factors (TFs) to bind to their respective DNA binding sites (TFBSs) in a correct spatial and temporal manner (1). Identifying and characterizing the binding sites of TFs can permit a more comprehensive and quantitative mapping of the regulatory mechanisms within cells. Unfortunately, TFBSs are usually short (∼5–15 bp) and degenerate (2), making it difficult to define TFBSs experimentally or computationally.
In Saccharomyces cerevisiae, there are only a limited number of functional TFBSs that have been experimentally verified (3). Inference of TFBSs has thus been relying heavily on computational approaches. A number of plausible motif consensus sequences have been deduced by different bioinformatics methods that exploit sequence information. However, there have been reservations on using those consensuses to annotate the genome due to excessive false positives. Fortunately, the chromatin-immunoprecipitation DNA chip (ChIP-chip) technique (4,5) provides a powerful way to verify the DNA-binding affinity of TFs. In addition, phylogenetic footprinting methods that assume conservation of functional elements during evolution have been utilized to reveal TFBSs that are conserved across species (6,7).
A fair amount of confident TFBS information has been accumulated in various databases during the last few years. For example, SCPD (3), SGD (8), TRANSFAC (9), YPD (10) and YEASTRACT (11) contain an array of TF motif consensus sequences derived from the literature and experimental data. Some of them use simple sequence matching schemes to annotate the genome, which is noisy. SGD in particular remaps the TFBSs inferred by Harbison et al. (5), which took advantage of ChIP-chip data and phylogenetic information. However, SGD has a priori assumptions about the degree of conservation across species and binding affinities of TFs. SwissRegulon (12,13) is another database where the site annotations were produced using several algorithms to perform on related genomes in combination with known sites from the literature, in addition to using ChIP-chip binding data. SwissRegulon contains a variety of experimentally verified or computationally predicted TFBSs for the entire genomes of 18 organisms. However, SwissRegulon currently lacks information about the degree of conservation across species and related condition-specific ChIP-chip experiments for TFBSs.
Since the degree of conservation across species and binding affinities of TFs vary among TFs, we construct a comprehensive web server, mining yeast binding sites (MYBS), which integrates several types of data related to transcriptional regulation in S. cerevisiae. Via simple motif or gene queries, MYBS allows users to apply ChIP-chip data and phylogenetic footprinting filters on genomic data to perform dynamic binding site mapping.
DATA INTEGRATION
MYBS integrates three main types of data, including related yeast genomic sequences, ChIP-chip data and motif information. Currently, the genomic sequences of eight yeast species (S. cerevisiae, S. paradoxus, S. kudriavzevii, S. mikatae, S. bayanus, S. castellii, S. kluyveri and Candida glabrata) are included. For each gene in S. cerevisiae, we downloaded the promoter sequences (∼1000 bp, intergenic regions only) of its orthologous genes in other six Saccharomyces species from SGD (8). Since the genome of C. glabrata is not annotated in SGD, for each gene in S. cerevisiae we found its C. glabrata orthologue from http://cbi.labri.fr/Genolevures/download/CAGL_annot.php (14) and then downloaded its promoter sequence from the RSAT website (http://rsat.ulb.ac.be/rsat/) (15). For each gene in S. cerevisiae, we performed multiple sequence alignments using ClustalW (16). Currently we have integrated ChIP-chip experiments under various conditions from Harbison et al. (5). In fact, it is rather easy for MYBS to include other ChIP-chip data.
We collected consensus sequences or position weight matrixes (PWMs) of TFs in S. cerevisiae from confident literatures (5,6,17,18) and a variety of motif databases, including SCPD (3), SGD (8), TRANSFAC (9), YPD (10), YEASTRACT (11), SwissRegulon (12,13) and YTFD (http://biochemie.web.med.uni-muenchen.de/YTFD/). As a result, MYBS contains a collection of 481 binding motif consensus sequences and 71 known PWMs that correspond to 183 TFs. For those motifs in the consensus form, we generate the corresponding substitution-derived position frequency matrixes (PFMs) according to the model of Doniger et al. (19), which is constructed from all occurrences of the consensus sequence in S. cerevisiae with 0 or 1 difference in the orthologous positions in the other four species. For each PFM, we generate its PWM and calculate its cutoff using PATSER (20) with the S. cerevisiae background frequencies (A,T: 0.31 and C,G: 0.19). PATSER was developed to search for TFBSs in the promoter sequences. For each weight matrix of length w, PATSER scores each w-mer under the motif model or the background nucleotide frequencies. PATSER also calculates a P-value threshold using the information content. This P-value threshold is then used to filter out low-scoring sites. In MYBS we set the threshold to 0.01 in order to balance the sensitivity and specificity, while speeding up the query processes. We then use these PWMs and their cutoffs to scan multiple alignments of orthologous intergenic promoter sequences for matched occurrences.
WEB APPLICATION
MYBS provides a web-based interface with three main features: binding sites mining, regulatory association searching and target gene selection for each TF pair. MYBS allows users to search for occurrences of a motif in the promoters of a gene, or potential binding sites for a TF. For binding motifs and TFs, their target genes are also reported. MYBS also enables users to visualize in parallel the potential regulators for a given set of genes and allows users to obtain target/non-target gene sets of a pair of TFs in different combinations.
For each function, MYBS allows users to search for occurrences of possible binding sites computationally without using any filters or by applying two filters—phylogenic information and ChIP-chip data—to improve the accuracy of binding site search. The user may request that a TFBS be conserved across a user-defined number of species (ranging from zero to seven) within a neighboring region of 25 bp upstream and downstream of the binding site occurrence in S. cerevisiae. In addition, the user can alter the degree of experimental support for TF-DNA binding affinity by setting the P-value in a ChIP-chip experiment.
The underlying core of MYBS is the integration of motif information. Each motif is linked to one or more TFs, and points to a set of genes whose promoter sequences contain incidences of the motif. Similarly, there may be multiple consensuses accrued from various sources listed for a given TF (Figure 1). The bi-directional search can start from a TF, a motif or a gene, and allows for easy identification of regulatory associations between TFs and between motifs. For example, the user can query a short sequence pattern (I.U.B. code allowed) to acquire a list of matching binding motif consensuses. One can choose a motif from the list for detailed information, including its corresponding TFs, the sequence logo, the PWMs and the cutoff thresholds of the PWMs. In addition, MYBS allows users to scan any given sequences for binding occurrences of the selected motif. The user can further select which TF he/she is interested in. With the choice of either or both of two user-defined filters, MYBS provides a potential target gene list of the selected motif and allows the user to look into visualized sequence information for one or multiple genes simultaneously. The user can include or exclude certain databases in the process, and also discover other potential regulators of the selected genes. All related information can be downloaded as plain text files or image files.
Figure 1.

Users can study the relationships between motifs, TFs and genes in the following ways: For a query by motif consensus, MYBS will report the TFs whose binding consensus match well to it (upper left); the user may also obtain possible motif consensuses bound by specific TFs (upper right), or search for potential regulators of a gene (lower right). Sequence information can be visualized in detail (lower left). Note that there is a multiple-to-multiple relationship between TFs and motifs, as well as between motifs and genes.
In order to give the user an idea of the significance of the TF predicted to be enriched in a given group of target genes, we calculate an enrichment P-value for each TF in ‘Search regulatory association’. This is done by calculating the probability of finding x or more promoters in a user-input gene set that can be bound by the specified TF, in addition to fulfilling the ChIP-chip and conservation requirements set by the user:
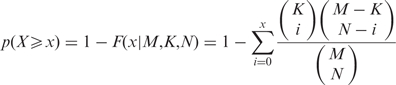 |
where M is the overall number of genes examined, K is the subset of M that are bound by the TF, N is the size of the user-input gene set, and x is the number of promoters within the user-input set that are bound by the TF.
Since the calculation is done for every single TF, the P-value calculation, which could be computationally intensive, is made optional by the user. If the button ‘Calculate enrichment P-value’ is clicked, an enrichment P-value will be shown for each TF in either the text or graphical output.
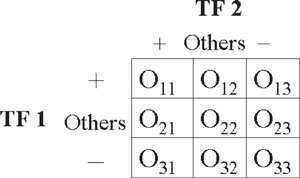
We also provide P-values for the ‘Find target genes for TF pairs’ function. For any given pair of TFs, we construct a 3 × 3 contingency table and perform the chi-square goodness of fit test.
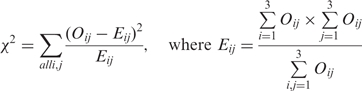 |
The χ2 statistic follows a chi-square distribution with four degrees of freedom (3 − 1) × (3 − 1). The P-value gives the user an idea of the probability of the two TFs being associated in a non-random manner. Note that we assign a default P-value of 1 if the expected number of genes E11 simultaneously bound by TF1 and TF2 exceeds the observed number of genes O11.
Since MYBS allows users to dynamically select different criteria for desired TFBSs, it is not easy to know the reliability of the MYBS predictions. To address this issue, for 101 experimentally verified TFBSs of 12 TFs (21) we analyzed their corresponding ChIP-chip P-values and the degree of conservation. Overall, 12 sites failed to be recognized by the PWMs of the corresponding TF in the MYBS database. Figure 2 shows the range of ChIP-chip P-values of these target genes and their degree of conservation across species. As shown, ∼65% of promoters where the experimentally verified TFBSs reside have ChIP-chip P-values < 0.01 and more than 70% experimentally verified TFBSs are conserved in at least three species.
Figure 2.

Distributions of ChIP-chip P-values and the degree of conservation for 101 experimentally verified TFBSs in S. cerevisiae. (A) Comparison of ChIP-chip P-values of 101 TFBSs that were identified and were not identified by MYBS. The ChIP-chip P-values are shown in logarithmic scales. (B) The distribution of these TFBSs conserved in other seven species. The y-axis represents the number of orthologous genes in other yeast species. Each bar represents an experimentally verified TFBS, where the black bar and the white bar represent the number of orthologous genes with and without the conserved TFBS, respectively.
A case study
MYBS enables users to visualize in parallel the potential regulators for a given set of genes, providing scientists with an efficient way to glance at potential underlying transcription mechanisms. Here we present an example of how this feature can be used toward potential regulatory association discovery. Burckin et al. (22) used splicing-sensitive microarrays to investigate the impact of perturbations on the steady-state levels of mRNAs and pre-mRNAs. Among these perturbations was one that used a conditional-lethal ded1 allele to inactivate Dep1p, a translation initiation factor (23) that is also known to be functionally involved in splicing (24). According to their results, a subset of intron-containing genes is sensitive to the loss of Dep1p. It is interesting to ask why Dep1p preferentially affects these intron-containing genes and whether these genes have anything in common in their promoter regions, since transcription and splicing are known to be coupled (25,26). To do this, we used the function ‘Search regulatory association’ to identify which TFs potentially regulate these genes. As shown in Figure 3, a contact map of the genes against all TFs is presented in the image format, and sorted according to the number of regulatory interactions. We found that 69 of the 111 Ded1p-sensitive intron-containing genes contain both FHL1 (Fork Head-Like) and RAP1 (Repressor Activator Protein) binding sites in their promoter regions (indicated by a red block). RAP1 encodes an essential protein involved in many processes in S. cerevisiae, including telomere maintenance, transcriptional silencing and high level transcriptional activation of genes encoding ribosomal proteins (RP) (27). FHL1 is a putative transcriptional regulator with similarity to the DNA-binding domain of Drosophila forkhead and is required for rRNA processing (28). Martin et al. (29) showed that FHL1 is also involved in the regulation of RP gene transcription in yeast. In contrast, only five of the 143 Ded1p-insensitive intron-containing genes harbor FHL1 or RAP1 binding sites in their promoter regions. These observations raise the possibility that Ded1p's influence on splicing can be exerted, either directly or indirectly, via promoter regions that contain both FHL1 and RAP1 binding sites.
Figure 3.

An example of a regulatory associations contact map. A regulatory association search using MYBS is performed on 111 intron-containing genes sensitive to Dep1p loss. The search provides a contact map of the genes against all TFs, and the map is sorted according to the number of regulatory interactions; in the map, a red block represents a regulatory relationship between a gene and a TF under user-defined criteria and a black block indicates the absence of regulatory relationship. According to the results, 69 of the 111 genes might be jointly regulated by FHL1 and RAP1.
DISCUSSION
MYBS is an interactive web-based service that integrates an array of predicted and known TFBS PWMs, DNA-binding affinity data from ChIP-chip and phylogenetic footprinting data of TFBSs in eight related yeast species. An important feature of MYBS is its versatility and flexibility in binding site annotation. In the process of binding site annotation, two filters can be customized according to the user's prior knowledge and confidence in the DNA-binding affinity data and phylogenic information, and MYBS reports the binding sites accordingly. Since the binding affinities and degree of conservation vary from TF to TF, the service provides an opportunity for scientists to incorporate one's knowledge and preference in the process of data retrieval. The motif information is also compiled and organized in a way that is easy to query from any directions—by partial motifs, by TF or by gene. As exemplified by the case study mentioned above, the regulatory associations feature could initiate and facilitate investigations by providing an intuitive look at the relationships between genes and TFs. Similarly, the identification of target genes for TF pairs could serve as a starting point for analysis of combinatorial regulation of TFs. Through the user-friendly interface, MYBS allows for dynamic binding site mapping, in addition to visualization and elucidation of potential regulatory relationships.
ACKNOWLEDGMENTS
This research was supported by the grants from the Institute of Information Science and the Genomics Research Center, Academia Sinica and the National Science Council, Taiwan. Funding to pay the Open Access Publication charges for this article was provided by NIH GM 30998.
Conflict of interest statement. None declared.
REFERENCES
- 1.Britten RJ, Davidson EH. Gene regulation for higher cells: a theory. Science. 1969;165:349–357. doi: 10.1126/science.165.3891.349. [DOI] [PubMed] [Google Scholar]
- 2.Stormo GD. DNA binding sites: representation and discovery. Bioinformatics. 2000;16:16–23. doi: 10.1093/bioinformatics/16.1.16. [DOI] [PubMed] [Google Scholar]
- 3.Zhu J, Zhang MQ. SCPD: a promoter database of the yeast Saccharomyces cerevisiae. Bioinformatics. 1999;15:607–611. doi: 10.1093/bioinformatics/15.7.607. [DOI] [PubMed] [Google Scholar]
- 4.Lee TI, Rinaldi NJ, Robert F, Odom DT, Bar-Joseph Z, Gerber GK, Hannett NM, Harbison CT, Thompson CM, et al. Transcriptional regulatory networks in Saccharomyces cerevisiae. Science. 2002;298:799–804. doi: 10.1126/science.1075090. [DOI] [PubMed] [Google Scholar]
- 5.Harbison CT, Gordon DB, Lee TI, Rinaldi NJ, Macisaac KD, Danford TW, Hannett NM, Tagne JB, Reynolds DB, et al. Transcriptional regulatory code of a eukaryotic genome. Nature. 2004;431:99–104. doi: 10.1038/nature02800. [DOI] [PMC free article] [PubMed] [Google Scholar]
- 6.Kellis M, Patterson N, Endrizzi M, Birren B, Lander ES. Sequencing and comparison of yeast species to identify genes and regulatory elements. Nature. 2003;423:241–254. doi: 10.1038/nature01644. [DOI] [PubMed] [Google Scholar]
- 7.Cliften P, Sudarsanam P, Desikan A, Fulton L, Fulton B, Majors J, Waterston R, Cohen BA, Johnston M. Finding functional features in Saccharomyces genomes by phylogenetic footprinting. Science. 2003;301:71–76. doi: 10.1126/science.1084337. [DOI] [PubMed] [Google Scholar]
- 8.Cherry JM, Adler C, Ball C, Chervitz SA, Dwight SS, Hester ET, Jia Y, Juvik G, Roe T, et al. SGD: Saccharomyces Genome Database. Nucleic Acids Res. 1998;26:73–79. doi: 10.1093/nar/26.1.73. [DOI] [PMC free article] [PubMed] [Google Scholar]
- 9.Wingender E, Chen X, Fricke E, Geffers R, Hehl R, Liebich I, Krull M, Matys V, Michael H, et al. The TRANSFAC system on gene expression regulation. Nucleic Acids Res. 2001;29:281–283. doi: 10.1093/nar/29.1.281. [DOI] [PMC free article] [PubMed] [Google Scholar]
- 10.Hodges PE, McKee AH, Davis BP, Payne WE, Garrels JI. The Yeast Proteome Database (YPD): a model for the organization and presentation of genome-wide functional data. Nucl. Acids Res. 1999;27:69–73. doi: 10.1093/nar/27.1.69. [DOI] [PMC free article] [PubMed] [Google Scholar]
- 11.Teixeira MC, Monteiro P, Jain P, Tenreiro S, Fernandes AR, Mira NP, Alenquer M, Freitas AT, Oliveira AL, et al. The YEASTRACT database: a tool for the analysis of transcription regulatory associations in Saccharomyces cerevisiae. Nucl. Acids Res. 2006;34:D446–D451. doi: 10.1093/nar/gkj013. [DOI] [PMC free article] [PubMed] [Google Scholar]
- 12.Pachkov M, Erb I, Molina N, van Nimwegen E. SwissRegulon: a database of genome-wide annotations of regulatory sites. Nucleic Acids Res. 2007;35:D127–D131. doi: 10.1093/nar/gkl857. [DOI] [PMC free article] [PubMed] [Google Scholar]
- 13.Siddharthan R, Siggia ED, van Nimwegen E. PhyloGibbs: a Gibbs sampling motif finder that incorporates phylogeny. PLoS Computational Biology. 2005;1:e67. doi: 10.1371/journal.pcbi.0010067. [DOI] [PMC free article] [PubMed] [Google Scholar]
- 14.Dujon B, Sherman D, Fischer G, Durrens P, Casaregola S, Lafontaine I, De Montigny J, Marck C, Neuveglise C, et al. Genome evolution in yeasts. Nature. 2004;430:35–44. doi: 10.1038/nature02579. [DOI] [PubMed] [Google Scholar]
- 15.van Helden J. Regulatory sequence analysis tools. Nucleic Acids Res. 2003;31:3593–3596. doi: 10.1093/nar/gkg567. [DOI] [PMC free article] [PubMed] [Google Scholar]
- 16.Thompson JD, Higgins DG, Gibson TJ. CLUSTAL W: improving the sensitivity of progressive multiple sequence alignment through sequence weighting, position-specific gap penalties and weight matrix choice. Nucleic Acids Res. 1994;22:4673–4680. doi: 10.1093/nar/22.22.4673. [DOI] [PMC free article] [PubMed] [Google Scholar]
- 17.Beer MA, Tavazoie S. Predicting gene expression from sequence. Cell. 2004;117:185–198. doi: 10.1016/s0092-8674(04)00304-6. [DOI] [PubMed] [Google Scholar]
- 18.MacIsaac K, Wang T, Gordon DB, Gifford D, Stormo G, Fraenkel E. An improved map of conserved regulatory sites for Saccharomyces cerevisiae. BMC Bioinformatics. 2006;7:113. doi: 10.1186/1471-2105-7-113. [DOI] [PMC free article] [PubMed] [Google Scholar]
- 19.Doniger SW, Huh J, Fay JC. Identification of functional transcription factor binding sites using closely related Saccharomyces species. Genome Res. 2005;15:701–709. doi: 10.1101/gr.3578205. [DOI] [PMC free article] [PubMed] [Google Scholar]
- 20.Hertz GZ, Stormo GD. Identifying DNA and protein patterns with statistically significant alignments of multiple sequences. Bioinformatics. 1999;15:563–577. doi: 10.1093/bioinformatics/15.7.563. [DOI] [PubMed] [Google Scholar]
- 21.Tsai HK, Huang GT, Chou MY, Lu HH, Li WH. Method for identifying transcription factor binding sites in yeast. Bioinformatics. 2006;22:1675–1681. doi: 10.1093/bioinformatics/btl160. [DOI] [PubMed] [Google Scholar]
- 22.Burckin T, Nagel R, Mandel-Gutfreund Y, Shiue L, Clark TA, Chong JL, Chang TH, Squazzo S, Hartzog G, et al. Exploring functional relationships between components of the gene expression machinery. Nat. Struct. Mol. Biol. 2005;12:175–182. doi: 10.1038/nsmb891. [DOI] [PubMed] [Google Scholar]
- 23.Chuang RY, Weaver PL, Liu Z, Chang TH. Requirement of the DEAD-Box protein ded1p for messenger RNA translation. Science. 1997;275:1468–1471. doi: 10.1126/science.275.5305.1468. [DOI] [PubMed] [Google Scholar]
- 24.Stevens SW, Ryan DE, Ge HY, Moore RE, Young MK, Lee TD, Abelson J. Composition and functional characterization of the yeast spliceosomal penta-snRNP. Mol. Cell. 2002;9:31–44. doi: 10.1016/s1097-2765(02)00436-7. [DOI] [PubMed] [Google Scholar]
- 25.Maniatis T, Reed R. An extensive network of coupling among gene expression machines. Nature. 2002;416:499–506. doi: 10.1038/416499a. [DOI] [PubMed] [Google Scholar]
- 26.Bentley DL. Rules of engagement: co-transcriptional recruitment of pre-mRNA processing factors. Curr. Opin. Cell. Biol. 2005;17:251–256. doi: 10.1016/j.ceb.2005.04.006. [DOI] [PubMed] [Google Scholar]
- 27.Lieb JD, Liu X, Botstein D, Brown PO. Promoter-specific binding of Rap1 revealed by genome-wide maps of protein-DNA association. Nat. Genet. 2001;28:327–334. doi: 10.1038/ng569. [DOI] [PubMed] [Google Scholar]
- 28.Hermann-Le Denmat S, Werner M, Sentenac A, Thuriaux P. Suppression of yeast RNA polymerase III mutations by FHL1, a gene coding for a fork head protein involved in rRNA processing. Mol. Cell. Biol. 1994;14:2905–2913. doi: 10.1128/mcb.14.5.2905. [DOI] [PMC free article] [PubMed] [Google Scholar]
- 29.Martin DE, Soulard A, Hall MN. TOR regulates ribosomal protein gene expression via PKA and the Forkhead transcription factor FHL1. Cell. 2004;119:969–979. doi: 10.1016/j.cell.2004.11.047. [DOI] [PubMed] [Google Scholar]