


Abstract
We present BLAST on Orthologous groups (BLASTO), a modified BLAST tool for searching orthologous group data. It treats each orthologous group as a unit and outputs a ranked list of orthologous groups instead of single sequences. By filtering out redundancy and putative paralogs, sequence comparisons to orthologous groups, instead of to single sequences in the database, can improve both functional prediction and phylogenetic inference. BLASTO computes the significance score of each orthologous group based on the individual BLAST hits in the orthologous group, using the number of taxa in the group as an optional weight. This allows users to control the species diversity of the orthologous groups. BLASTO incorporates the best-known multispecies ortholog databases, including NCBI Clusters of Orthologous Group, NCBI euKaryotic Orthologous Group database, OrthoMCL, MultiParanoid and TIGR Eukaryotic Gene Orthologues database, and offers a useful platform to integrate orthology information into functional inference and evolutionary studies of individual sequences. BLASTO is accessible online at http://oxytricha.princeton.edu/BlastO.
INTRODUCTION
With the accelerating discovery rate of new sequences from increasingly more diverse species and environmental sources, sequence searches and comparisons have become common practice to yield clues about a sequence's function and evolutionary relationships to others in the databases. Consistent information about orthology provides the basis for inferring phylogenetic relationships (1) and is more and more critical to sequence annotation in the absence of direct functional studies for every gene (2–6).
In the post-genomic era, many studies have classified sets of orthologous sequences among different species, and therefore many multispecies databases of orthologous groups are available: NCBI Clusters of Orthologous Groups (COG) database for unicellular organisms (2) contains putative orthologous groups among 66 genomes that include mostly prokaryotes and three eukaryotes. NCBI euKaryotic Orthologous Group database (KOG) (7) contains seven fully sequenced eukaryotic genomes. OrthoMCL DB (8) includes 55 genomes with more evenly distributed prokaryotic and eukaryotic species. MultiParanoid (9) contains four animals: human, fly, worm and sea squirt. TIGR Eukaryotic Gene Orthologues database (EGO) (10) is built on the consensus EST cluster sequences from 88 eukaryotic species.
However, most of the currently available tools for searching these ortholog databases either only permit searches by gene/group names, which limits the search to the sequences and species that are in the ortholog databases, or only allow conventional BLAST-based sequence comparison, which outputs results as individual sequences without taking advantage of the orthologous group information contained in the databases. Comparisons at the level of orthologous groups, on the other hand, can provide a list of significant similarities to orthologs, by filtering out paralogs and xenologs as well as other redundancy and random noise in the individual sequence hits. Such comparisons would yield more consistent conjectures regarding the function of the query sequence, since orthologous sequences are more likely to conserve protein function than paralogous and xenologous sequences (2–6,11). Although tools exist for protein molecular function prediction based on phylogenomic methods, such tools either require the whole proteome data, such as COG (2), or require knowledge of the phylogenetic position of the queried species on a reference tree to infer ortholog information independently from the available ortholog databases (5,6,11). These methods are not applicable to individual sequences recovered from unknown species, such as those from environmental samples, or from species whose phylogenetic positions are still ambiguous. Currently, only KOGnitor (http://www.ncbi.nlm.nih.gov/COG/grace/kognitor.html) incorporates orthologous group information into its search results and can be used on individual sequences without knowledge of the phylogenetic placement of the query species; however, KOGnitor only seaches NCBI KOG. As it is often a challenge in phylogenetic reconstruction to identify the orthologous sequences and to avoid other types of homologs, sequence comparison at the level of orthologous groups can also facilitate accurate phylogenetic reconstruction by using the well-established orthology relations in the ortholog databases.
We created a BLAST on Orthologous groups (BLASTO) web server, a modified BLAST tool designed to search orthologous group data. It compares individual sequences to the sequences in various ortholog databases and, without knowledge of the query species or sequence, allows the user to identify a group of sequences that are putatively orthologous to the query sequence.
A regular BLAST search produces a list of single sequences ranked by the statistical significance of their similarity to the query sequence. BLASTO, however, uses the information in the corresponding ortholog databases to group orthologous sequences together as a unit, computes a single significance score for each orthologous group based on the individual BLAST hits within the group, and outputs a ranked list of orthologous groups, as well as single sequences from the database that are not part of any orthologous group. The significance scores for each orthologous group can be further weighted in a user-defined fashion by the number of taxa in each orthologous group. To facilitate functional inference of the query sequence, BLASTO lists the annotation of orthologous groups and individual genes, when such information is available. The server also incorporates ClustalW (12) to allow one to infer the putative evolutionary relationships among the orthologous group sequences and the query sequence via multiple sequence alignment and distance tree construction.
By incorporating the best-known multispecies ortholog databases, including NCBI COG (2), NCBI KOG (7), TIGR EGO (10), OrthoMCL DB (8) and MultiParanoid (9), BLASTO also serves as a hub for all these ortholog databases. Users can select any of these databases for their query.
RATIONALE AND METHODS
Currently, for sequences from unknown species or those that lack a completely sequenced genome, orthology prediction depends mainly on one-way best hits to completed genomes with precomputed information about orthology. However, best hits to different completed genomes can be inconsistent with each other, especially when the evolutionary distance is large. This could be due to the increase in variance in measurable molecular evolutionary distance over time, gene fusion events in the query species, or ancient duplications in the genomes used for comparison (which make the query sequence orthologous to more than one orthologous group in the database, as a result of duplications that preceded speciation events). Indeed, when we compare 9934 randomly selected sequences from Tetrahymena thermophilia to the seven completed genomes in NCBI KOG database, more than half (5261) of the Tetrahymena sequences have single best hits in different species that yield inconsistent orthologous group assignments. BLASTO reports the best-scored orthologous group, instead of individual sequences. By averaging the significant scores for single sequences in the orthologous groups (see below for details), BLASTO reduces the noise in the inferred genetic distances (assuming independent evolution after species’ divergence). Among the 9934 randomly selected Tetrahymena sequences, 1232 have as their single best hit an individual sequence in a different orthologous group than the BLASTO top-ranked orthologous group. By reporting all orthologous groups with comparable scores, BLASTO can also help reveal ancestral duplications or gene fusion events. Representing a highly divergent lineage, about 30% of the tested Tetrahymena sequences have scores for their two top-ranked NCBI KOG orthologous groups that differ by less than 10%, reflecting either gene fusion events in Tetrahymena (whether authentic evolutionary events or artifacts of annotation) or ancient duplication events in the genomes in the NCBI KOG database. Like any computational algorithm for orthology prediction, the results from BLASTO need experimental confirmation, but we expect BLASTO to become a general tool for inferring information about orthology, particularly for sequences of unknown species origin or from partially sequenced genomes.
Similar to regular BLAST, for each query sequence, BLASTO begins by performing a BLAST search against all the sequences in the selected ortholog database (Figure 1A). At this point, a regular BLAST search would output a list of single sequences ranked by their statistical significance. BLASTO, however, uses the information in the corresponding ortholog databases to group orthologous sequences together as a unit (Figure 1B), and then computes a single significance score for each orthologous group, based on the individual BLAST hits within the group (Figure 1C) as follows:
Figure 1.

A graphical representation of how BLASTO works. The red circle represents the query sequence. Other circles of different colors represent individual sequences from different genomes. The oval circles represent orthologous groups, so that the individual sequences in the same oval circle belong to the same orthologous group. Thin lines between circles are indications of BLAST significance scores between query and individual sequences. Thick lines represent significance scores between query and orthologous groups.
The score of each orthologous group (Sg) is computed as the average negative log-likelihood of the BLAST hits among all the sequences in the orthologous group.
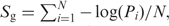 where N is the number of sequences in the orthologous group. Pi = 1 − exp(−Ei), where Ei is the E-value of the BLAST hit (13). Pi = 1 for sequences without a significant BLAST hit.
The orthologous group scores computed via the description above tend to bias against orthologous groups with wider taxonomic span (therefore more diverged orthologous sequences), but the user may prefer orthologous groups with different levels of species diversity. Orthologous groups with wider taxonomic span are likely to be more ancient and universal, while orthologous groups with more narrow taxonomic span are likely to be more recent or confined to a subgroup of a species or a lineage. To provide users the ability to control for their preference for orthologous groups with different taxonomic spans, the orthologous group scores should ideally be further weighted by the degree of species diversity in the group measured on a consensus species tree. Unfortunately, there is currently no such stable consensus tree available (14–18) nor do trees based on ribosomal RNA sequences necessarily correlate well with the species tree (19). Alternatively, we have considered measuring the species diversity represented in each orthologous group by the number of steps to reach a last common ancestor in the NCBI taxonomy database, but this method will bias in favor of clades that contain many closely related species, sub-species or strains (20). Therefore, as an approximation, we currently weight the orthologous group scores by the number of taxa in the group (Tg) divided by the total number of species included in the ortholog database (T). The weighted score is:
 when the weight (W) is a real number.
When W is +∞, the orthologous groups are ranked by their number of taxa in a descending manner; when the W is −∞, the orthologous groups are ranked by their number of taxa in an ascending manner.
The orthologous groups are then ranked by their weighted group score and reported to the user as a list, together with the significant individual hits within each group (a query sequence need not have a significant hit to every sequence in a group). The significant BLAST hits among individual sequences that are not part of any orthologous groups are also ranked by their score and displayed as a separate list. In the future, we plan to offer users different optional weights, including taxa number, the spanning distance on a tree constructed with ribosomal RNA sequences, or a user-defined species tree.
BLASTO SERVER
BLASTO is built upon a MySQL relational database and a BLAST search engine on a Unix server. The orthologous group data and annotations were downloaded from the corresponding websites, imported into the MySQL database and will be updated every 6 months. The current server includes data from NCBI COG (March, 2003 version), NCBI KOG (March, 2003 version), OrthoMCL DB (version 1.0, January, 2006), MultiParanoid (July, 2006 version) and TIGR EGO (release 13, January, 2007). The sequence names in BLASTO are directly inherited from the corresponding orthologous group databases, and their original sources are listed at http://oxytricha.princeton.edu/BlastO/data_source.html. Descriptions of individual sequences are gathered from either the orthologous group database or external database resources such as NCBI, Ensembl and the TIGR gene index project.
The BLASTO interface is very similar to the standard BLAST input interface that users are familiar with. It allows the user to submit either a DNA or a protein sequence with many of the common BLAST parameter choices, such as filtering, genetic codes, substitution matrices and frame-shift penalties. The user can select any of the following orthologous group databases for their query: NCBI COG, NCBI KOG, OrthoMCL DB, MultiParanoid and TIGR EGO. The user can also select different values for the BLASTO-specific parameter, ‘weight by group taxa number,’ to control the preference for orthologous groups containing different levels of species diversity. In general, higher (positive) weight favors orthologous groups that contain more taxa; these groups tend to have greater levels of species diversity. Lower (negative) weight favors orthologous groups with fewer taxa; these groups tend to have less species diversity.
The BLASTO output is composed of three parts (Figure 2A). The first part is a list of orthologous groups containing sequences with significant BLAST hits to the query sequence. The groups are sorted by the weighted group score, and the individual sequences in each group are sorted by their BLAST score. The second part is a separate list of individual sequences that are not part of any orthologous group, sorted by their BLAST score. The third part, as many other BLAST family programs, displays the alignments of the query sequence with individual sequences. The description of the orthologous groups and individual sequences are listed when available. External links are provided for the orthologous groups to their original ortholog databases and for the individual sequence entries to their associated database resources.
Figure 2.

A snapshot of the BLASTO output pages with a query sequence from the Sorcerer II global ocean sampling expedition (21): (A) the BLASTO search output page, (B) a dynamic summary page of the orthologous group and (C) ClustalW results.
Users can retrieve a dynamic summary of any of the listed orthologous groups by clicking on the orthologous group names (Figure 2B). The orthologous group summary page lists all the information on the orthologous group and the included sequences, and indicates whether each specific sequence shares significant BLAST hits with the query sequence. Although individual sequences can be retrieved by clicking on their names at any time, one can choose to retrieve all sequences or only those with significant BLAST hits from the orthologous group in batches from the orthologous group summary page, making it convenient for the users to perform further local analyses among the sequences. The user can also choose to run ClustalW (12) on the query sequence and sequences (all or those with BLAST hits) from the orthologous group on our server when the total number of sequences is smaller than 50. The ClustalW result page (Figure 2C) displays the multiple sequence alignment and an un-rooted Neighbor-joining distance tree from which putative phylogenetic relationships between the query and the orthologous group sequences can be inferred. When the total number of sequences is greater than 50, the users are advised to batch download the sequences and perform the analysis locally.
We evaluated the performance of the BLASTO server using a list of 2000 sequences randomly chosen from the orthologous group databases: We first masked all the sequences from the same species as the test sequence in the corresponding ortholog database, which effectively decreased the number of species in the ortholog database by one. We then ran BLASTO on the masked database and compared the highest-ranked orthologous group in the BLASTO result with the original orthologous group assignment of the test sequence. Assuming the original orthologous group assignments in the orthologous group databases reflect the correct orthology relations, the results show that BLASTO can infer the correct orthology information in 85% of the cases.
SUMMARY
The BLASTO integrates orthology information into BLAST searches, and reports orthologous groups that share significant similarity with the query sequence. Built upon existing and well-received orthologous group databases that use only completed genomes, this ensures maximum accuracy of orthology predictions. BLASTO is designed for individual sequence searches, requires no local computational effort from the user, and provides a simple platform to use orthologous group information to infer the possible function of a query sequence and its putative phylogenetic relationships to other sequences in the databases. With the discovery of more and more novel sequences, we expect this web server to become a valuable search engine and an integrated ortholog data hub for the molecular evolution and comparative genomics community.
ACKNOWLEDGEMENTS
The authors thank Axel Haenssen for technical assistance; Dr Jun Li and Dr Han Liang for useful comments; Dr Tom Doak, Estienne Swart and the rest of the Landweber lab members for helpful discussion and testing. This work is supported by National Institute of General Medical Sciences Grant GM59708 and National Science Foundation Grant 0622112. Funding to pay the Open Access publication charges for this article was provided by National Science Foundation.
Conflict of interest statement. None declared.
REFERENCES
- 1.Fitch WM. Uses for evolutionary trees. Philos. Trans. R. Soc. Lond. B. 1995;349:93–102. doi: 10.1098/rstb.1995.0095. [DOI] [PubMed] [Google Scholar]
- 2.Tatusov RL, Koonin EV, Lipman DJ. A genomic perspective on protein families. Science. 1997;278:631–637. doi: 10.1126/science.278.5338.631. [DOI] [PubMed] [Google Scholar]
- 3.Bork P, Koonin EV. Predicting functions from protein sequences—where are the bottlenecks? Nat. Genet. 1998;18:313–318. doi: 10.1038/ng0498-313. [DOI] [PubMed] [Google Scholar]
- 4.Eisen JA. Phylogenomics: Improving functional predictions for uncharacterized genes by evolutionary analysis. Genome Res. 1998;8:163–167. doi: 10.1101/gr.8.3.163. [DOI] [PubMed] [Google Scholar]
- 5.Zmasek CM, Eddy SR. RIO: analyzing proteomes by automated phylogenomics using resampled inference of orthlogs. BMC Bioinformatics. 2002;3:14–32. doi: 10.1186/1471-2105-3-14. [DOI] [PMC free article] [PubMed] [Google Scholar]
- 6.Engelhardt BE, Jordan MI, Muratore KE, Brenner SE. Protein molecular function prediction by Bayesian phylogenomics. PLos Comp. Biol. 2005;1:432–445. doi: 10.1371/journal.pcbi.0010045. [DOI] [PMC free article] [PubMed] [Google Scholar]
- 7.Tatusov RL, Fedorova ND, Jackson JD, Jacobs AR, Kiryutin B, Koonin EV, Krylov DM, Mazumder R, Mekhedov SL, et al. The COG database: an updated version includes eukaryotes. BMC Bioinformatics. 2003;4:41. doi: 10.1186/1471-2105-4-41. [DOI] [PMC free article] [PubMed] [Google Scholar]
- 8.Chen F, Machey AJ, Stoeckert CJ, Jr, Roos DS. OrthoMCL_DB: querying a comprehensive multi-species collection of ortholog groups. Nucleic Acids Res. 2006;34:D363–D368. doi: 10.1093/nar/gkj123. [DOI] [PMC free article] [PubMed] [Google Scholar]
- 9.Alexeyenko A, Tamas I, Liu G, Sonnhammer EL. Automatics clustering of orthologs and inparalogs shared by multiple proteomes. Bioinformatics. 2006;22:e9–25. doi: 10.1093/bioinformatics/btl213. [DOI] [PubMed] [Google Scholar]
- 10.Lee Y, Sultana R, Pertea G, Cho J, Karamycheva S, Tsai J, Parvizi B, Cheung F, Antonescu V, et al. Cross-referencing eukaryotic genomes: TIGR Orthologous Gene Alignments (TOGA) Genome Res. 2002;12:493–502. doi: 10.1101/gr.212002. [DOI] [PMC free article] [PubMed] [Google Scholar]
- 11.Storm CEV, Sonnhammer ELL. Automated ortholog inference from phylogenetic trees and calculation of orthology reliability. Bioinformatics. 2002;18:92–99. doi: 10.1093/bioinformatics/18.1.92. [DOI] [PubMed] [Google Scholar]
- 12.Chenna R, Sugawara H, Koike T, Lopez R, Gibson TJ, Higgins DG, Thompson JD. Multiple sequence alignment with the Clustal series of programs. Nucleic Acids Res. 2003;31:3497–3500. doi: 10.1093/nar/gkg500. [DOI] [PMC free article] [PubMed] [Google Scholar]
- 13.Karlin S, Altschul SF. Methods for assessing the statistical significance of molecular sequence features by using general scoring schemes. Proc. Natl Acad. Sci. USA. 1990;87:2264–2268. doi: 10.1073/pnas.87.6.2264. [DOI] [PMC free article] [PubMed] [Google Scholar]
- 14.Baldauf SL. The deep roots of eukaryotes. Science. 2003;300:1703–1706. doi: 10.1126/science.1085544. [DOI] [PubMed] [Google Scholar]
- 15.Berney C, Fahrni J, Pawlowski J. How many novel eukaryotic ‘kingdoms’? Pitfalls and limitations of environmental DNA surveys. BMC Biology. 2004;2:13. doi: 10.1186/1741-7007-2-13. [DOI] [PMC free article] [PubMed] [Google Scholar]
- 16.Keeling PJ, Burger G, Durnford DG, Lang BF, Lee RW, Pearlman RE, Roger AJ, Gray MW. The tree of eukaryotes. Trends Ecol. Evol. 2005;20:670–676. doi: 10.1016/j.tree.2005.09.005. [DOI] [PubMed] [Google Scholar]
- 17.Roger AJ, Hug LA. The origin and diversification of eukaryotes: problems with molecular phylogenetics and molecular clock estimation. Philos. Trans. R. Soc. Lond. B Biol. Sci. 2006;361:1039–1054. doi: 10.1098/rstb.2006.1845. [DOI] [PMC free article] [PubMed] [Google Scholar]
- 18.Cavalier-Smith T. Rooting the tree of life by transition analyses. Biol. Direct. 2006;1:19. doi: 10.1186/1745-6150-1-19. [DOI] [PMC free article] [PubMed] [Google Scholar]
- 19.Baldauf SL, Roger AJ, Wenk-Siefert I, Doolittle WF. A kingdom-level phylogeny of eukaryotes based on combined protein data. Science. 2000;290:972–977. doi: 10.1126/science.290.5493.972. [DOI] [PubMed] [Google Scholar]
- 20.Wheeler DL, Chappey C, Lash AE, Leipe DD, Madden TL, Schuler GD, Tatusova TA, Rapp BA. Database resources of the national center for biotechnology information. Nucleic Acids Res. 2000;28:10–14. doi: 10.1093/nar/28.1.10. [DOI] [PMC free article] [PubMed] [Google Scholar]
- 21.Yooseph S, Sutton G, Rusch DB, Halpern AL, Williamson SJ, Remington K, Eisen JA, Heidelberg KB, Manning G, et al. The Sorcerer II global ocean sampling expedition: expanding the universe of protein families. PLoS Biol. 2007;5:e16. doi: 10.1371/journal.pbio.0050016. [DOI] [PMC free article] [PubMed] [Google Scholar]