


Abstract
The number of complete and draft genomes is rapidly growing in recent years, and it has become increasingly important to automate the identification of functional properties and biological roles of genes in these genomes. In the KEGG database, genes in complete genomes are annotated with the KEGG orthology (KO) identifiers, or the K numbers, based on the best hit information using Smith–Waterman scores as well as by the manual curation. Each K number represents an ortholog group of genes, and it is directly linked to an object in the KEGG pathway map or the BRITE functional hierarchy. Here, we have developed a web-based server called KAAS (KEGG Automatic Annotation Server: http://www.genome.jp/kegg/kaas/) i.e. an implementation of a rapid method to automatically assign K numbers to genes in the genome, enabling reconstruction of KEGG pathways and BRITE hierarchies. The method is based on sequence similarities, bi-directional best hit information and some heuristics, and has achieved a high degree of accuracy when compared with the manually curated KEGG GENES database.
INTRODUCTION
In order to keep up with the rapid growth of sequence data for complete and draft genomes, more efficient and accurate computational methods are required for functional annotation of these genomes. The basis for functional annotation is application of sequence similarity with well-annotated sequences. This is accomplished by the sequence comparison methods such as the Smith–Waterman algorithm (1), FASTA (2) and BLAST (3,4). However, it is not always true that all similar sequences have a conserved function. In previous works, the relationship between the functional conservation and the sequence similarity score was studied, and it was suggested for enzymes that from 40 to 70% sequence identity is necessary for functional prediction with 90% accuracy (5,6). The availability of many sequenced genomes has made the utilization of best hit information possible, in addition to individual sequence similarity scores. Orthologous genes are functionally conserved genes in different species, branched from a common ancestor by speciation. In practice, they are computationally deduced from the bi-directional best hit (BBH) relationship in pairwise genome comparison (7,8). Therefore, the identification of orthologous genes among many species is the shortest way to predict functions of newly sequenced genomes.
The accuracy of annotation largely depends on the quality of the database to be searched. The Gene Ontology (GO) has been developed for consistent descriptions of gene products in different species (9). The GO terms in the three ontologies, biological process, cellular component and molecular function, are now used in many genome databases. However, the GO annotations for different species may not be easy to integrate because they exist in different databases.
In contrast, the KEGG GENES database provides a single resource for cross-species annotation of all available genomes by a standardized mechanism, called the KEGG Orthology (KO) system. The essence of the KO system is that it is a pathway based definition of orthologous genes. The KO entry represents an ortholog group that is linked to a box (gene product) in the KEGG pathway diagram. Thus, once the KO identifiers, or the K numbers, are assigned to genes in the genome, which is manually verified in KEGG, organism-specific pathways can be computationally generated. The KO system has since been expanded to include the BRITE functional hierarchies, such as hierarchical classifications of protein families. A set of K numbers in the genome can be mapped, i.e. to specific classes of receptors, which may then be linked to specific classes of ligands in the chemical category of the BRITE database (see Figure 1). In essence, the KEGG database provides a reference knowledge base for linking genomes to the biological systems, and now to the environments as well (10). Here, we report a web-based server called KAAS (KEGG Automatic Annotation Server) to automate the processes of the K number assignment and the subsequent pathway mapping and BRITE mapping.
Figure 1.

An example of the genome annotation with the KO identifiers or the K numbers by the KAAS service, which is integrated into the KEGG resource. Once the KAAS assigns K numbers to query genes, the mapping to KEGG pathways and BRITE hierchies is generated using the existing framework of the KEGG system.
METHODS
Overall procedure
Figure 2 shows a flow chart of KAAS. First, the BLAST scores between a query sequence and the reference sequence set (taken from the KEGG GENES database) are computed, and homologs are found in the reference set. Next, homologs ranked above the threshold are selected as ortholog candidates based on the BLAST score and the bi-directional hit rate (BHR) defined below. Ortholog candidates are divided into KO groups according to the annotation of the KEGG GENES database. Finally, the assignment score is calculated based on the likelihood and heuristics for each KO group. Then, the K number of the KO group with the highest score is assigned to the query sequence.
Figure 2.

The overall procedure of KAAS.
Bi-directional hit rate
Given a genome to be annotated, it is compared against each genome in the reference set of the KEGG GENES database by BLAST searches in both forward and reverse directions, taking each gene in genome A as a query compared against all genes in genome B, and vice versa. Those BLAST hits with bit scores less than 60 are removed. Because the bit scores of a gene pair a and b from two genomes A and B, respectively, can be different in forward and reverse directions, and because the top scores do not necessarily reflect the order of the rigorous Smith–Waterman scores, we define the BHR as:
Here, R = S′/Sb where S′ is the bit score of a against b, and Sb is the score of a against the best-hit gene in genome B (which may not necessarily be b). Rf refers to the score from the forward BLAST (A against B), and Rr refers to the score from the reverse BLAST (B against A). We select those genes whose BHR is greater than 0.95.
Assignment score
We define a score for each ortholog group in order to assign the best fitting K numbers to the query gene:
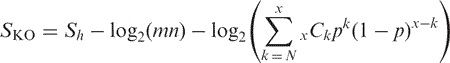 |
where Sh is the highest score among all ortholog candidates in the ortholog group, m and n are the sequence lengths of the query and the target of BLAST, respectively, N is the number of ortholog group members, x is the number of organisms in the original ortholog group from which this group is derived, and p is the ratio of the size of the original ortholog group versus the size of the entire GENES database. The second term is for the normalization of the first term by sequence lengths, and the third term is a weighting factor to consider the number of ortholog candidates that are found in the original.
USAGE
Query format
On this server, the user can input the FASTA formatted ORFs or ESTs. The expected query data is amino acid sequences representing a set of protein-coding genes in a complete genome to annotate with high accuracy. In that case, KO assignments are based on the results of BLASTP. Check the ‘Nucleotide’ checkbox if queries are nucleotide sequences representing a set of EST contigs or ESTs. In this case, KO assignments are based on the results of BLASTX and TBLASTN.
Reference data selection
The user can choose the reference data set from the latest KEGG GENES entries. As of the end of December 2006, it contains 469 organisms (36 eukaryotes, 402 bacteria and 31 archaea) with KO annotation. The computation time is proportional to the size of the data set. The accuracy will be improved if closely related species of the query are contained in the data set. A representative set is set out on the server as the default. It is a pre-selected data set of species from each taxonomic group in KEGG GENES to reduce the computation time without drastic lowering of accuracy. The representative set for eukaryotes includes 15 eukaryotes and 11 prokaryotes, which is roughly one-seventh of the whole set, and the representative set for prokaryotes includes 5 eukaryotes and 23 prokaryotes, approximately one-tenth of whole set.
Method selection
The KAAS is implemented using two methods: the bi-directional best hit (BBH) information method, and the single-directional best hit information method (SBH method). A complete set of genes in a genome is preferable as the query because the KAAS works best with BBH method. On the other hand, the SBH method can also be used for a limited number of ORFs or ESTs. The computation time of the BBH method is about twice that of SBH.
Output
The KAAS provides three views of the analyzed data. ‘KO list’ is the flat list of query genes with the K numbers given by the KAAS. ‘KO hierarchy’ is the hierarchical list of annotated genes, which is categorized according to the BRITE database. ‘Pathway map’ is the list of pathways with links to graphical pathway maps. The annotated query genes are highlighted in the maps. Each box in the map is linked to functional information in the KO database. The user can re-compute the KO annotation with a different BLAST threshold from ‘threshold change’ option. ‘Download’ is an option to download the text file of KO annotation and reconstructed graphical pathway maps.
Computation time
In the case of a prokaryotic genome that contains about 4000 amino acid sequences, the computation of KAAS with the reference data set for prokaryotes takes ∼1 h.
RESULT AND DISCUSSION
To test the accuracy, we reassigned K numbers to selected organisms in the manually curated KEGG GENES database. We show the results of Homo sapiens, Arabidopsis thaliana, Saccharomyces cerevisiae and Escherichia coli, where 25.2, 11.6, 32.1 and 63.3% of the genes, respectively, are currently annotated with K numbers. Tables 1 and 2 list the sensitivity, specificity, positive predictive value (PPV), and precision of selected organisms with BBH method. The whole set of KEGG GENES and representative set excluding the query genome itself were respectively referred to for Tables 1 and 2.
Table 1.
Accuracy of K number assignment by KAAS with the BBH method and the whole set of KEGG GENES
| Species | H. sapiens | A. thaliana | S. cerevisiae | E. coli |
|---|---|---|---|---|
| Sensitivity | 83.7% | 70.4% | 85.2% | 97.4% |
| Specificity | 98.6% | 91.5% | 94.1% | 94.3% |
| PPV | 93.6% | 47.9% | 80.7% | 94.9% |
| Precision | 98.0% | 85.5% | 91.6% | 98.5% |
Sensitivity is the rate of the true positives to all genes with KO annotations. Specificity is the rate of the true negatives to all genes without KO annotations. PPV is the rate of true positives to all positives for all genes in each organism. Precision means the rate of correctly annotated genes if the test set is limited to the genes with KO annotations.
Table 2.
Accuracy of K number assignment KAAS with the BBH method and the representative set
| Species | H. sapiens | A. thaliana | S. cerevisiae | E. coli |
|---|---|---|---|---|
| Sensitivity | 85.4% | 62.5% | 86.8% | 90.1% |
| Specificity | 98.9% | 91.3% | 96.8% | 94.9% |
| PPV | 94.4% | 44.3% | 87.7% | 93.2% |
| Precision | 97.9% | 83.8% | 94.9% | 96.6% |
As a result of annotation with the whole set of GENES, the PPV of human gene reassignment was more than 90%. When the test set was limited to the genes with KO annotations, 98% of genes in human were correctly annotated. For E. coli, the accuracy of the reassignment is higher than that of human, because the KEGG GENES database contains many closely related organisms of E. coli. The PPV of Arabidopsis is ∼50%, because there are no plants in the KEGG GENES database and many genes of Arabidopsis are left unannotated. Because the KO is not developed based on only the sequence similarity, there is the case that some KOs contain similar members. In that situation, the KAAS may not assign appropriate KOs to genes.
In the case of using the representative set, the genes were annotated without a drastic lowering of accuracy compared with the whole set. The computation time for E. coli takes about one-tenth of the whole set and selected eukaryotes take about one-seventh. For human and yeast, the accuracy of annotation was equal to or slightly better than that with the whole set of KEGG GENES. For Arabidopsis, the accuracy of annotation went down because the number of related organisms contained in the reference data was reduced. The sensitivity for E. coli went down because the representative set for prokaryotes excludes closely related organisms. The KAAS is useful as a rapid and high performance tool for forthcoming genome annotation because many taxa referred to as closely related organisms are now contained in the KEGG GENES database. For plants the accuracy of assignment will improve, as more plant genome projects are being processed.
ACKNOWLEDGEMENTS
This work was supported by grants from the Ministry of Education, Culture, Sports, Science and Technology, and the Japan Science and Technology Agency. Computational resources were provided by the Bioinformatics Center, Institute for Chemical Research, Kyoto University. Funding to pay the Open Access publication charges for the article was provided by the grant-in-aid for scientific research from the Ministry of Education.
Conflict of interest statment. None declared.
REFERENCES
- 1.Smith T, Waterman M. Identification of common molecular subsequences. J. Mol. Biol. 1981;147:195–197. doi: 10.1016/0022-2836(81)90087-5. [DOI] [PubMed] [Google Scholar]
- 2.Lipman D, Pearson W. Rapid and sensitive protein similarity searches. Science. 1985;227:1435–1441. doi: 10.1126/science.2983426. [DOI] [PubMed] [Google Scholar]
- 3.Altschul S, Gish W, Miller W, Myers E, Lipman D. Basic local alignment search tool. J. Mol. Biol. 1990;215:403–410. doi: 10.1016/S0022-2836(05)80360-2. [DOI] [PubMed] [Google Scholar]
- 4.Altschul SF, Madden TL, Schaffer AA, Zhang J, Zhang Z, Miller W, Lipman DJ. Gapped BLAST and PSI-BLAST: a new generation of protein database search programs. Nucleic Acids Res. 1997;25:3389–3402. doi: 10.1093/nar/25.17.3389. [DOI] [PMC free article] [PubMed] [Google Scholar]
- 5.Rost B. Enzyme Function Less Conserved than Anticipated. J. Mol. Biol. 2002;318:595–608. doi: 10.1016/S0022-2836(02)00016-5. [DOI] [PubMed] [Google Scholar]
- 6.Tian W, Skolnick J. How well is enzyme function and conserved as a function of pairwise sequence identity? J. Mol. Biol. 2003;333:863–882. doi: 10.1016/j.jmb.2003.08.057. [DOI] [PubMed] [Google Scholar]
- 7.Tatusov R, Koonin E, Limpan D. A genomic perspective on protein families. Science. 1997;278:631–637. doi: 10.1126/science.278.5338.631. [DOI] [PubMed] [Google Scholar]
- 8.Tatusov R, Natale D, Garkavtsev I, Tatusova T, Shankavaram U, Rao B, Kiryutin B, Galperin M, Fedorova N, et al. The COG database: new developments in phylogenetic classification of proteins from complete genomes. Nucleic Acids Res. 2001;29:22–28. doi: 10.1093/nar/29.1.22. [DOI] [PMC free article] [PubMed] [Google Scholar]
- 9.Ashburner M, Ball CA, Blake JA, Botstein D, Butler H, Cherry JM, Davis AP, Dolinski K, Dwight SS, et al. Gene ontology: tool for the unification of biology. The Gene Ontology Consortium. Nat. Genet. 2000;25:25–29. doi: 10.1038/75556. [DOI] [PMC free article] [PubMed] [Google Scholar]
- 10.Kanehisa M, Goto S, Hattori M, Aoki-Kinoshita KF, Itoh M, Kawashima S, Katayama T, Araki M, Hirakawa M. From genomics to chemical genomics: new developments in KEGG. Nucleic Acids Res. 2006;34:D354–D357. doi: 10.1093/nar/gkj102. [DOI] [PMC free article] [PubMed] [Google Scholar]