


Abstract
In the yeast, meiotic recombination is initiated by double-strand DNA breaks (DSBs) which occur at relatively high frequencies in some genomic regions (hotspots) and relatively low frequencies in others (coldspots). Although observations concerning individual hot/cold spots have given clues as to the mechanism of recombination initiation, the prediction of hot/cold spots from DNA sequence information is a challenging task. In this article, we introduce a random forest (RF) prediction model to detect recombination hot/cold spots from yeast genome. The out-of-bag (OOB) estimation of the model indicated that the RF classifier achieved high prediction performance with 82.05% total accuracy and 0.638 Mattew's correlation coefficient (MCC) value. Compared with an alternative machine-learning algorithm, support vector machine (SVM), the RF method outperforms it in both sensitivity and specificity. The prediction model is implemented as a web server (RF-DYMHC) and it is freely available at http://www.bioinf.seu.edu.cn/Recombination/rf_dymhc.htm. Given a yeast genome and prediction parameters (RI-value and non-overlapping window scan size), the program reports the predicted hot/cold spots and marks them in color.
INTRODUCTION
In the yeast, meiotic recombination is initiated by double-strand DNA breaks (DSBs). Meiotic DSBs occur at relatively high frequencies in some genomic regions which are called hotspots while the regions associated with low frequencies of DSBs are called coldspots (1). Several studies have been performed to determine whether the hot/cold spots share common DNA sequences and/or structural elements (2,3). It was found that the hotspots were non-randomly associated with regions of high G + C base composition and certain transcriptional profiles while the coldspots were non-randomly associated with centromeres and telomeres.
Although observations concerning individual hot/cold spots have given clues as to the mechanism of recombination initiation, the prediction of hot/cold spots from DNA sequence information is still a challenging task. So far, nearly all recombination hot/cold spots finding methods are based on population-genetic data (4–6) and no software or web server has been reported to predict the hot/cold spots from a single DNA sequence.
In this study, we present a novel machine-learning method, random forest (RF) model, to detect the yeast meiotic recombination hotspots and coldspots from genome sequences. Although several studies demonstrated that there was a correlation between the synonymous codon usage pattern and the recombination rate in Caenorhabditis elegans, mouse, human and other species(7–13), most hotspots are intergenic rather than intragenic, and thus the gene codon usage pattern-based attributes may fail to be applied in non-coding regions. For that reason, an ORF (Open Reading Frame)-independent feature (gapped dinucleotide composition) was used in our study. Compared with an alternative machine-learning algorithm, support vector machine (SVM), the RF method outperformed it in both sensitivity and specificity. The prediction model is implemented as a web server (RF-DYMHC) and it is freely available at http://www.bioinf.seu.edu.cn/Recombination/rf_dymhc.htm. Given a yeast DNA sequence and prediction parameters (RI-value and non-overlapping scan window size), the program reports the predicted hot/cold spots and marks them in color.
MATERIALS AND METHODS
Data sets
Gerton et al. (14) have estimated the relative recombination rates for the yeast Saccharomyces cerevisiae loci using DNA microarray at single-gene resolution. To estimate the DSBs formation adjacent to each ORF, they measured the ratio of hybridization to a DSB-enriched probe (P2) to a total genomic probe (P1). The relative strength of the recombination rate was estimated by the P2/P1 hybridization ratio. The experiments were repeated seven times for each of the 6200 genes. In this article, we take the median value as the relative recombination rate of each sequence. If any repeated array value was missing, the sequence was excluded. Finally, a total of 5266 sequences were collected. The sequences whose relative hybridization ratio ≥1.5 are defined as hotspots, while the ones whose relative hybridization ratio <0.82 are defined as coldspots. Thus, we obtained 490 hotspots and 591 coldspots which composed of the training data set.
The yeast S. cerevisiae mitochondrial DNA sequence, served as negative control for our method, was downloaded from Saccharomyces Genome Database (15) at the website: http://www.yeastgenome.org/. All the data sets used in this article can be downloaded from website: http://www.bioinf.seu.edu.cn/Recombination/datasets.htm
Gapped dinucleotide composition features
The gapped dinucleotide composition is the fraction of each two nucleotides with k intervening bases within a sequence. It can be defined as:
 |
1 |
where,  is the observed total number of i-th two nucleotides with k intervening bases and n(k) is the total number of all possible two nucleotides with k intervening bases. If k = 0,
  is the dinucleotide composition (16).
Random forest
RF is a classifier consisting of an ensemble of tree-structured classifiers (17). RF takes advantage of two powerful machine-learning techniques: bagging (18) and random feature selection. In bagging, each tree is trained on a bootstrap sample of the training data, and predictions are made by majority vote of trees. RF is a further development of bagging. Instead of using all features, RF randomly selects a subset of features to split at each node when growing a tree. To assess the prediction performance of the algorithm, RF performs a type of cross-validation in parallel with the training step by using the so-called out-of-bag (OOB) samples. Specifically, in the process of training, each tree is grown using a particular bootstrap sample. Since bootstrapping is sampling with replacement from the training data, some of the sequences will be ‘left out’ of the sample, while others will be repeated in the sample. The ‘left out’ sequences constitute the OOB sample. On average, each tree is grown using about 1 − e−1 ∼ 2/3 of the training sequences, leaving e−1 ∼ 1/3 as OOB. Because OOB sequences have not been used in the tree construction, one can use them to estimate the prediction performance (19,20). The RF algorithm was implemented by the randomForest R package (21).
Support vector machine
SVM is a supervised machine-learning technology based on statistical theory for data classification (22). SVM seeks an optimal hyperplane to separate two classes of samples. It uses kernel functions to map original data to a feature space of higher dimensions and locate an optimal separating hyperplane there. The SVM algorithm was implemented by the e1071 (version 1.5-12) R package (23). We used different kernels (linear, RBF, 2, 3-order polynomial) and the RBF kernel performed the best (data not shown). So we used the SVM with RBF kernel, as a competent machine-learning method, to compare with the RF algorithm. The parameters C and γ of the RBF kernel were optimized by the standard grid search (24).
Prediction system assessment
For a prediction problem, a classifier can classify an individual instance into the following four categories: false positive (FP), true positive (TP), false negative (FN) and true negative (TN). The total prediction accuracy (ACC), Specificity (Sp), Sensitivity (Se) and Mattew's correlation coefficient (MCC) (25) for assessment of the prediction system are given by
| 2 |
| 3 |
| 4 |
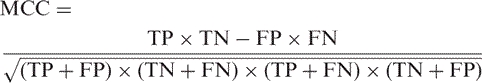 |
5 |
Reliability index
Here, the reliability index (RI) was used to determine the effectiveness of recombination hotspots and coldspots prediction. For RF algorithm, an intuitive RI can be derived from the fractions of votes for the positive and negative classes of each sample. We define RI as:
| 6 |
where f+ and f− are fractions of votes for the positive and negative classes of each sample, respectively.
RESULTS
Constructing the RF prediction model with gapped dinucleotide composition features
The prediction results of the RF classifiers were shown in Table 1. The performance was evaluated by the OOB estimation on the training dataset. The gap {0} and the gap {1} dinucleotide composition-based RF prediction models achieved total accuracies of 80.94 and 81.12%, respectively. The prediction performance can be improved by combing the two composition features. The gap {0, 1} based RF model achieved 82.05% total accuracy and 0.638 MCC value.
Table 1.
The prediction performance of the RF modela using the gapped dinucleotide composition feature
| Featuresb | Se (%) | Sp (%) | MCC | ACC (%) |
|---|---|---|---|---|
| Gap{0} | 79.57 | 83.02 | 0.615 | 80.94 |
| Gap{1} | 79.81 | 83.10 | 0.619 | 81.12 |
| Gap{0,1} | 80.59 | 84.26 | 0.638 | 82.05 |
aRF model with parameters mtry = 4 and ntree = 1000. The prediction system was evaluated by the OOB estimation.
bThe gapped dinucleotide composition features were used. The integers which were inside the brackets indicated the number of intervening bases.
Reliability index of the RF model
The reliability of prediction is an important factor that gives users more information about the quality of the prediction. We adopted RI to indicate the level of certainty of the prediction model. The results, as shown in Figure 1, were obtained through the OOB estimation. It indicated that the higher the RI was the higher reliability the prediction gained. When RI > 6, the total prediction accuracy is >90%. Approximately, 78.1% of the predicted sequences were with RI > 2 which indicated that the RF prediction model was reliable.
Figure 1.

Expected prediction accuracy for sequences with different reliability indices. The accuracy and the fraction of sequences with particular RI are given. The expected accuracy of sequences with higher RI is much better than those with lower RI.
Comparison with the SVM prediction model
It has been proven that SVMs usually outperform other machine-learning methods in many fields of pattern recognition (24,26–31). So, we choose the SVM prediction model as an alternative algorithm to compare with the RF prediction model. To make comparisons impartial, a double-fold cross-validation was implemented. We randomly divided the training data set into two independent data sets (data set 1 and data set 2) of approximately equal size. Then, we used one data set for parameters tuning (the parameters were optimized by the standard grid search (24)) and training. The other data set was used for evaluating the prediction performance. As shown in Table 2, the RF classifier outperformed the SVM classifier in both sensitivity and specificity.
Table 2.
Performance comparisons with the SVMs. The training data set was randomly divided into two data sets (data set 1 and data set 2) with approximatly equal size. The performance was evaluated by the double-fold validation
| Classifier | Test 1a | Test 2b | ||||||
|---|---|---|---|---|---|---|---|---|
| Se (%) | Sp (%) | MCC | ACC (%) | Se (%) | Sp (%) | MCC | ACC (%) | |
| RF | 77.02 | 84.31 | 0.615 | 81.15 | 70.20 | 89.82 | 0.616 | 80.56 |
| SVM | 74.04 | 84.31 | 0.588 | 79.90 | 69.41 | 89.47 | 0.605 | 80.00 |
aTest 1 was processed by using data set 1 for parameters tuning and training, data set 2 for prediction performance evaluation.
bTest 2 was processed by using data set 2 for parameters tuning and training, data set 1 for prediction performance evaluation.
Applying the RF model to full genome analysis
In order to evaluate the sensitivity and specificity of the RF model in detecting hotspots and coldspots from the full genome, we trained the RF model on the training data set and tested the remaining 4185 sequences. The distribution of recombination rates of the predicted hot/cold spots with different RI values is shown in Figure 2. There is a trend that an increase in the RI value results in an increase in recombination rates of the predicted hotspots and a decrease in recombination rates of the predicted coldspots, respectively. The predicted hotspots and coldspots have more possibility to be ‘true’ hotspots or coldspots with a higher RI value. Therefore, RI as a regulating parameter controls the trade-off between sensitivity and specificity. We set a cutoff RI > 7. Out of the 4185 sequences, a total of 195 sequences were predicted as hotspots and 591 sequences were predicted as coldspots. Approximately, 81.0% of the predicted hotspots had relative recombination ratios >1.09 and ∼80.0% of the predicted coldspots had relative recombination ratios <1.07.
Figure 2.

Box plots of recombination rates of the predicted hot/cold spots with different RI values. The median value is represented by a line within the rectangular box. The lower and upper edges of the rectangle represent the first and third quartiles, respectively. The circles and stars represent the ‘mild’ and ‘extreme’ outliers, respectively.
Since it would be surprising to find meiotic recombination hot/cold spots in mtDNA data, the yeast S. cerevisiae mitochondrial data can be served as a negative control for our method. We used the RF model to scan the S. cerevisiae mitochondrial DNA with a non-overlapping window (sliding window size: 0.5 kb). The results showed that all RI values were ≤5 and ∼98.8% RI values were ≤3, which was consistent with the current knowledge.
Web server
The prediction model is implemented as a web server named RF-DYMHC, and it is made available at http://www.bioinf.seu.edu.cn/Recombination/rf_dymhc.htm. Given a yeast genome and prediction parameters (RI value and non-overlapping window scan size), the program breaks the input sequence into subsequences. Each of these subsequences constitutes a sample and each sample will be mapped into a 32-dimension feature space reflecting the gap {0} and gaped {1} base-pair compositions. The output of the web server returns the predicted hotspots and coldspots and marks them in color. More details about the input and output formats are available at http://www.bioinf.seu.edu.cn/Recombination/Manual.htm
DISCUSSION
It is a challenging problem to detect meiotic recombination hotspots and coldspots in eukaryotic genomes based on computational techniques. In this article, we have introduced a RF-based method to detect recombination hot/cold spots from yeast genome. The OOB estimation of the prediction model indicated that the RF classifier achieved high prediction accuracy. It was also compared with an alternative machine-learning algorithm, SVM prediction model. The RF was found to outperform the SVM in both sensitivity and specificity. We used the RF model to test the remaining 4185 sequences. The results indicated that the RI controlled the trade-off between sensitivity and specificity.
Though the prediction model was constructed by a two-class prediction model, we attempted to construct another three-class RF prediction model. We ranked the Gerton et al. data sets (5266 sequences) based on the median array value of the seven microarrays. The top one-third sequences were marked as hotspots, the bottom one-third sequences as coldspots and the rest as neutral sequences. The total accuracy of the OOB estimation was 51.22%, which was only 17.89% higher than the random classifier. Approximately 65.60% of the failed predicted coldspots were falsely predicted as neutral ones, while ∼67.23% of the failed predicted neutral sequences were classified into coldspots. The results indicated that the three-class RF model failed to separate the coldspots from the neutral ones.
Since the experimental identification of recombination hot/cold spots is time consuming and money costing, it is infeasible for large numbers of genomic sequences. Hence, efficiently and reliably detecting them by computational approach is important. Further improvement of our model will be focused on incorporating more attributes. Our predicting system will also be optimized by the rapidly increased experimental validated data sets in the future.
ACKNOWLEDGEMENT
Funding to pay the Open Access publication charges for this article was provided by National Natural Science Foundation of China (No. 60121101).
Conflict of interest statement. None declared.
REFERENCES
- 1.Lichten M, Goldman AS. Meiotic recombination hotspots. Annu. Rev. Genet. 1995;29:423–444. doi: 10.1146/annurev.ge.29.120195.002231. [DOI] [PubMed] [Google Scholar]
- 2.Zenvirth D, Arbel T, Sherman A, Goldway M, Klein S, Simchen G. Multiple sites for double-strand breaks in whole meiotic chromosomes of Saccharomyces cerevisiae. EMBO J. 1992;11:3441–3447. doi: 10.1002/j.1460-2075.1992.tb05423.x. [DOI] [PMC free article] [PubMed] [Google Scholar]
- 3.Klein S, Zenvirth D, Dror V, Barton AB, Kaback DB, Simchen G. Patterns of meiotic double-strand breakage on native and artificial yeast chromosomes. Chromosoma. 1996;105:276–284. doi: 10.1007/BF02524645. [DOI] [PubMed] [Google Scholar]
- 4.Fearnhead P, Smith NG. A novel method with improved power to detect recombination hotspots from polymorphism data reveals multiple hotspots in human genes. Am. J. Hum. Genet. 2005;77:781–794. doi: 10.1086/497579. [DOI] [PMC free article] [PubMed] [Google Scholar]
- 5.Fearnhead P, Donnelly P. Estimating recombination rates from population genetic data. Genetics. 2001;159:1299–1318. doi: 10.1093/genetics/159.3.1299. [DOI] [PMC free article] [PubMed] [Google Scholar]
- 6.Stumpf MP, McVean GA. Estimating recombination rates from population-genetic data. Nat. Rev. Genet. 2003;4:959–968. doi: 10.1038/nrg1227. [DOI] [PubMed] [Google Scholar]
- 7.Fullerton SM, Bernardo Carvalho A, Clark AG. Local rates of recombination are positively correlated with GC content in the human genome. Mol. Biol. Evol. 2001;18:1139–1142. doi: 10.1093/oxfordjournals.molbev.a003886. [DOI] [PubMed] [Google Scholar]
- 8.Kliman RM, Hey J. Reduced natural selection associated with low recombination in Drosophila melanogaster. Mol. Biol. Evol. 1993;10:1239–1258. doi: 10.1093/oxfordjournals.molbev.a040074. [DOI] [PubMed] [Google Scholar]
- 9.Kliman RM, Irving N, Santiago M. Selection conflicts, gene expression, and codon usage trends in yeast. J. Mol. Evol. 2003;57:98–109. doi: 10.1007/s00239-003-2459-9. [DOI] [PubMed] [Google Scholar]
- 10.Marais G, Mouchiroud D, Duret L. Does recombination improve selection on codon usage? Lessons from nematode and fly complete genomes. Proc. Natl Acad. Sci. USA. 2001;98:5688–5692. doi: 10.1073/pnas.091427698. [DOI] [PMC free article] [PubMed] [Google Scholar]
- 11.Marais G, Piganeau G. Hill-Robertson interference is a minor determinant of variations in codon bias across Drosophila melanogaster and Caenorhabditis elegans genomes. Mol. Biol. Evol. 2002;19:1399–1406. doi: 10.1093/oxfordjournals.molbev.a004203. [DOI] [PubMed] [Google Scholar]
- 12.Perry J, Ashworth A. Evolutionary rate of a gene affected by chromosomal position. Curr. Biol. 1999;9:987–989. doi: 10.1016/s0960-9822(99)80430-8. [DOI] [PubMed] [Google Scholar]
- 13.Zhou T, Weng J, Sun X, Lu Z. Support vector machine for classification of meiotic recombination hotspots and coldspots in Saccharomyces cerevisiae based on codon composition. BMC Bioinformatics. 2006;7:223. doi: 10.1186/1471-2105-7-223. [DOI] [PMC free article] [PubMed] [Google Scholar]
- 14.Gerton JL, DeRisi J, Shroff R, Lichten M, Brown PO, Petes TD. Inaugural article: global mapping of meiotic recombination hotspots and coldspots in the yeast Saccharomyces cerevisiae. Proc. Natl Acad. Sci. USA. 2000;97:11383–11390. doi: 10.1073/pnas.97.21.11383. [DOI] [PMC free article] [PubMed] [Google Scholar]
- 15.Cherry JM, Ball C, Weng S, Juvik G, Schmidt R, Adler C, Dunn B, Dwight S, Riles L, et al. Genetic and physical maps of Saccharomyces cerevisiae. Nature. 1997;387:67–73. [PMC free article] [PubMed] [Google Scholar]
- 16.Park KJ, Kanehisa M. Prediction of protein subcellular locations by support vector machines using compositions of amino acids and amino acid pairs. Bioinformatics. 2003;19:1656–1663. doi: 10.1093/bioinformatics/btg222. [DOI] [PubMed] [Google Scholar]
- 17.Breiman L. Random forest. Mach. Learning. 2001;45:5–32. [Google Scholar]
- 18.Breiman L. Bagging predictors. Mach. Learning. 1996;24:123–14. [Google Scholar]
- 19.Svetnik V, Liaw A, Tong C, Culberson JC, Sheridan RP, Feuston BP. Random forest: a classification and regression tool for compound classification and QSAR modeling. J. Chem. Inf. Comput. Sci. 2003;43:1947–1958. doi: 10.1021/ci034160g. [DOI] [PubMed] [Google Scholar]
- 20.Diaz-Uriarte R, Alvarez de Andres S. Gene selection and classification of microarray data using random forest. BMC Bioinformatics. 2006;7:3. doi: 10.1186/1471-2105-7-3. [DOI] [PMC free article] [PubMed] [Google Scholar]
- 21.Liaw A, Wiener M. Classification and regression by randomForest. R News. 2002;2:18–22. [Google Scholar]
- 22.Vapnik V. Statistical Learning Theory. NY, USA: Wiley; 1998. [Google Scholar]
- 23.Dimitriadou E, Hornik K, Leisch F, Meyer D, Weingessel A. e1071: Misc Functions of the Department of Statistics (e1071), TU Wien. 2006 [Google Scholar]
- 24.Hua S, Sun Z. Support vector machine approach for protein subcellular localization prediction. Bioinformatics. 2001;17:721–728. doi: 10.1093/bioinformatics/17.8.721. [DOI] [PubMed] [Google Scholar]
- 25.Matthews BW. Comparison of the predicted and observed secondary structure of T4 phage lysozyme. Biochim. Biophys. Acta. 1975;405:442–451. doi: 10.1016/0005-2795(75)90109-9. [DOI] [PubMed] [Google Scholar]
- 26.Bhasin M, Raghava GP. ESLpred: SVM-based method for subcellular localization of eukaryotic proteins using dipeptide composition and PSI-BLAST. Nucleic Acids Res. 2004;32:W414–W419. doi: 10.1093/nar/gkh350. [DOI] [PMC free article] [PubMed] [Google Scholar]
- 27.Bhasin M, Reinherz EL, Reche PA. Recognition and classification of histones using support vector machine. J. Comput. Biol. 2006;13:102–112. doi: 10.1089/cmb.2006.13.102. [DOI] [PubMed] [Google Scholar]
- 28.Lin HH, Han LY, Cai CZ, Ji ZL, Chen YZ. Prediction of transporter family from protein sequence by support vector machine approach. Proteins. 2006;62:218–231. doi: 10.1002/prot.20605. [DOI] [PubMed] [Google Scholar]
- 29.Yu X, Cao J, Cai Y, Shi T, Li Y. Predicting rRNA-, RNA-, and DNA-binding proteins from primary structure with support vector machines. J. Theor. Biol. 2006;240:175–184. doi: 10.1016/j.jtbi.2005.09.018. [DOI] [PubMed] [Google Scholar]
- 30.Cai CZ, Wang WL, Sun LZ, Chen YZ. Protein function classification via support vector machine approach. Math. Biosci. 2003;185:111–122. doi: 10.1016/s0025-5564(03)00096-8. [DOI] [PubMed] [Google Scholar]
- 31.Cai YD, Liu XJ, Li YX, Xu XB, Chou KC. Prediction of beta-turns with learning machines. Peptides. 2003;24:665–669. doi: 10.1016/s0196-9781(03)00133-5. [DOI] [PubMed] [Google Scholar]