Abstract
The nonpathogenic phenotype of the live rabies virus (RV) vaccine SPBNGAN is determined by an Arg→Glu exchange at position 333 in the glycoprotein, designated GAN. We recently showed that after several passages of SPBNGAN in mice, an Asn→Lys mutation arose at position 194 of GAN, resulting in GAK, which was associated with a reversion to the pathogenic phenotype. Because an RV vaccine candidate containing two GAN genes (SPBNGAN-GAN) exhibits increased immunogenicity in vivo compared to the single-GAN construct, we tested whether the presence of two GAN genes might also enhance the probability of reversion to pathogenicity. Comparison of SPBNGAN-GAN with RVs constructed to contain either both GAN and GAK genes (SPBNGAN-GAK and SPBNGAK-GAN) or two GAK genes (SPBNGAK-GAK) showed that while SPBNGAK-GAK was pathogenic, SPBNGAN-GAN and SPBNGAN-GAK were completely nonpathogenic and SPBNGAK-GAN showed strongly reduced pathogenicity. Analysis of genomic RV RNA in mouse brain tissue revealed significantly lower virus loads in SPBNGAN-GAK- and SPBNGAK-GAN-infected brains than those detected in SPBNGAK-GAK-infected brains, indicating the dominance of the nonpathogenic phenotype determined by GAN over the GAK-associated pathogenic phenotype. Virus production and viral RNA synthesis were markedly higher in SPBNGAN-, SPBNGAK-GAN-, and SPBNGAN-GAK-infected neuroblastoma cells than in the SPBNGAK- and SPBNGAK-GAK-infected counterparts, suggesting control of GAN dominance at the level of viral RNA synthesis. These data point to the lower risk of reversion to pathogenicity of a recombinant RV carrying two identical GAN genes compared to that of an RV carrying only a single GAN gene.
Rabies is a major zoonotic disease that remains an important public health problem, causing 60,000 annual deaths worldwide (11). In most developing countries, dogs represent the major rabies reservoir, whereas the situation in the Americas is much more complex, since large reservoirs of rabies viruses (RVs) exist in many wild animal species (17). Oral immunization of wildlife with live vaccines, such as the modified live rabies virus vaccines SAD B19, SAG-1, and SAG-2, or the vaccinia-rabies glycoprotein recombinant virus vaccine, VRG, is the most effective method to control and eventually eradicate rabies (24). In this regard, VRG has been widely distributed in the United States through programs designed to control rabies among free-ranging raccoons, foxes, and coyotes, but concerns have been raised regarding the safety of VRG (15).
The recent advent of reverse genetics technology has made the development of a safer modified live rabies vaccine feasible. RV is a negative-stranded RNA virus of the rhabdovirus family which has a relatively simple, modular genome organization and encodes five structural proteins: an RNA-dependent RNA polymerase (L), a nucleoprotein (N), a phosphorylated protein (P), a matrix protein (M), and an external surface glycoprotein (G). The RV G is not only the major antigen responsible for the induction of protective immunity (2), but it is also a major contributor to the pathogenicity of the virus. Several G-associated pathogenic mechanisms have been identified (3, 9, 12, 13, 20, 21). To increase the safety and immunogenicity of recombinant RV vaccines, distinct genetic alterations have been introduced that affect the pathogenicity and immunogenicity of the virus. For example, the recombinant RV SPBNGA has been constructed to carry the G gene of SADB19, in which Arg333 has been replaced by Glu333 (6). The Glu333 G protein, referred to as GAN, renders the virus nonpathogenic for adult mice after intracranial (i.c.) infection. Moreover, infection with an RV recombinant constructed to contain two identical GAN genes, RV SPBNGAN-GAN, resulted in overexpression of RV G and enhanced apoptosis in vitro, which was paralleled by an increased immunogenicity in vivo (6). Although these properties make SPBNGAN-GAN an excellent candidate for a live oral vaccine for stray dogs and wildlife, there are concerns regarding the genetic stability of the nonpathogenic phenotype and thus the safety of this recombinant RV. Indeed, after passaging of several recombinant viruses in newborn mice, an Asn194→Lys194 mutation occurred in the GAN gene (4). This mutated GAN, designated GAK, was solely responsible for the reemergence of the pathogenic phenotype (5). To investigate whether the presence of two G genes in SPBNGAN-GAN might actually increase the probability of reversion to pathogenicity, we analyzed RVs constructed to contain either two GAK genes (SPBNGAK-GAK) or a GAN and a GAK gene (SPBNGAN-GAK or SPBNGAK-GAN). While SPBNGAK-GAK was pathogenic, SPBNGAN-GAK and SPBNGAK-GAN were either completely nonpathogenic or exhibited strongly reduced pathogenicity after i.c. infection of adult mice. Thus, the nonpathogenic phenotype determined by GAN is dominant over the pathogenic phenotype associated with GAK.
MATERIALS AND METHODS
Viruses and cell lines.
The recombinant RV vector SPBN was derived from the SAD B19 cDNA clone (19). The generation of the single-G variants SPBNGAN and SPBNGAK and the double G variant SPBNGAN-GAN is described elsewhere (5, 6). Neuroblastoma (NA) cells of A/J mouse origin were grown at 37°C in RPMI 1640 supplemented with 10% fetal bovine serum. BSR cells, a derivative of BHK-21 cells (18), were grown at 37°C in Dulbecco's modified Eagle's medium supplemented with 10% fetal bovine serum.
Construction of recombinant RV cDNA variants.
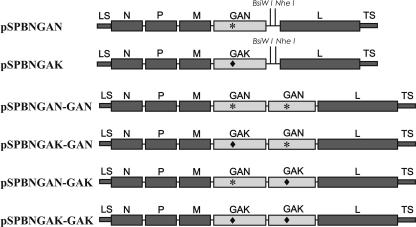
To obtain pSPBNGAK-GAK and pSPBNGAN-GAK, the GAK gene was amplified by PCR using high-fidelity Deep Vent polymerase (New England Biolabs, Beverly, MA) and pSPBNGAK as a template, and primers SADB19 BsiWI (sense, 5′-CGA TGT ATA CGT ACG AAG ATG TTC CTC AGC TCT CCT G-3′ [BsiWI site underlined, start codon in boldface]), and SADB19 NheI (antisense, 5′-CTT ATC AGC TAG CTA GCT AGT TAC AGT CTG TCT CAC CCC CA-3′ [NheI site underlined, stop codon in boldface]). The PCR product was digested with BsiWI and NheI (New England Biolabs) and ligated to pSPBNGAK or pSPBNGAN previously digested with BsiWI and NheI. The resulting plasmids were designated pSPBNGAK-GAK and pSPBNGAN-GAK, respectively (Fig. 1). To obtain pSPBNGAK-GAN, the GAN fragment was excised from pSPBNGAN-GAN by digestion with BsiWI and NheI and ligated into pSPBNGAK previously digested with BsiWI and NheI. The sequences of both RV G genes in each product were verified by sequencing.
FIG. 1.
Schematic of the construction of recombinant RVs containing one or two modified G genes encoding either an Asn (GAN) or a Lys (GAK) at position 194.
Virus rescue from cDNA clones.
Recombinant RVs were rescued as described previously (6). Briefly, BSR-T7 cells were transfected using a calcium phosphate transfection kit (Stratagene, La Jolla, CA) with 5.0 μg of either pSPBNGAK-GAN, pSPBNGAN-GAK, or pSPBNGAK-GAK and 5.0 μg of pTIT-N, 2.5 μg of pTIT-P, 2.5 μg of pTIT-L, and 2.0 μg of pTIT-G. After a 3-day incubation, supernatants were transferred onto BSR cells, and incubation continued for 3 days at 37°C. Cells were examined for the presence of rescued virus by immunostaining with fluorescein isothiocyanate-labeled anti-rabies virus N protein antibody (Centocor, Inc., Malvern, PA). The correct nucleotide sequences of both G genes in each construct were confirmed by reverse transcriptase PCR analysis and DNA sequencing.
Preparation of virus stocks and virus titration.
BSR cells were infected at a multiplicity of infection (MOI) of 0.1 and incubated for 72 h at 34°C. To determine virus yields, monolayers of NA cells in 96-well plates were infected with serial 10-fold virus dilutions as described previously (22). At 48 h postinfection (p.i.), cells were fixed in 80% acetone and stained with fluorescein isothiocyanate-labeled rabies virus N protein-specific antibody (Centocor, Inc.). Foci were counted using a fluorescence microscope, and virus titers were calculated as focus-forming units (FFU). All titrations were done in triplicate.
Assay for recombinant virus pathogenicity in mice.
Randomized groups of 10 6- to 8-week-old female Swiss Webster mice (Taconic, Inc., Germantown, NY) were infected i.c. under anesthesia with 10 μl of phosphate-buffered saline (PBS) containing 103 FFU or mock infected with PBS alone. After infection, mice were examined for clinical signs of disease, and body weight was recorded daily. Clinical signs were scored using a scale of 0 to 5: 0, no clinical signs; 1, disordered movement; 2, ruffled fur, hunched back; 3, trembling and shaking; 4, complete loss of motion (complete paralysis); 5, death. To ascertain that the scoring of clinical signs was performed in a blinded manner, coded numbers were assigned to the cages containing the different groups of mice, and the code was broken after the termination of the experiments. Differences in body weight between day zero and selected time points within one group were calculated, checked for normality, and analyzed using two-way analysis of variance (ANOVA) with Bonferroni's multiple comparison test. Differences in clinical signs between groups were analyzed using the Kruskal-Wallis one-way analysis of variance on ranks with the Newman-Keuls multiple comparison test. Survivorship in the mouse groups was compared using Kaplan-Meier's (log-rank) survival analysis with Holm-Sidak's multiple comparison test. All animal experiments were performed under Institutional Animal Care and Use Committee-approved protocols (Animal Welfare Assurance no. A3085-01).
RNA isolation, reverse transcription, and real-time PCR.
NA cells grown in T25 tissue culture flasks were infected with RV at an MOI of 5. After incubation for 1 h at 37°C, the inoculum was removed and cells were washed three times with PBS, replenished with 6 ml of RPMI medium 1640 containing 0.2% bovine serum albumin, and incubated at 37°C. At 8, 24, or 48 h, cells were washed with PBS and RNA was extracted using the RNeasy mini kit (QIAGEN, Valencia, CA) according to the manufacturer's protocol. For analysis of viral RNA synthesis in brain tissue, groups of five mice were infected i.c. with 10 μl of PBS containing 103 FFU, and brains were removed 5, 7, and 11 days p.i., cut into four pieces, and suspended in RNAlater (QIAGEN) RNA-stabilizing reagent (1 ml/100 mg brain tissue) until use. After transfer to RLT buffer (QIAGEN) containing 10 μl of β-mercaptoethanol per 1 ml of RLT buffer (100 μl/10 mg tissue), tissues were homogenized and centrifuged for 5 min at 12,000 rpm at 4°C and the supernatant was collected. RNA was isolated using the RNeasy mini kit as described above. Reverse transcription was performed using the Omniscript RT kit (QIAGEN). For transcription of RV genomic RNA, 0.4 μg RNA in 20 μl reaction buffer (QIAGEN) and 2 μl of 5 μM primer RP381 (5′-ACACCCCTACAATGGATGC-3′) were used. To transcribe mRNA, p(dT)15 primer (Roche, Indianapolis, IN) was used. Reverse transcription of mouse 18S rRNA, which was selected as a reference gene, was carried out using a hexanucleotides mix (Roche). Reaction mixtures were incubated at 37°C for 60 min, and the enzyme was inactivated at 95°C for 5 min. For real-time PCR, primer and probe sets were designed using Primer3 input (http://frodo.wi.mit.edu/cgi-bin/primer3/primer3_www.cgi). The following primers were used: mouse 18S rRNA sense primer (5′-GGG GAA TCA GGG TTC GAT-3′), mouse 18S rRNA antisense primer (5′-GGC CTC GAA AGA GTC CTG TA-3′), RV N RNA sense primer (5′AGA AGG GAA TTG GGC TCT G-3′), and RV N RNA antisense primer (5′-TGT TTT GCC CGG ATA TTT TG-3′). Dual 5′-6-carboxyfluorescein- and 3′-6-carboxytetramethylrhodamimine-labeled probes 5′-CTG AGA AAC GGC TAC CAC ATC CAA GGA A-3′ and 5′-CGT CCT TAG TCG GTC TTC TCT TGA GTC TGT-3′ were used for quantification of amplified 18S rRNA and RV N RNA, respectively. Primers and probes were purchased from Sigma-Genosys (The Woodlands, TX). Real-time PCR was performed in capillaries using a LightCycler 1.5 with software 3.5.3 (Roche). Each reaction mixture contained 10 μl 2× master mix DyNAmo probe (New England Biolabs), 500 nM of each primer, 100 nM probe, and 2 μl of cDNA in a total volume of 20 μl. The standard cycling conditions were 95°C for 15 min followed by 40 cycles at 95°C for 15 s and 60°C for 1 min. Samples were run in triplicate. The threshold cycle (CT) refers to the cycle number at which the change in fluorescence intensity exceeded a fixed threshold during a real-time PCR. Copy numbers of genomic RV RNA in mouse brain tissue were calculated using the absolute standard curve method (25). RNA from tissue culture was quantitated using the comparative CT method (25). Differences were analyzed using one-way ANOVA with the Newman-Keuls multiple comparison test.
Determination of virus-neutralizing antibody (VNA).
Groups of eight mice were infected i.c. with 103 FFU in 10 μl of PBS. After 5, 7, and 11 days, blood was collected from mice in each group. Sera were heat inactivated at 65°C for 30 min, and neutralizing activity was determined by the rapid fluorescent focus inhibition test as described elsewhere (23). The neutralization titer, defined as the inverse of the highest serum dilution that neutralized 50% of the challenge virus, was normalized to international units by using the World Health Organization anti-RV antibody standard. Geometric mean titers were calculated from individual titers in each group.
Single-step growth curves.
Confluent NA cell monolayers grown in T25 culture flasks were infected with RV at an MOI of 5. After a 1-h incubation at 37°C, inocula were removed and cells were washed three times with PBS, replenished with 6 ml of RPMI medium 1640 containing 0.2% bovine serum albumin, and incubated at 37°C. Tissue culture supernatant (100 μl) was removed at the indicated time points, and virus was titrated in quadruplicate on NA cells. Differences were analyzed using two-way ANOVA with Bonferroni's multiple comparison test.
Cell viability assay.
Cell viability was determined based on the mitochondrion-dependent reduction of 3-2,5-diphenyltetrazolium bromide (MTT; Sigma, St. Louis, MO) as an indicator of mitochondrial respiration. NA cell monolayers grown in 96-well plates were infected with RV at an MOI of 5 and incubated at 37°C. At 48 h p.i., NA cells were incubated with 0.2 mg of MTT/ml for 1 h at 37°C and lysed with dimethyl sulfoxide. Reduction of MTT to formazan was quantitated using a microplate reader to measure optical density at 550 nm. Differences were analyzed using one-way ANOVA with the Newman-Keuls multiple comparison test.
RESULTS
Asn→Lys 194 mutations in G proteins of SPBNGAN-GAN.
We previously reported the construction of nonpathogenic recombinant RVs containing a Glu residue at position 333 of the G protein (GAN) (6). We also showed that an Asn→Lys194 mutation in the G of SPBNGA was associated with an increase in pathogenicity (GAK) (4). To test whether the replacement of one or both Gs in SPBNGAN-GAN by GAK affects the pathogenicity of the virus, we exchanged the first, the second, or both G genes containing Asn194 with the G gene containing Lys194, resulting in SPBNGAK-GAN, SPBNGAN-GAK, and SPBNGAK-GAK (Fig. 1).
Pathogenicity of double G RV variants in mice.
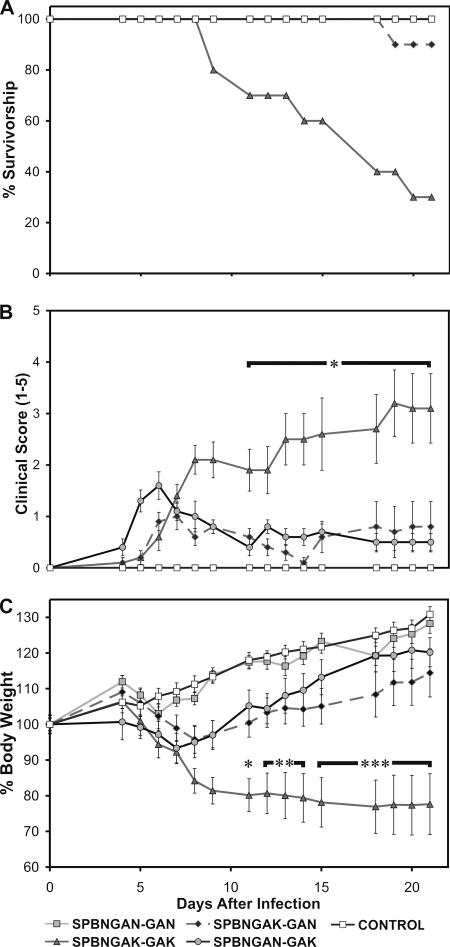
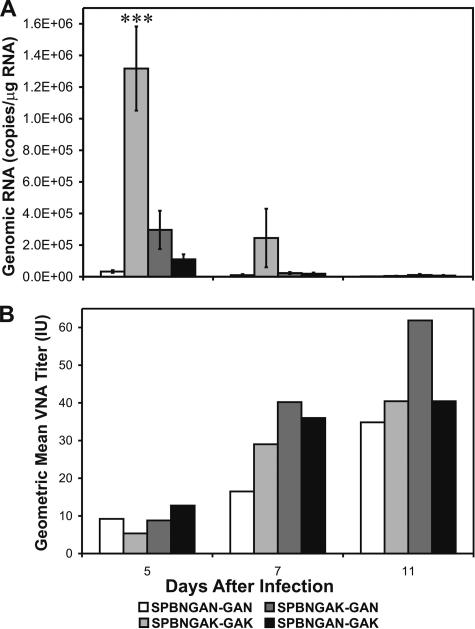
Analysis of mice infected with SPBNGAN-GAN or SPBNGAN-GAK revealed no deaths, and only 10% of mice infected with SPBNGAK-GAN died. By contrast, 70% of mice infected with SPBNGAK-GAK succumbed to infection (P ≤ 0.05) (Fig. 2A). SPBNGAK-GAK-infected mice also developed signs of severe neurological disease, such as disordered movements and seizures, significantly more frequently than other mouse groups (P ≤ 0.05) (Fig. 2B) and exhibited on average 25% loss of body weight (P ≤ 0.05) (Fig. 2C). Mice that survived infection exhibited neurological signs, such as disordered movement and severe hyperexcitation, during the entire observation period and never regained their original body weight. In contrast, SPBNGAK-GAN- and SPBNGAN-GAK-infected mice showed only temporary (days 5 to 8 p.i.) minimal body weight loss (∼5%) and mild hyperexcitation, regaining their original body weight by about day 10 after infection. Body weight loss or gain did not differ significantly between SPBNGAN-GAN- and SPBNGAK-GAN- or SPBNGAN-GAK-infected mice. The slight decline in body weight seen in SPBNGAN-GAN-infected mice between days 5 and 8 p.i. is likely due to a mild transient infection, since it was not observed in mock-infected mice (Fig. 2C). Real-time PCR analysis of genomic RV RNA revealed average virus loads in SPBNGAK-GAN-, SPBNGAN-GAK-, and SPBGAN-GAN-infected brains that were 6-, 18-, and 36-fold lower than those detected in SPBNGAK-GAK-infected cells (P ≤ 0.001) at 5 days p.i., respectively (Fig. 3A). Virus loads strongly declined in all groups of mice at day 7 p.i. The decrease in virus load after day 5 p.i. is most likely due to the induction of VNA (Fig. 3B), which strongly increased over time and led to almost complete clearance of the infection from the brain. Note that VNA titers were comparable (5 to 12 IU) in all mice, at day 5 p.i., including those infected with the pathogenic SPBNGAK-GAK, when the animals did not exhibit significant clinical signs of rabies. Thus, the induction of immunity does not appear to play a decisive role in the outcome of an infection with a pathogenic RV.
FIG. 2.
Mortality (A), clinical score (B), and body weight (C) of Swiss Webster mice infected i.c. with SPBNGAN-GAN, SPBNGAK-GAK, SPBNGAK-GAN, or SPBNGAN-GAK. Data are mean (± standard error) values obtained with 10 mice that were infected i.c. with 103 FFU. Asterisks in panels B and C indicate significant differences in the decrease of body weight (***, P ≤ 0.001; **, P ≤ 0.01; *, P ≤ 0.05) between SPBNGAK-GAK-infected and SPBNGAK-GAN- or SPBNGAN-GAK-infected mice.
FIG. 3.
Synthesis of genomic RV RNA in brain and induction of RV VNA titers in sera of mice infected with different double-G RV variants. Mice were infected i.c. with 103 FFU of SPBNGAN-GAN, SPBNGAK-GAK, SPBNGAK-GAN, or SPBNGAN-GAK. (A) At 5, 7, and 11 days after infection, total RNA was isolated from whole brains and subjected to real-time PCR (see Materials and Methods). Genomic RV RNA copy numbers were calculated using the standard curve method. Data are mean RNA copy numbers (± standard errors) calculated for five mice at each time point. Asterisks indicate significant differences (***, P ≤ 0.001). (B) Blood was obtained 5, 7, and 11 days after infection, and serum VNA titers were determined (see Materials and Methods). Data are given as the geometric mean international units obtained from five mice at each time point.
Pathogenicity of a mixture of single-G RV variants in mice.
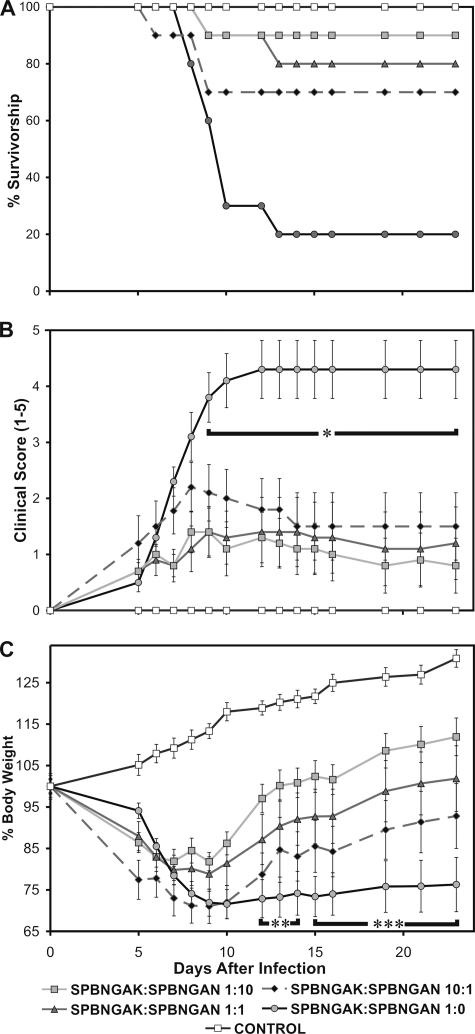
To determine whether the apparent dominance of GAN over GAK when expressed from a single RV genome is also observed when these Gs are expressed from different genomes, we infected mice with mixtures of SPBNGAN and SPBNGAK. Whereas 80% of mice infected with SPBNGAK alone succumbed to the infection, only 30% of the mice infected with a 10:1 mixture of SPBNGAK and SPBNGAN died (Fig. 4A). However, this difference in survivorship was not statistically significant, and survival analysis indicated that only mice coinfected with SPBNGAK and SPBNGAN at ratios of 1:1 (80% survivorship) or 1:10 (90% survivorship) exhibited a significant increase (P ≤ 0.05) in survivorship compared to SPBNGAK-infected mice. All mixed infections with SPBNGAK and SPBNGAN resulted in significantly lower (P ≤ 0.05) clinical scores compared to the infection with SPBNGAK (Fig. 4B). Furthermore, mice infected with different ratios of SPBNGAK and SPBNGAN lost between 17 and 27% of their body weight and either failed to regain their original body weight or did so only very late in infection (Fig. 4C). However, only mice infected with a SPBNGAK-SPBNGAN mixture of 1:10 showed a significant increase (P ≤ 0.05) in body weight between days 12 and 23 compared to SPBNGAK-infected mice, indicating that the dominance of GAN over GAK is less pronounced than when both Gs are expressed from a single genome.
FIG. 4.
Mortality (A), clinical score (B), and body weight (C) of Swiss Webster mice infected i.c. with different ratios of SPBNGAN and SPBNGAK. Data are given as mean (± standard error) values obtained with 10 mice infected i.c. with 103 FFU. Asterisks indicate significant differences in the decrease of body weight (***, P ≤ 0.001; **, P ≤ 0.01; *, P ≤ 0.05) between SPBNGAK-infected mice and mice infected with SPBNGAK or SPBNGAN at ratios of 1:1 or 1:10.
Growth kinetics of single- and double-G RV variants in neuronal cells.
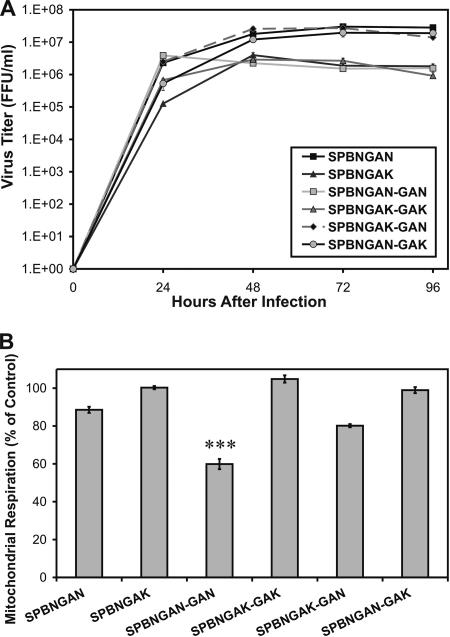
We showed previously that the pathogenicity of an RV correlates inversely with its ability to replicate in tissue culture (7). To determine whether the differences in pathogenicity observed with the different single- and double-G RV variants are also reflected in their replication rates, we first analyzed production of these viruses in NA cells. Single-step growth curves (Fig. 5A) revealed significantly higher (∼1 log; P ≤ 0.05) replication rates of SPBNGAN, SPBNGAK-GAN, and SPBNGAN-GAK at 48, 72, and 96 h than those of SPBNGAK and SPBNGAK-GAK, suggesting that GAN is dominant over GAK in determining the virus replication rate. An unexpected finding was the consistently lower titers of SPBNGAN-GAN than those of SPBNGAN after 24 h p.i. Mitochondrial respiration analysis to determine whether the lower replication rate of SPBNGAN-GAN rests in its known increased cytopathic effect (6) revealed significantly lower (P ≤ 0.001) mitochondrial respiration in SPBNGAN-GAN-infected cells (Fig. 5B). Thus, the cytotoxicity of SPBNGAN-GAN appears to underlie its low virus production.
FIG. 5.
Single-step virus growth curves (A) and mitochondrial respiration (B) in NA cells infected with single- or double-G recombinant RVs. (A) NA cells were infected with the different recombinant RVs at an MOI of 5 and incubated at 37°C. At the indicated times after infection, viruses were harvested and titrated. Data are the means (± standard errors) of four virus titer determinations. (B) NA cells were infected at an MOI of 5, and the mitochondrion-dependent reduction of MTT was determined at 48 h postinfection. Data are mean percentages of controls (± standard error). Asterisks indicate significant differences (***, P ≤ 0.001).
RV RNA transcription/replication in NA cells infected with single- and double-G RV variants.
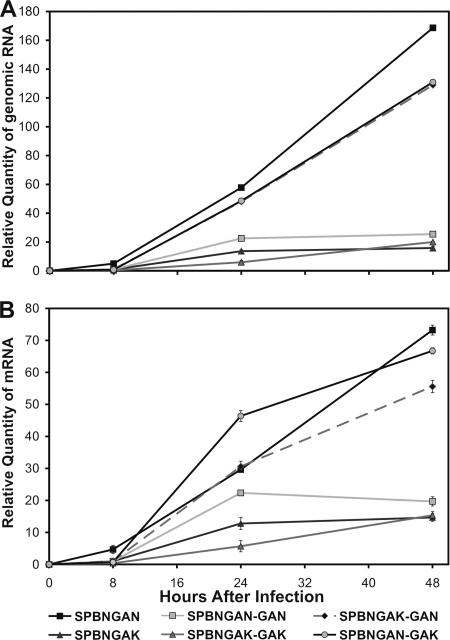
To test the possibility that the differences in virus growth shown in Fig. 5A are due to a role of G in controlling virus transcription/replication, total RNA was isolated from NA cells infected with SPBNGAN, SPBNGAK, SPBNGAN-GAN, SPBNGAK-GAK, SPBNGAK-GAN, or SPBNGAN-GAK and, after reverse transcription of viral N mRNA and genomic RNA, the cDNAs were quantitatively analyzed using real-time PCR. At both 24 and 48 h p.i., SPBNGAK- and SPBNGAK-GAK-infected cells showed the lowest amounts of viral mRNA and genomic RNA (Fig. 6). At 48 h p.i., viral mRNA levels in SPBNGAN-, SPBNGAN-GAK-, and SPBNGAK-GAN-infected cells were 5.6, 5.1, and 4.5 times higher, respectively, than those detected in SPBNGAK- and SPBNGAK-GAK-infected cells (Fig. 6B). Furthermore, 12 and 9 times more genomic viral RNA was detected in SPBNGAN-, SPBNGAN-GAK-, or SPBNGAK-GAN-infected cells, respectively, than in SPBNGAK- and SPBNGAK-GAK-infected cells (Fig. 6A). Note that the viral RNA transcription/replication rate is lower in SPBNGAN-GAN-infected than in SPBNGAN-infected cells, consistent with the relatively low virus titers and the higher cytotoxicity of SPBNGAN-GAN.
FIG. 6.
Transcription of viral mRNA (A) and viral genomic RNA (B) in NA cells infected with the single- or double-G recombinant RVs. Cells were infected at an MOI of 5, and total RNA was isolated at 8, 24, and 48 h postinfection. A fragment of RV N mRNA or the N gene of genomic RV RNA was reverse transcribed and subjected to real-time PCR. The real-time PCR data were normalized and quantified using ribosomal 18S RNA as an internal control. Error bars represent standard errors. These experiments were repeated three times, and similar results were obtained.
Together, the viral RNA transcription/replication data and the growth kinetics observed with the different single- and double-G point mutation variants suggest that particular domains of the RV G gene or RV G protein are involved in the control of viral RV RNA transcription/replication and, consequently, in virus production.
DISCUSSION
Live attenuated rabies vaccines must fulfill the essential requirements of safety, efficacy, and genetic stability. With respect to safety, an Arg→Glu exchange at position 333 of the G protein of SPBN has been shown to render this virus completely nonpathogenic for immunocompetent mice. Here, we designated the G that determines the nonpathogenic phenotype as GAN. With respect to vaccine efficacy, we previously showed that an RV containing two GAN genes is superior to an RV containing only one GAN in inducing protective immunity, making this virus an excellent candidate for a live RV vaccine (6). However, with respect to stability, we found that an Asn→Lys exchange can occur at position 194 of GAN, resulting in GAK and a reversion to the pathogenic phenotype of a single-G RV variant (4). The present study was performed to determine whether the presence of two GAN genes in a double-G RV variant increases or reduces the possibility for reversion to the pathogenic phenotype and thus the safety risk of the vaccine.
Mouse challenge experiments revealed that the pathogenicity of an RV containing a GAN and a GAK gene was strongly reduced compared to that of an RV containing two GAK genes, indicating that GAN is dominant in determining the pathogenicity phenotype of the RV. The nonpathogenic phenotype determined by GAN appears to be dependent on the expression level of this G, since an RV that contains GAN in the fifth position (SPBNGAK-GAN) is slightly more pathogenic than an RV where the GAN is in the fourth position (SPBNGAN-GAK) of the genome, and G expression is higher. However, the strong attenuation of SPBNGAK-GAN and SPBNGAN-GAK compared to SPBNGAK-GAK cannot be primarily due to the presence of an extra gene within the RV genome but rather to the dominance of the nonpathogenic phenotype determined by GAN over the pathogenic phenotype associated with GAK. The differences in survivorship rates, clinical scores, and body weight loss seen after infection with the double-G RV variants were paralleled by the different virus loads detected in the brains of these mice. The residual transient illness seen at earlier times postinfection in SPBNGAN-GAK- or SPBNGAK-GAN-infected mice is most likely due to a slight increase in the spread of these variants in brain tissue, as shown in Fig. 3A. We have already shown that GAK, as opposed to GAN, is associated with increased virus spread in the brain (5). The decreased virus loads in brains infected with SPBNGAK-GAN or SPBNGAN-GAK compared to those infected with SPBNGAK-GAK are further evidence for the dominant effect of GAN. On the other hand, the induction of RV VNA, which is the major immune effector against rabies virus, appears to be unrelated to the pathogenic phenotype of an RV G, consistent with previous findings that the induction of adaptive immune effectors after infection, particularly VNA, does not appear to play a decisive role in the outcome of an RV infection (7). Although virus loads strongly declined in SPBNGAK-GAK-infected mice, likely due to the increase in antibody production, the clearance of virus occurred apparently too late and only after the infection had already spread and caused lethal damage to the brain.
The mortality and morbidity rates in SPBNGAK-GAK-infected mice were slightly lower than in mice infected with SPBNGAK. In this respect it was shown that insertion of additional genes into the RV genome can result in a moderate attenuation of the virus (14). In addition, the insertion of a second G gene results in increased G expression, which is known to be associated with decreased pathogenicity (13).
The dominance of the nonpathogenic phenotype associated with GAN was also observed in mixed infections with the single-G RV variants SPBNGAN and SPBNGAK, although the dominance of GAN over GAK was more pronounced when both Gs were expressed from a single genome. However, the fact that the GAK mutation arose spontaneously in newborn mice (4) suggests that the dominance of GAN over GAK is pertinent only in adult mice and that immunity likely plays a role in the dominance phenomenon. In the absence of antiviral immunity, the GAK variant has an advantage because of its increased neuronal spread ability. On the other hand, the increased replication efficiency of the GAN variant likely results in an enhanced immune response in immunocompetent mice at the very early stage of infection (e.g., 1 to 3 days p.i.), resulting in virus clearance before major neuronal damage occurs.
Our growth kinetics data obtained with the different single- and double-G variants support previous findings that the pathogenicity of an RV correlates inversely with its replication rate in tissue culture (7, 13). The pathogenic RV variants SPBNGAK and SPBNGAK-GAK produced virus titers in NA cells that were on average 1 log unit lower than those produced by the nonpathogenic or less pathogenic variants containing a GAN, with the exception of SPBNGAN-GAN, in which the lower replication rate most likely rests in an increased apoptosis-inducing ability (6) leading to cell injury and death before maximal virus titers are produced.
Real-time PCR analysis revealed that the rate of viral RNA transcription and replication in NA cells infected with SPBNGAN is 5 and 10 times higher, respectively, than in NA cells infected with SPBNGAK, providing insight into potential mechanisms to account for the dominance of the nonpathogenic phenotype associated with GAN. Interestingly, the viral RNA transcription/replication rate in SPBNGAN-infected NA cells was also significantly higher than in cells infected with the pathogenic SPBN strain (data not shown). The rate of viral RNA transcription and replication in SPBNGAK-GAN- or SPBNGAN-GAK-infected cells was similar to that in SPBNGAN-infected cells, suggesting that the dominance of GAN over GAK is regulated at the level of viral RNA synthesis. This potential mechanism for the regulation of the dominance by the GAN gene appears to be similar to that proposed for cold-adapted influenza viruses. Such highly attenuated influenza viruses are dominant over wild-type influenza viruses in mixed infections (10), and it has been suggested that the influenza virus genome segment 7, which encodes the M1 and M2 proteins, regulates the dominance of the attenuated influenza viruses at the level of RNA synthesis (10). In another attenuated interference dominant influenza virus, where the interference was mapped to segment 2 encoding the PB1 gene (1), and in an interference dominant vesicular stomatitis virus mutant in which the L protein was shown to account for the interference (8), the dominance appeared to be determined at the level of RNA synthesis. However, the precise mechanisms by which these different viral genes or gene products regulate viral RNA synthesis remain to be elucidated.
The finding that the nonpathogenic GAN is dominant over the pathogenic GAK has great significance for the use of engineered attenuated double-G RV variants as live vaccines. These viruses not only exhibit superior efficacy, particularly after oral administration (6, 16), but also bear a much lower safety risk than attenuated single-G RV variants. The potential reversion to the pathogenic phenotype due to the high mutation rate characteristic of all RNA viruses remains an almost insurmountable problem in the use of live attenuated single-G RV variants for immunization. The presence of two nonpathogenic Gs within a single RV genome considerably decreases the possibility of reemergence of a pathogenic phenotype, since the occurrence of simultaneous mutations in both Gs seems highly unlikely.
Acknowledgments
This study was supported by NIH grants AI45097 and AI060686.
Footnotes
Published ahead of print on 25 April 2007.
REFERENCES
- 1.Bailly, J. E., and E. G. Brown. 1998. Interference by a non-defective variant of influenza A virus is due to enhanced RNA synthesis and assembly. Virus Res. 57:81-100. [DOI] [PubMed] [Google Scholar]
- 2.Cox, J. H., B. Dietzschold, and L. G. Schneider. 1977. Rabies virus glycoprotein. II. Biological and serological characterization. Infect. Immun. 16:754-759. [DOI] [PMC free article] [PubMed] [Google Scholar]
- 3.Dietzschold, B., T. J. Wiktor, J. Q. Trojanowski, R. I. Macfarlan, W. H. Wunner, M. J. Torres-Anjel, and H. Koprowski. 1985. Differences in cell-to-cell spread of pathogenic and apathogenic rabies virus in vivo and in vitro. J. Virol. 56:12-18. [DOI] [PMC free article] [PubMed] [Google Scholar]
- 4.Dietzschold, M. L., M. Faber, J. A. Mattis, K. Y. Pak, M. J. Schnell, and B. Dietzschold. 2004. In vitro growth and stability of recombinant rabies viruses designed for vaccination of wildlife. Vaccine 23:518-524. [DOI] [PubMed] [Google Scholar]
- 5.Faber, M., M. L. Faber, A. Papaneri, M. Bette, E. Weihe, B. Dietzschold, and M. J. Schnell. 2005. A single amino acid change in rabies virus glycoprotein increases virus spread and enhances virus pathogenicity. J. Virol. 79:14141-14148. [DOI] [PMC free article] [PubMed] [Google Scholar]
- 6.Faber, M., R. Pulmanausahakul, S. S. Hodawadekar, S. Spitsin, J. P. McGettigan, M. J. Schnell, and B. Dietzschold. 2002. Overexpression of the rabies virus glycoprotein results in enhancement of apoptosis and antiviral immune response. J. Virol. 76:3374-3381. [DOI] [PMC free article] [PubMed] [Google Scholar]
- 7.Faber, M., R. Pulmanausahakul, K. Nagao, M. Prosniak, A. B. Rice, H. Koprowski, M. J. Schnell, and B. Dietzschold. 2004. Identification of viral genomic elements responsible for rabies virus neuroinvasiveness. Proc. Natl. Acad. Sci. USA 101:16328-16332. [DOI] [PMC free article] [PubMed] [Google Scholar]
- 8.Jordan, J. A., P. Whitaker-Dowling, and J. S. Youngner. 1989. The L protein of a VSV mutant isolated from a persistent infection is responsible for viral interference and dominance over the wild-type. Virology 169:137-141. [DOI] [PubMed] [Google Scholar]
- 9.Lentz, T. L., T. G. Burrage, A. L. Smith, J. Crick, and G. H. Tignor. 1982. Is the acetylcholine receptor a rabies virus receptor? Science 215:182-184. [DOI] [PubMed] [Google Scholar]
- 10.Maloy, M. L., P. Whitaker-Dowling, and J. S. Youngner. 1994. Dominance of cold-adapted influenza A virus over wild-type viruses is at the level of RNA synthesis. Virology 205:44-50. [DOI] [PubMed] [Google Scholar]
- 11.Martinez, L. 2000. Global infectious disease surveillance. Int. J. Infect. Dis. 4:222-228. [DOI] [PubMed] [Google Scholar]
- 12.Mebatsion, T., M. Konig, and K. K. Conzelmann. 1996. Budding of rabies virus particles in the absence of the spike glycoprotein. Cell 84:941-951. [DOI] [PubMed] [Google Scholar]
- 13.Morimoto, K., D. C. Hooper, S. Spitsin, H. Koprowski, and B. Dietzschold. 1999. Pathogenicity of different rabies virus variants inversely correlates with apoptosis and rabies virus glycoprotein expression in infected primary neuron cultures. J. Virol. 73:510-518. [DOI] [PMC free article] [PubMed] [Google Scholar]
- 14.Pulmanausahakul, R., M. Faber, K. Morimoto, S. Spitsin, E. Weihe, D. C. Hooper, M. J. Schnell, and B. Dietzschold. 2001. Overexpression of cytochrome C by a recombinant rabies virus attenuates pathogenicity and enhances antiviral immunity. J. Virol. 75:10800-10807. [DOI] [PMC free article] [PubMed] [Google Scholar]
- 15.Rupprecht, C. E., L. Blass, K. Smith, L. A. Orciari, M. Niezgoda, S. G. Whitfield, R. V. Gibbons, M. Guerra, and C. A. Hanlon. 2001. Human infection due to recombinant vaccinia-rabies glycoprotein virus. New Engl. J. Med. 345:582-586. [DOI] [PubMed] [Google Scholar]
- 16.Rupprecht, C. E., C. A. Hanlon, J. Blanton, J. Manangan, P. Morrill, S. Murphy, M. Niezgoda, L. A. Orciari, C. L. Schumacher, and B. Dietzschold. 2005. Oral vaccination of dogs with recombinant rabies virus vaccines. Virus Res. 111:101-105. [DOI] [PubMed] [Google Scholar]
- 17.Rupprecht, C. E., J. S. Smith, M. Fekadu, and J. E. Childs. 1995. The ascension of wildlife rabies: a cause for public health concern or intervention? Emerg. Infect. Dis. 1:107-114. [DOI] [PMC free article] [PubMed] [Google Scholar]
- 18.Sato, M., N. Maeda, H. Yoshida, M. Urade, S. Saito, T. Miyazaki, T. Shibata, and M. Watanabe. 1977. Plaque formation of herpes virus hominis type 2 and rubella virus in variants isolated from the colonies of BHK21/WI-2 cells formed in soft agar. Arch. Virol. 53:269-273. [DOI] [PubMed] [Google Scholar]
- 19.Schnell, M. J., T. Mebatsion, and K. K. Conzelmann. 1994. Infectious rabies viruses from cloned cDNA. EMBO J. 13:4195-4203. [DOI] [PMC free article] [PubMed] [Google Scholar]
- 20.Thoulouze, M. I., M. Lafage, M. Schachner, U. Hartmann, H. Cremer, and M. Lafon. 1998. The neural cell adhesion molecule is a receptor for rabies virus. J. Virol. 72:7181-7190. [DOI] [PMC free article] [PubMed] [Google Scholar]
- 21.Tuffereau, C., J. Benejean, D. Blondel, B. Kieffer, and A. Flamand. 1998. Low-affinity nerve-growth factor receptor (P75NTR) can serve as a receptor for rabies virus. EMBO J. 17:7250-7259. [DOI] [PMC free article] [PubMed] [Google Scholar]
- 22.Wiktor, T. J., P. C. Doherty, and H. Koprowski. 1977. In vitro evidence of cell-mediated immunity after exposure of mice to both live and inactivated rabies virus. Proc. Natl. Acad. Sci. USA 74:334-338. [DOI] [PMC free article] [PubMed] [Google Scholar]
- 23.Wiktor, T. J., R. I. Macfarlan, C. M. Foggin, and H. Koprowski. 1984. Antigenic analysis of rabies and Mokola virus from Zimbabwe using monoclonal antibodies. Dev. Biol. Stand. 57:199-211. [PubMed] [Google Scholar]
- 24.Winkler, W. G., and K. Bogel. 1992. Control of rabies in wildlife. Sci. Am. 266:86-92. [DOI] [PubMed] [Google Scholar]
- 25.Wong, M. L., and J. F. Medrano. 2005. Real-time PCR for mRNA quantitation. BioTechniques 39:75-85. [DOI] [PubMed] [Google Scholar]


