Abstract
PR1 cells are a prolactin (PRL)-secreting cell line derived from a pituitary lactotroph tumor found in 17β-estradiol-treated Fischer 344 rats. We examined the effect of estrogen on cell proliferation and PRL synthesis under various culture conditions. Estrogen, at extremely low concentrations, induces cell proliferation in this cell line, whereas antiestrogen inhibits proliferation. Interestingly, the proliferation response is much more sensitive than the PRL response because 0.01 pM estradiol or diethylstilbestrol induces half-maximal growth induction [≈0.1% estrogen receptor (ER) occupancy is required], whereas 0.01 nM concentration is required for half-maximal PRL induction (≈50% ER occupancy is required). The proliferation response is not as sensitive to antiestrogen as the PRL response, because 10 nM concentration of the pure antiestrogen ICI 182,780 could not inhibit 1 nM estradiol- or diethylstilbestrol-induced proliferation. The same concentration of ICI 182,780 decreased PRL secretion to 1% of estradiol- or diethylstilbestrol-induced prolactin secretion suggesting a possible dichotomy of ER control of proliferation and PRL synthesis. The Kd of ER binding in these cells is about 3 × 10⁻¹¹ M. These results with the PR1 cells extend previous studies in other estrogen- regulated systems and suggest that only a small pool of ER is required for cell proliferation in contrast with the regulation of expression of specific genes. They also raise questions as to how a dimeric receptor functions when only one ligand site is occupied or when both an estrogen and an antiestrogen occupy one dimer.
Estrogen is a physiological regulator of both replication and prolactin (PRL) synthesis in pituitary lactotrophs. Pituitaries of the Fischer 344 (F344) rat strain form tumors in response to 6–10 weeks of estrogen treatment (1–3). The GH3 cell line was derived from the radiation-induced MtT/W5 transplantable pituitary tumor (4), and the GH4C1 cell line was subcloned from the GH3 cell line (5, 6). These cell lines are somatolactotrophs that secrete both PRL and growth hormone and in some cases proliferate on estrogen treatment (7–9). However, the response of these cell lines has been variable, with some investigators reporting no effect or negative effects of estrogen on proliferation (9–12), whereas others reported estrogen-stimulated proliferation (13, 14).
In the above-mentioned research, replication was more sensitive than PRL synthesis to estrogen. GH4C1 pituitary tumor cell growth was 10-fold more sensitive to estrogen than PRL mRNA accumulation (14). GH3 cells showed maximum cell growth at 0.01 nM 17β-estradiol (E2), whereas only half-maximal PRL production occurred at the same concentration (13). These data, although interesting, did not lead to any additional studies.
We have studied the relationship between estrogen-induced cell proliferation and PRL expression by using a newly established pituitary cell line (PR1) from E2-treated F344 female rats (15). The cell growth response in this cell line is 1,000-fold more potent than the PRL response and only a small pool of estrogen receptor (ER) appears to be required for the growth response, suggesting that there is a dissociation between the regulation of growth and specific protein synthesis by estrogens.
MATERIALS AND METHODS
Cell Line and Culture Conditions.
The PR1 cell line was derived from a pituitary tumor of an F344, ovariectomized rat treated with E2 for 3 months (15). PR1 cells were maintained in phenol red-free, high-glucose DMEM (Sigma), supplemented with 0.37% sodium bicarbonate and 10% fetal bovine serum (FBS, HyClone). Culture medium was changed every 2 days until cells reached confluency. For treatment with steroids, cells were washed two times with PBS and incubated with DMEM with 3× dextran/charcoal-stripped FBS (DCC-FBS) (16) for 5–7 days. Thereafter, cells were treated in phenol red-free medium with 10% DCC-FBS with or without steroids.
Cell Proliferation Assay.
Cells (1,000–2,000) were loaded in 96-well plates with or without steroids. Cells were grown for 4 days with daily medium changes and 1 μCi of [3H]thymidine was added for another 24 hr. Plates were frozen and thawed three times, and DNA was precipitated by methanol and collected by using a PhD cell harvester (Cambridge Technology, Cambridge, MA). Radioactive thymidine incorporated into genomic DNA was measured by liquid scintillation counter. Alternatively, total genomic DNA was isolated from PR1 cells that were treated differently by using a Purgene DNA isolation kit (Gentra Systems, Minneapolis) according to the manufacturer’s protocol.
E2 Whole Cell Uptake Assay.
One to two million cells were incubated with increasing concentration of [3H]E2 (99.9 Ci/mmol; 1 Ci = 37 GBq) with or without 100× diethylstilbestrol (DES) for 1 hr at 37°C. Cells were harvested and washed two times with 0.1% BSA in phosphate saline (PBS) and three times with 0.1% methylcellulose in PBS. Washed cells were incubated with 100% ethanol for 30 min at room temperature with frequent vortexing. Aliquots of cell extract were measured in liquid scintillation counter. Kd values and Bmax were quantified by using the ebda software program (Biosoft, Milltown, NJ).
PRL Analysis.
PRL mRNA was measured by Northern blot analysis. Briefly, PR1 total RNA was isolated by using the guanidine thiocyanate-based Tri-reagent (Molecular Research Center, Cincinnati). Ten micrograms of total RNA was electrophoresed in 1% agarose–formaldehyde gels in MAE buffer (40 mM MOPS, pH 7.0/10 mM sodium acetate/1 mM EDTA). The gel was rinsed in 25 mM sodium phosphate (pH 6.5) to remove any remaining formaldehyde. The RNA was transferred to a Hybond N membrane (Amersham) by overnight capillary blotting in 10× SSC (1.5 M sodium chloride/0.15 M sodium citrate). The blot was washed briefly with 10× SSC and UV-crosslinked by using GS Gene Linker (Bio-Rad) and air-dried. PRL-1, a rat PRL cDNA clone in pBR322 was used to detect PRL mRNA (17). Twenty-five nanograms of 840-bp cDNA was labeled by using random primers with 32P-dATP (Prime-A-Gene kit, Promega). Rapid-hyb buffer (Amersham) was used for membrane hybridization of the probe according to the manufacturer’s protocol. Then blots were washed in 2× SSC/0.1% SDS at room temperature for 20 min and washed twice in 0.2× SSC/0.1% SDS at 65°C for 15 min each. The blots were exposed to film (XAR5, Kodak). CHOB, a cDNA of ribosomal protein S2, was used as a standard (18).
For PRL protein analysis, secreted PRL was prepared after stimulation with steroids by mixing equal amounts of culture medium with 2× SDS/PAGE sample buffer. This was analyzed by Western blot as described below. For the intracellular PRL analysis, protein samples were extracted from cells with RIPA buffer [1% Nonidet P-40/0.5% sodium deoxycholate/0.1% SDS in PBS with 10 mg/ml phenylmethylsulfonyl fluoride/100 μg/ml aprotinin/100 mM sodium orthovanadate]. Protein concentrations were determined by Bradford assay and equal amounts of proteins were separated by 10% SDS/PAGE (19). Proteins were transferred to polyvinylidene difluoride membrane (Immobilin, Millipore) and blocked overnight at 4°C in 10% skim milk in TBST buffer (10 mM Tris⋅HCl, pH 8.0/150 mM NaCl/0.1% Tween 20). Membranes were incubated with National Institute of Arthritis, Metabolism, and Digestive Disorders anti-rat PRL-S-8 antibodies diluted in 5% skim milk solution (TBST) for 2 hr at room temperature. After washing with TBST, peroxidase-linked secondary antibodies were added. Target protein bands were detected by an enhanced chemiluminescence Western blotting system (Amersham). Relative band densities were quantified by a Molecular Dynamics personal densitometer and imagequant software (Molecular Dynamics).
RESULTS
PR1 Proliferation Response on E2.
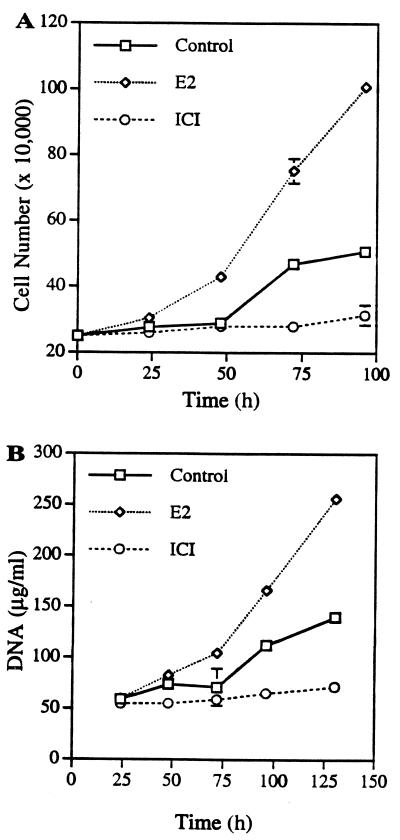
PR1 cells were derived from a pituitary of a female F344 rat treated for 3 months with E2. To determine whether these cells respond to estrogen, we treated the cells either with E2 or the pure antiestrogen, ICI 182,780 (ICI), and quantified cell numbers and DNA content at the designated time points (Fig. 1A). E2 (1 nM) induced increased cell proliferation as compared with the vehicle-treated control group. Cell numbers doubled after 50 hr of E2 treatment and proliferation reached 400% of original cell numbers 96 hr after treatment. The growth kinetics for the untreated controls suggest that this cell line maintained some level of growth, with a doubling time at around 96 hr, in medium containing stripped serum. The antiestrogen-treated group did not grow but maintained the original cell numbers during 4 days of incubation. Profound cell shrinkage in antiestrogen-treated cells suggests that possibly preliminary apoptotic events were induced by antiestrogen (data not shown). The increased cell number because of E2 treatment was confirmed with an increased amount of DNA (Fig. 1B). These data suggest that the PR1 cell line is E2 responsive but not E2 dependent for growth in our culture conditions.
Figure 1.
Growth response of PR1 cells to E2 and antiestrogen ICI. (A) Confluent PR1 cells were preincubated in DMEM-DCC-FBS medium for 5 days. Cells (250,000) were incubated either with 1 nM E2 or 1 nM ICI in 6-well plates. For the control group, vehicle solution (ethanol) was added. The medium was changed every day and cell numbers were counted by hemocytometer. (B) For DNA quantification, cells were lysed and genomic DNA was isolated by a Purgene genomic DNA isolation kit. Each point is the mean ± SD of triplicate samples.
E2 and ICI Dose Response to PR1 Cells.
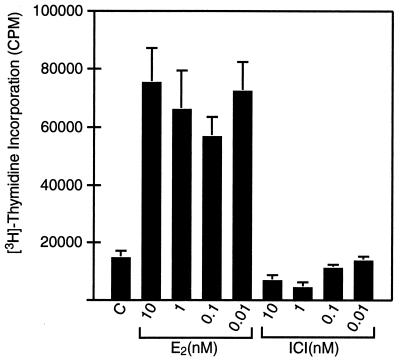
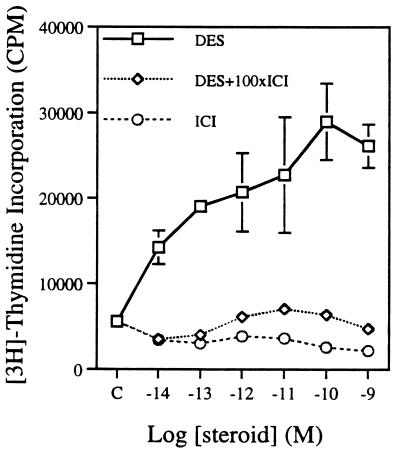
To quantify the responsiveness of these cells to estrogen, we determined the dose response to estrogens for two parameters: cell proliferation and PRL synthesis. We measured E2 and ICI dose responses on cell proliferation by using [3H]thymidine incorporation into DNA (Fig. 2). E2, at concentrations of 0.01–10 nM, induced a 3- to 4-fold increase in thymidine incorporation. Pure antiestrogen ICI treatment decreased thymidine incorporation at higher concentrations as compared with the control group. It is interesting to note that we could still see the maximal proliferation effect even at 0.01 nM. When the estrogen concentration was lowered to 10−14 M DES, half-maximal cell proliferation still occurred (Fig. 3). This DES-induced proliferation was blocked by 100-fold ICI, suggesting that the growth response is ER mediated. E2 treatment gave the same result (data not shown). For the ICI-treated groups, the higher concentrations were required to inhibit proliferation effectively. These data show that, unlike other estrogen-responsive tumor cell lines (MCF-7 human breast cell, GH3 rat pituitary somatolactotroph, and derivatives), the growth of PR1 cells is extremely sensitive to estrogen.
Figure 2.
E2 and ICI dose response of PR1 cell growth. PR1 cells were loaded as 1,000 cells per well in 96-well plates with or without varying steroid concentrations. Growth assay was performed as described. Each point is the mean ± SD of quadruplicate samples.
Figure 3.
DES, ICI, and DES + 100-fold ICI dose response of PR1 cell growth as described in Materials and Methods. Each point is the mean ± SD of quadruplicate samples.
ER Analysis.
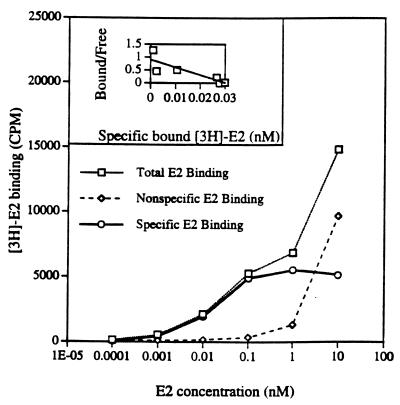
Because the PR1 cells respond to E2, we checked E2-binding affinity to PR1 cells by whole cell uptake assay. Cells were incubated with 1 nM of [3H]E2 ± 100-fold DES or ICI as competitors (Fig. 4). The dissociation constant (Kd) for E2 was 0.027 ± 0.007 nM, which is about 10- to 100-fold lower than the conventional E2 to ER Kd range in other estrogen-responsive cells. Scatchard analysis shows 33,948 ± 2,629 molecules of ER per cell.
Figure 4.
E2 binding in PR1 cells. Whole cell [3H]E2 uptake assay was performed. Cells were allowed to bind increasing concentrations of [3H]E2 or [3H]E2 + 100-fold excess of unlabeled DES. [3H]E2 counts were used as total binding and [3H]E2 + 100-fold DES counts were used as nonspecific binding. Specific binding was calculated by subtracting the nonspecific count from the total count. The binding data were run in the ebda program to calculate Kd and Bmax. The binding curve shows that specific binding was saturable, whereas total and nonspecific binding were not. (Inset) Scatchard plot. By using Bmax, the total number of ER in PR1 cells were calculated.
PRL Analysis.
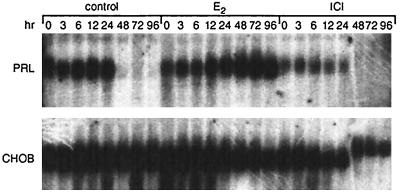
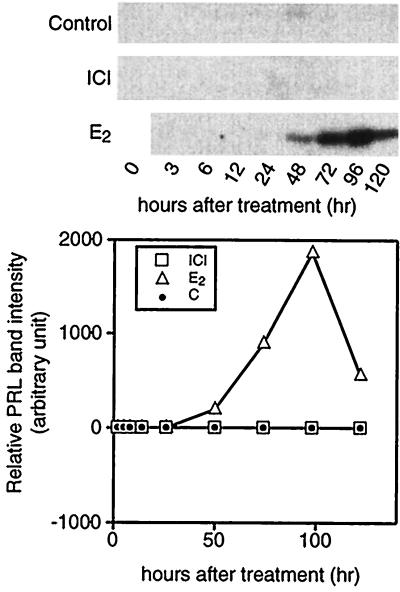
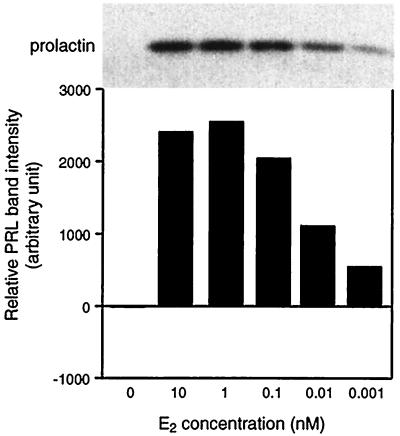
PRL mRNA, intracellular PRL, and secreted PRL forms were analyzed in PR1 cells upon estrogen treatment. We checked PRL mRNA by Northern blot analysis (Fig. 5). Control cells, preincubated in DCC-stripped medium, showed a basal level of PRL RNA that could still be detected after a further 24 hr of incubation. For the control and ICI-treated groups, the mRNA signals were markedly reduced after 48 hr of incubation. In the E2-treated group, the amount of PRL mRNA increased between 24 and 48 hr and reached maximum level at 72 hr of treatment. We also assessed PRL expression by measuring intracellular PRL content by using Western blot analysis (Fig. 6). We could not detect any PRL signal in either control or 1 nM ICI-treated cells during the experimental period. However, in 1 nM E2-treated cells, we detected a PRL signal as early as 48 hr after incubation and saw maximum expression at 72 hr. We next analyzed the E2 dose response on PRL synthesis in PR1 cells (Fig. 7). E2 at a concentration of 1 nM gave a maximal response and half-maximal induction was about 0.01 nM, suggesting that the PRL response is less sensitive to E2 as compared with the proliferation response.
Figure 5.
Time course of PRL mRNA accumulation in PR1 cells cultured under different conditions. On the indicated day the cells were harvested and total RNA was prepared for PRL Northern blot analysis as described. One nanomole of E2 or ICI was used for treatment. CHOB, a cDNA of ribosomal protein S2, was used as a loading control.
Figure 6.
Time course of intracellular PRL accumulation in PR1 cells cultured under different conditions. On the indicated day the cells were harvested and proteins were extracted by RIPA buffer as described. Equal amounts of protein were loaded in SDS/10% PAGE and Western blot analysis was performed to detect PRL bands. Each band was quantitated by densitometer. One nanomole of E2 or ICI was used.
Figure 7.
E2 dose response of intracellular PRL expression. Western blot analysis was performed as described in Fig. 6.
Effects of Other Steroids on PR1 Cells.
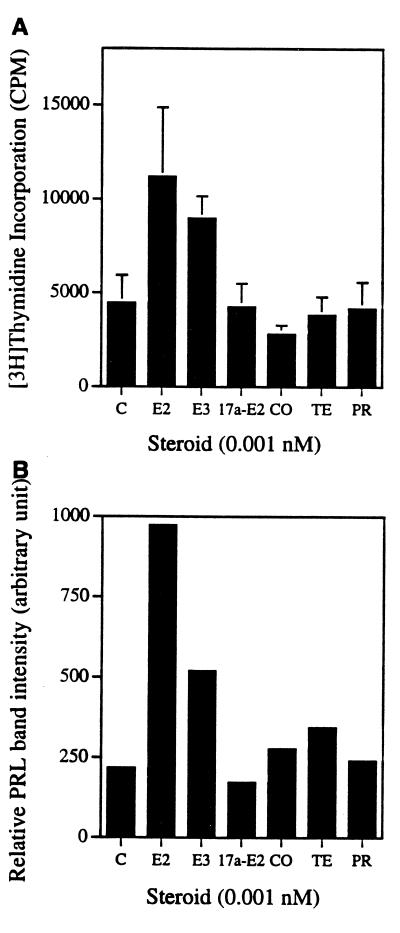
E2 derivatives and several other steroids have lower affinities for ER-α (20). We checked the activities of other steroids for their effects on PRL and proliferation in PR1 cells (Fig. 8). Compared with E2, 17α-E2, cortisol, testosterone, and progesterone could not induce cell proliferations at 0.001 nM. However, estriol induced 2-fold thymidine incorporation at that concentration. Western blot analysis of secreted PRL in the medium showed that E2 was the most potent steroid in inducing PRL synthesis. Estriol also induced PRL, but it was not as potent as E2, nor were other steroids as effective as E2 in inducing PRL. At the higher concentration of 0.1 nM, we saw a modest increase in thymidine incorporation and PRL secretion with the above steroids, but the relative potency was still the same as in 0.001 nM E2-treated cells (data not shown).
Figure 8.
Effect of other steroids on PR1 cell proliferation and PRL secretion. E2, estriol (E3), 17α-estradiol (17a-E2), cortisol (CO), testosterone (TE), and progesterone (PR) activities were measured at 0.001 nM for (A) cell proliferation induction (mean ± SD of quadruplicate samples) and (B) PRL secretion.
Differential Effects of Estrogen on PRL Expression and Cell Proliferation.
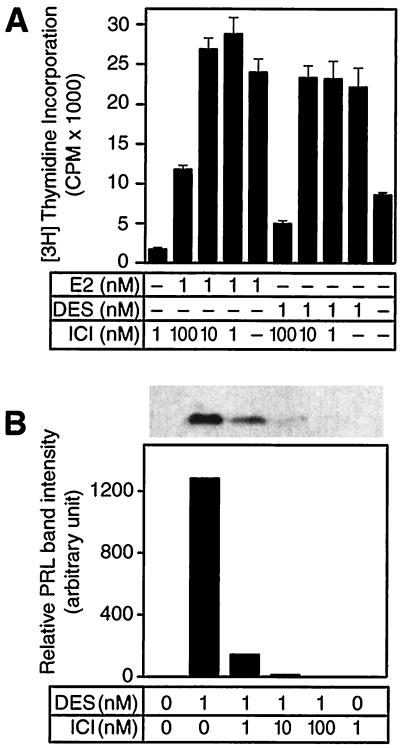
Because we saw that cell proliferation was more sensitive than PRL production to E2 in PR1 cells, we directly compared these two responses by inhibiting estrogen activity with increasing amounts of ICI (Fig. 9). Treating cells with either 1 nM of DES or E2 induced cell proliferation. Incubating cells with equimolar estrogen and ICI or 10-fold more ICI still maintained full proliferation induced by E2 or DES alone. However, DES or E2 with 100-fold ICI decreased the proliferation to near the control group. Unlike the proliferation responses, the PRL response was more sensitive. Equimolar DES and ICI decreased the secreted PRL to 10% of the group that was treated with DES alone. Ten-fold more ICI decreased PRL secretion to 1%. In a 1:100 coincubation, we could not detect any PRL signal on the blot. E2 treatment gave the same results as the DES treatment (data not shown).
Figure 9.
Differential effects of estrogen on PRL expression and cell proliferation. PR1 cells were incubated with either 1 nM of E2 or DES alone, or with 1-, 10-, or 100-fold more ICI. (A) [3H]Thymidine incorporation (mean ± SD of quadruplicate samples) and (B) secreted PRL were analyzed. Solid line, no addition. One representative data of three.
DISCUSSION
PR1 cells are a lactotroph cell line established from E2-induced F344 rat pituitary tumors (15). The proliferation response of these cells is hypersensitive to estrogen (EC50 = 10−14 M) and is 1,000-fold more sensitive to estrogen than PRL production (EC50 = 10−11 M). The distinction between cell proliferation and PRL production responses in PR1 cells is highlighted by the observation that 10 nM (10-fold) ICI could not inhibit 1 nM of E2-induced cell proliferation, whereas the same concentration of ICI decreased PRL production to 1% of the E2-induced group. Considering the Kd for ER in these cells, which is approximately 3 × 10⁻¹¹ M, only about 0.1% receptor occupancy is required for half-maximal proliferation induction (10−14 M). This means that only about 30 of the 30,000 receptors in a cell need to be occupied for a proliferation response (Table 1). In contrast, PRL gene expression requires about 15,000 occupied receptors for a half-maximal response. These data raise interesting questions about the mechanisms of steroid receptor action. Why are 15,000 estrogen-occupied receptors needed per cell to turn on the expression of the single copy PRL gene when only 30 occupied receptors are required to turn on a complex process like cell replication? Most ER models assume a receptor dimer and recent crystallography data support that notion (21). The probability of both members of a dimer pair being occupied by E2 when cells are incubated with 10−12 M E2 and total receptor occupancy is ≈10% is only 1%. An increase in occupied dimers would require cooperative binding, which has not been observed in the binding of estrogen to intact cells. Furthermore, if a high concentration of ICI is included in the medium and occupies most of the ER, the bound E2 in most cases would have to be associated with a dimer pair in which one of the pair is occupied with ICI. The recent crystallography data show that the folding of the steroid-binding domain is different when occupied by an antiestrogen versus an estrogen (21). How a hybrid dimer having one of each type of structure would function is a question of great interest.
Table 1.
Estrogen response numbers
| E2, M | Receptors, n
|
|||
|---|---|---|---|---|
| 10−9 | 10−11 | 10−12 | 10−14 | |
| E2-occupied ER/cell | 30,000 | 15,000 | 3,000 | 30 |
| PRL synthesis, % | 100 | 50 | 10 | 0 |
| Growth, % | 100 | 100 | 90 | 50 |
The total number of ER/PR1 cell is ≈30,000.
Two possible explanations for our observations are (i) ER interacts with a nuclear factor that is critical for replication at a much higher affinity than its affinity for factors affecting PRL gene expression, or (ii) a small pool of ER exists that differs in some way from the bulk of the ER. In recent years, there have been a number of reports of ER interacting with nuclear transcription factors. Although little quantitative data have been reported, most of these interactions do not appear to be high enough to explain the replication data, but could account for the PRL gene expression data. However, a small number of molecules with a high affinity for the ER would be difficult to detect with current techniques. Similarly, different DNA sequences have differing affinities for the ER, but nothing having an extremely higher affinity than the vitellogenin estrogen response element’s Kd of 0.1 nM has been reported (22, 23). The possibility of a small pool of ER is attractive, but the pool of ER associated with growth hypersensitivity shows all the characteristics of the normal ER in its response to estrogens, antiestrogens, and other steroid hormones. However, this ER population could represent a minor pool of modified ER or even a novel gene product. It could also be a pool of receptors that is localized to a particular site in the genome that in some way confers an advantage in regulating growth. Recently, ER-β was cloned from rat prostate (24). The physiological importance of ER-β is not clear; however, its relative affinity for estrogens is similar to ER-α. Reverse transcriptase-PCR analysis in pituitary tissue showed that ER-α is the predominant ER, not ER-β. Other ER isoforms, which have amino-terminus truncation (TERP), have been discovered and characterized from female rat pituitary (25). TERP shows tissue- and sex-specific expression and enhanced estrogen-induced transcription when transiently cotransfected with wild-type ER into an ER-negative cell line (39). TERP’s transcriptional activity depends on promoter or cell context and this ER isoform did not show a significant effect on PRL gene expression when transfected into GH3 cells (40), which raises the possibility that this ER isoform might be a candidate responsible for the regulation of hypersensitive growth in PR1 cells.
The hypersensitivity of PR1 cells to estrogen may be due, in part, to the 10–100 times higher affinity binding of estrogen to ER (Kd ≈ 3 × 10⁻¹¹ M) observed in PR1 cells. However, the differential effects between growth and PRL responses still represent a 1,000-fold difference. In vitro studies of estrogen responsiveness in rat pituitary cells suggest that the growth response is not necessary for estrogen-induced PRL gene expression (14, 26). Earlier studies with GH3 cell lines showed varying growth responses to estrogen. Amara and Dannies (13) reported 1–3 × 10⁻¹¹ M E2-induced maximum growth for GH3 cells, whereas higher concentrations decreased cell growth from the maximum. Other investigators showed no effect or decreased GH cell proliferation when E2 was added to differentially defined culture media (9–12). We did not see any biphasic effects of E2 in our PR1 cell culture system and we did see a consistent hypersensitivity of PR1 cell replication to E2. The differential regulation of E2 responsiveness is not unique to pituitary cells. Breast cancer cells proliferate and express progesterone receptor upon E2 stimulation (27–29). However, in MDA-MB-134 human breast cancer cells, progesterone receptor level does not increase upon E2 stimulation while they proliferate (30). Tissue-specific differences of E2 response are also shown in the immediate early gene, c-fos expression regulation. Uterine c-fos induction by estrogen is rapid followed by a rapid decline (31); however, in anterior pituitary, the induction is delayed and sustained (32). All these reports and our observation in PR1 cells suggest that differential response to E2 might be due to factors downstream of ER. They could be coactivators, repressors, an estrogen-responsive element sequence, or affinity of ER to the estrogen-response element of the target gene. Alternatively, in the PR1 system, autocrine/paracrine factors and the regulation of their receptors may be the factor for dissociation of cell growth and PRL gene expression (15, 33–35).
Long-term culture in low estrogen culture conditions has been shown to modulate MCF-7 cell growth responses (36, 37). In one report, MCF-7 cells grown in medium with stripped serum for 1–6 months were induced to maximal cell proliferation with as little as 10−15 M E2 (37). Normally, culture medium with 10% serum contains approximately 20 pM E2 (38). Because our culture conditions for maintaining PR1 cells include phenol red-free medium with 10% serum, and incubating cells for 5–7 days in DCC-serum medium, it is unlikely that our culture conditions induce growth hypersensitivity. Also, the PRL response to E2 is similar to previous reports from our lab and other groups (10, 14), where the EC50 was 0.01–0.1 nM. The progressive loss of PRL mRNA in medium with stripped serum is also consistent with previous reports.
In summary, the new pituitary lactotroph cell line, PR1, is differentially responsive to estrogen in terms of growth and PRL gene expression. This cell line provides an excellent in vitro system for analyzing the dichotomy of ER-mediated responses and for testing the activities of various estrogenic compounds present in small amounts in the environment.
Acknowledgments
We thank Kathryn Holtgraver for editorial assistance in preparing the manuscript. This work was supported in part by the College of Agricultural and Life Sciences, University of Wisconsin–Madison and by National Cancer Institute Grants CA58013 and CA71911 awarded to J.G.
ABBREVIATIONS
- ER
estrogen receptor
- PRL
prolactin
- F344
Fischer 344
- E2
17β-estradiol
- FBS
fetal bovine serum
- DES
diethylstilbestrol
- ICI
ICI 182,780
References
- 1.Wiklund J, Gorski J. Endocrinology. 1982;111:1140–1149. doi: 10.1210/endo-111-4-1140. [DOI] [PubMed] [Google Scholar]
- 2.Lloyd R. Am J Pathol. 1983;113:198–206. [PMC free article] [PubMed] [Google Scholar]
- 3.Lloyd R V, Liotta L A. J Natl Cancer Inst. 1987;79:865–873. [PubMed] [Google Scholar]
- 4.Tashjian J A H, Yasumura Y, Levine L, Sato G, Parker M L. Endocrinology. 1968;82:342–352. doi: 10.1210/endo-82-2-342. [DOI] [PubMed] [Google Scholar]
- 5.Martin T J F, Tashjian J A H. Biochem Acta Horm. 1977;4:269–312. [Google Scholar]
- 6.Tashjian J A H, Hinkle P M, Dannies P S. In: Endocrinology. Scow R O, editor. Amsterdam: Excerpta Medica; 1979. pp. 648–665. [Google Scholar]
- 7.Haug E, Gautvik K M. Endocrinology. 1976;99:1482–1489. doi: 10.1210/endo-99-6-1482. [DOI] [PubMed] [Google Scholar]
- 8.Scammell J G, Burrage T G, Dannies P S. Endocrinology. 1986;119:1543–1548. doi: 10.1210/endo-119-4-1543. [DOI] [PubMed] [Google Scholar]
- 9.Kiino D R, Dannies P S. Endocrinology. 1981;109:1264–1269. doi: 10.1210/endo-109-4-1264. [DOI] [PubMed] [Google Scholar]
- 10.Rhode P, Gorski J. Mol Cell Endocrinol. 1991;82:1–9. doi: 10.1016/0303-7207(91)90003-b. [DOI] [PubMed] [Google Scholar]
- 11.deCarvalh-Brunet N, Picant R, Tixier-Vidal A. Mol Cell Endocrinol. 1985;39:49–60. doi: 10.1016/0303-7207(85)90091-7. [DOI] [PubMed] [Google Scholar]
- 12.Brunet N, Gourdsi D, Tixier-Vidal H. Mol Cell Endocrinol. 1980;18:123–136. doi: 10.1016/0303-7207(80)90087-8. [DOI] [PubMed] [Google Scholar]
- 13.Amara J, Dannies P. Endocrinology. 1983;112:1141–1143. doi: 10.1210/endo-112-3-1141. [DOI] [PubMed] [Google Scholar]
- 14.Amara J, Itallie C, Dannies P. Endocrinology. 1987;120:264–271. doi: 10.1210/endo-120-1-264. [DOI] [PubMed] [Google Scholar]
- 15.Pastorcic M, De A, Boyadjieva N, Vale W, Sarkar D K. Cancer Res. 1995;55:4892–4898. [PubMed] [Google Scholar]
- 16.Horwitz K B, Costlow M E, McGuire W L. Steroids. 1976;26:785–795. doi: 10.1016/0039-128x(75)90110-5. [DOI] [PubMed] [Google Scholar]
- 17.Gubbins E J, Maurer R A, Hartley J L, Donelson J E. Nucleic Acids Res. 1979;6:915–930. doi: 10.1093/nar/6.3.915. [DOI] [PMC free article] [PubMed] [Google Scholar]
- 18.Harpold M, Evans R, Salditt-Georigieff M, Darnell J. Cell. 1979;17:1025–1035. doi: 10.1016/0092-8674(79)90341-6. [DOI] [PubMed] [Google Scholar]
- 19.Laemmli U. Nature (London) 1970;227:680–685. doi: 10.1038/227680a0. [DOI] [PubMed] [Google Scholar]
- 20.Kuiper G G J M, Carlsson B, Grandien K, Enmark E, Häggblad J, Nilsson S, Gustafsson J-Å. Endocrinology. 1997;138:863–870. doi: 10.1210/endo.138.3.4979. [DOI] [PubMed] [Google Scholar]
- 21.Brzozowski A M, Pike A C W, Dauter Z, Hubbard R E, Bonn T, Engström O, Öhman L, Greene G L, Gustafsson J-Å, Carlquist M. Nature (London) 1997;389:753–758. doi: 10.1038/39645. [DOI] [PubMed] [Google Scholar]
- 22.Murdoch F E, Grunwald K A A, Gorski J. Biochemistry. 1991;30:10838–10844. doi: 10.1021/bi00109a005. [DOI] [PubMed] [Google Scholar]
- 23.Furlow D J, Murdoch F E, Gorski J. J Biol Chem. 1993;268:12519–12525. [PubMed] [Google Scholar]
- 24.Kuiper G, Carlsson B, Grandien K, Enmark E, Haggblad J, Nilsson S, Gustafsson J. Endocrinology. 1997;138:863–870. doi: 10.1210/endo.138.3.4979. [DOI] [PubMed] [Google Scholar]
- 25.Friend K, Ang L, Shupnik M. Proc Natl Acad Sci USA. 1995;92:4367–4371. doi: 10.1073/pnas.92.10.4367. [DOI] [PMC free article] [PubMed] [Google Scholar]
- 26.Lieberman M E, Maurer J A, Claude P, Gorski J. Mol Cell Endocrinol. 1982;25:277–294. doi: 10.1016/0303-7207(82)90084-3. [DOI] [PubMed] [Google Scholar]
- 27.Eckert R L, Katzenellenbogen B S. Cancer Res. 1982;42:139–144. [PubMed] [Google Scholar]
- 28.Horwitz K B, McGuire W L. J Biol Chem. 1978;253:2223–2228. [PubMed] [Google Scholar]
- 29.Horwitz K B, Koseki Y, McGuire W L. Endocrinology. 1978;103:1742–1751. doi: 10.1210/endo-103-5-1742. [DOI] [PubMed] [Google Scholar]
- 30.Reiner G C A, Katzenellenbogen B S. Cancer Res. 1986;46:1124–1131. [PubMed] [Google Scholar]
- 31.Nephew K P, Peters G A, Khan S. Endocrinology. 1995;136:3007–3015. doi: 10.1210/endo.136.7.7789326. [DOI] [PubMed] [Google Scholar]
- 32.Allen D L, Mitchner N A, Uveges T E, Nephew K P, Khan S, Ben-Jonathan N. Endocrinology. 1997;138:2128–2135. doi: 10.1210/endo.138.5.5101. [DOI] [PubMed] [Google Scholar]
- 33.Sarkar D K, Kim K H, Minami S. Mol Endocrinol. 1992;6:1825–1833. doi: 10.1210/mend.6.11.1480172. [DOI] [PubMed] [Google Scholar]
- 34.De A, Morgan T E, Speth R C, Boyadjieva N, Sarkar D K. J Endocrinol. 1996;149:19–27. doi: 10.1677/joe.0.1490019. [DOI] [PubMed] [Google Scholar]
- 35.Mouihate A, Lestage J. J Endocrinol. 1995;146:495–500. doi: 10.1677/joe.0.1460495. [DOI] [PubMed] [Google Scholar]
- 36.Welshons W, Jordan C. Eur J Cancer Clin Oncol. 1987;23:1935–1939. doi: 10.1016/0277-5379(87)90062-9. [DOI] [PubMed] [Google Scholar]
- 37.Masamura S, Santner S, Heitjan D, Santen R. J Clin Endocrinol Metab. 1995;80:2918–2925. doi: 10.1210/jcem.80.10.7559875. [DOI] [PubMed] [Google Scholar]
- 38.Bindal R D, Carlson K E, Katzenellenbogen B S, Katzenellenbogen J A. J Steroid Biochem. 1988;31:287–294. doi: 10.1016/0022-4731(88)90352-4. [DOI] [PubMed] [Google Scholar]
- 39.Schreihofer D A, Pace C, Friend K E, Shupnik M A. The Program of the 10th International Congress of Endocrinology. II. Bethesda, MD: The Endocrine Society Press; 1996. p. 720. [Google Scholar]
- 40.Schreihofer D A, Shupnik M A. The Program of the 79th Annual Meeting of The Endocrine Society. Bethesda, MD: The Endocrine Society Press; 1997. p. 542. [Google Scholar]


