

Abstract
Mutations in BLM cause Bloom's syndrome, a disorder associated with cancer predisposition and chromosomal instability. We investigated whether BLM plays a role in ensuring the faithful chromosome segregation in human cells. We show that BLM-defective cells display a higher frequency of anaphase bridges and lagging chromatin than do isogenic corrected derivatives that eptopically express the BLM protein. In normal cells undergoing mitosis, BLM protein localizes to anaphase bridges, where it colocalizes with its cellular partners, topoisomerase IIIα and hRMI1 (BLAP75). Using BLM staining as a marker, we have identified a class of ultrafine DNA bridges in anaphase that are surprisingly prevalent in the anaphase population of normal human cells. These so-called BLM–DNA bridges, which also stain for the PICH protein, frequently link centromeric loci, and are present at an elevated frequency in cells lacking BLM. On the basis of these results, we propose that sister-chromatid disjunction is often incomplete in human cells even after the onset of anaphase. We present a model for the action of BLM in ensuring complete sister chromatid decatenation in anaphase.
Keywords: anaphase bridges, Bloom's syndrome, centromeres, chromosome segregation, PICH helicase
Introduction
Bloom's syndrome (BS) is a rare genetic disorder characterized by proportional dwarfism, sunlight hypersensitivity, fertility defects and a predisposition to the development of most types of cancer (German, 1993; Hickson, 2003). At the cellular level, BS is associated with inherent genomic instability, including an elevated frequency of chromosome aberrations (Chaganti et al, 1974; German, 1993). The hallmark feature, which is used in the molecular diagnosis of BS, is an approximately 10-fold increase in the incidence of sister-chromatid exchanges (SCEs) (Chaganti et al, 1974). It is thought that SCEs arise during the S/G2 phases of the cell cycle as a consequence of crossing-over during homologous recombination-mediated repair events, such as those acting at sites of collapsed or disrupted DNA replication forks (Wu and Hickson, 2006).
The BS gene, BLM, encodes a member of the RecQ helicase family, which is highly conserved in evolution (Ellis et al, 1995). BLM forms a complex with topoisomerase IIIα (Johnson et al, 2000; Wu et al, 2000) and hRMI1 (BLAP75) (Meetei et al, 2003; Yin et al, 2005) and, together, they catalyze a process termed double Holliday junction dissolution, which serves as an alternative pathway to classical Holliday junction resolution for effecting the termination phase of homologous recombination reactions (Wu and Hickson, 2003; Raynard et al, 2006; Wu et al, 2006). The cooperation of a RecQ helicase, topoisomerase III and an RMI1 homolog during the maintenance of genome stability is conserved in many organisms, including the widely studied yeasts, Saccharomyces cerevisiae (Sgs1, Top3 and Rmi1 proteins) and Schizosaccharomyces pombe (Rqh1, Top3 and Rmi1 proteins) (Stewart et al, 1997; Goodwin et al, 1999; Maftahi et al, 1999; Chang et al, 2005; Mullen et al, 2005). Although not proven formally, it remains a possibility that the BLM-topoisomerase IIIα-hRMI1 complex might also act on replication intermediates that are structurally similar to double Holliday junctions, such as those that arise at sites of converging replication forks (Branzei et al, 2006; Cobb and Bjergbaek, 2006; Wu and Hickson, 2006).
A predicted consequence of a failure to eliminate recombination and/or replication intermediates during or soon after S-phase is an inability to undergo sister-chromatid disjunction during mitosis. Indeed, it is well established that sgs1, rqh1 and top3 mutant cells display defects in chromosome segregation, even during an apparently unperturbed cell cycle (Watt et al, 1995; Stewart et al, 1997; Goodwin et al, 1999; Maftahi et al, 1999; Kaliraman and Brill, 2002; Win et al, 2005). This is seen most strikingly in S. pombe top3 strains, which are nonviable in long-term culture due to chromosome missegregation and exhibit the so-called ‘cut' phenotype, where the septum bisects condensed chromosomes that are incompletely separated (Goodwin et al, 1999; Maftahi et al, 1999). A similar, but less severe, phenotype is seen in S. pombe rqh1 mutants (Win et al, 2005). Although there is no precise equivalent of the ‘cut' phenotype in mammalian cells, there are well-established cytological markers of chromosome missegregation. For example, anaphase bridges, which represent incompletely segregated chromosomal DNA connecting the daughter nuclei, have been well documented previously and are a feature of solid tumors in vivo (Gisselsson et al, 2000). It is unclear how anaphase bridges are resolved, but it is likely that they can be fragmented during furrow ingression in cytokinesis if they are not resolved before or during anaphase. It is thought that anaphase bridges can lead to the generation of micronuclei as a consequence of the breakage of the bridge by mitotic spindle forces (Hoffelder et al, 2004). Anaphase bridges and micronuclei may actually contribute to tumor progression via the creation of gene dosage imbalances. It has been shown previously that micronuclei are present at an elevated frequency in BS cells, which might have significance for the tumor suppressor role of BLM (Rosin and German, 1985).
We set out to test the hypothesis that one consequence of BLM deficiency might be a failure to undergo faithful chromosome segregation at mitosis. We show that BLM is required for the suppression of anaphase bridging, and that BLM localizes to chromosomal bridges in anaphase. As a result of an ability to detect BLM on anaphase bridges, we were able to identify a class of DNA bridge structure that is not detectable using conventional DNA dyes. These ultrafine bridges are found in a significant proportion of normal anaphase cells, and are present at an elevated frequency in BS cells. We discuss these results in the context of our current knowledge of the role of chromosome segregation defects in tumor development.
Results
BLM suppresses the accumulation of anaphase bridges and lagging chromatin
To analyze chromosome segregation in BS cells, we utilized an isogenic pair of GM08505-derived BS cell lines, designated PSNG13 and PSNF5, which differ only in that PSNF5 cells constitutively express BLM protein (see Materials and methods). Our previous studies have indicated that ectopic expression of BLM in GM08505 cells reduces the frequency of SCEs to near wild-type levels, indicative of functional correction of the BS phenotype (Gaymes et al, 2002; Davies et al, 2004). Initially, we quantified the frequency of two widely studied cytogenetic indicators of defective sister chromatid separation in mitosis; anaphase bridges and lagging chromatin (Gisselsson et al, 2000; Saunders et al, 2000; Stewenius et al, 2005). In a sample of more than 600 anaphase cells from each of the PSNG13 (BLM−) and PSNF5 (BLM+) isogenic cell pair, we found a significantly higher frequency of both anaphase bridges and lagging chromatin in the PSNG13 cells than in PSNF5 cells (Figure 1A). Representative images of the segregation defects observed in PSNG13 cells are shown in Figure 1B. These results indicate that loss of BLM function leads to an impairment in chromosome segregation during mitosis.
Figure 1.
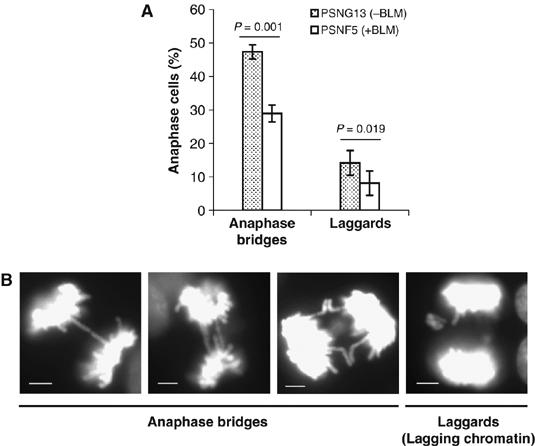
BS cells exhibit chromosome missegregation. (A) Percentage of anaphases from PSNF5 (+BLM) and PSNG13 (vector alone) cells that display anaphase bridges or lagging chromosomes. Determinations were performed in triplicate (n⩾600 anaphase cells in each case) and error bars represent standard deviations from the mean. Significance was calculated by using a two-tailed student t-test. (B) Representative images of DAPI-stained PSNG13 cells showing examples of anaphase bridges and lagging chromosomes, as indicated below the images. Scale bars, 5 μm.
The BLM protein localizes to anaphase bridges
Based on the above data, we analyzed the subcellular localization of BLM in the SV40-transformed human fibroblast cell line, GM00637, which was isolated from a normal individual. As reported previously (Zhong et al, 1999; Johnson et al, 2000; Sanz et al, 2000; Yankiwski et al, 2000), we found that BLM typically localizes to discrete foci in interphase cells that colocalize with PML nuclear bodies (data not shown). However, these BLM foci largely disappear from cells undergoing mitosis. Instead, we observed some general diffuse BLM staining in all anaphase samples, as well as striking localization of BLM to sites that were coincident with DAPI-stained anaphase bridges (Figure 2A). The BLM staining did not always decorate the entire bridge and generally appeared as a finer structure than the DAPI-stained bridge itself. This localization of BLM to anaphase bridges was not a rare occurrence, as >95% of anaphase cells that exhibited an anaphase bridge (n=33) displayed BLM staining that was coincident with the bridge structure. On occasions, BLM staining was focal in nature and appeared on the tips of chromatin that lay between the two separating masses of DNA (Figure 2B). In other cases, BLM staining formed a short connecting bridge that linked either the tips or the arms of lagging chromatin (Figure 2C).
Figure 2.
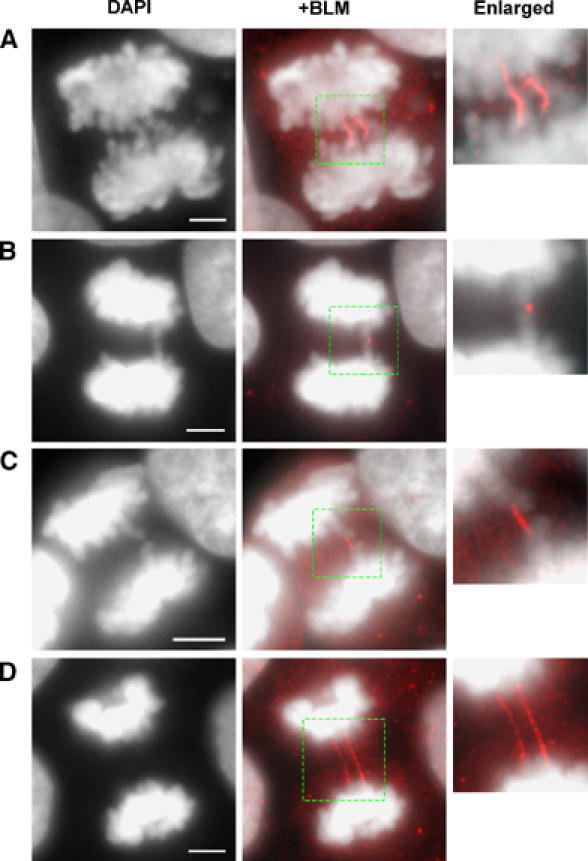
BLM localizes to anaphase bridges. Representative immunofluorescence images using the anti-BLM antibody (C-18) showing the localization of BLM to anaphase bridges in the SV40-transformed human fibroblast cell line, GM00637. In each case, the boxed region is enlarged on the right. BLM localizes to DAPI-stained chromosomal bridges (A), as a focus on the tips of two dense chromatin regions (B), as a short connecting bridge from the arms of two dense chromatin regions (C) and on bridges that are undetectable by DAPI staining (D). Scale bars, 5 μm.
Of particular interest, we also found that BLM localized to ultrafine bridge-like structures that connected the daughter nuclei of many cells. These ultrafine bridges could be detected in apparently normal anaphase cells that lacked the presence of any obvious DAPI-stained anaphase bridge (Figure 2D). The failure to detect these ultrafine bridges with DNA dyes was not simply because of our use of DAPI, as they were also undetectable using Hoechst-33258, YOYO-1 and TO-PRO3 (data not shown and see Figure 3 (below)). To distinguish between the conventional DAPI-positive anaphase bridges and the ultrafine DAPI-negative bridges, we will henceforth refer to the former as chromosomal bridges and the latter as BLM–DNA bridges. Where used, the term anaphase bridge will be limited to those cases where a generic reference is made to both classes of DNA bridge observed in anaphase cells. Two different antisera targeting either the C-terminal domain (C-18) or the N-terminal domain (IHIC34) of BLM were used in these immunofluorescence studies, and each gave an essentially identical staining pattern (Supplementary Figure 1A–E). In addition to observing BLM–DNA bridges directly linking the segregating daughter nuclei, we also detected such bridges connecting lagging chromatin to the segregating DNA (Supplementary Figure 1B). The localization of BLM to chromosomal bridges and BLM–DNA bridges was evident not only in GM00637 cells, but also in the SV40-transformed human fibroblast line, WI38/VA13, in the hTERT-immortalized foreskin fibroblast line, HS68, in the untransformed normal human fibroblast, MRC5 and in the HeLa cervical carcinoma cell line (Supplementary Figure 1A–E and see Supplementary Figure 7 below).
Figure 3.
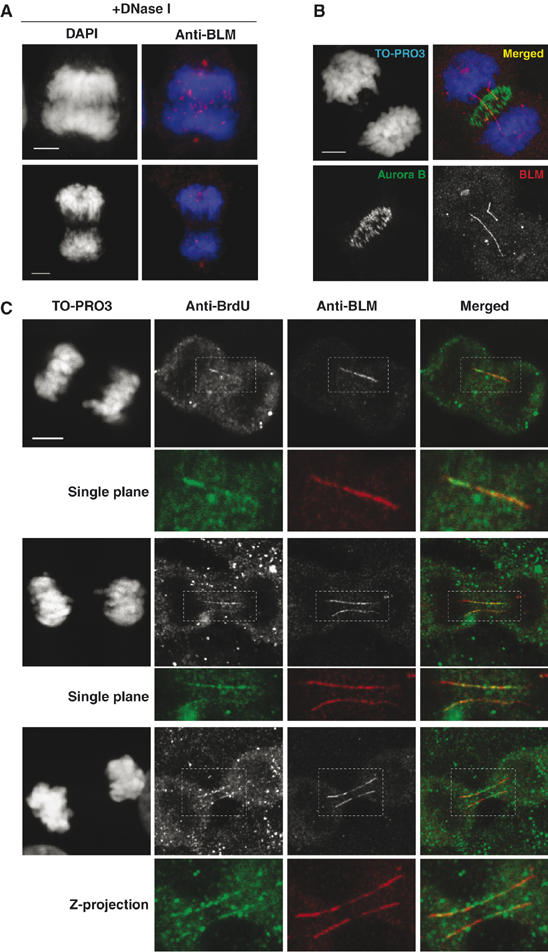
BLM–DNA bridges are composed of DNA and do not represent a cytoskeletal structure. (A) Representative images of anaphases in which the samples were treated with DNase I before microscopy. Note the absence of BLM staining on any bridge structure. (B) Z-projection of eight stacking confocal images showing the lack of colocalization of BLM (red) to the mitotic midzone, as revealed by staining for Aurora B (green). (C) Representative confocal microscopy images of late anaphase GM00637 cells showing TO-PRO3-negative, BLM–DNA bridges (red) that colocalize with staining for BrdU (green). The top and middle examples are images from a single optical plane, whereas the bottom example indicates a Z-projection of six sequential confocal stacks with a 0.3 μm interval. Scale bars, 5 μm.
To eliminate the possibility that the staining pattern observed with the anti-BLM antibodies was an artefact of the immunofluorescence procedure, we also analyzed the localization of BLM directly using a derivative (PG3.1) of the GM08505 BS cell line stably expressing YFP-tagged BLM protein. Consistent with the immunofluorescence data described above, YFP-BLM also localized to both chromosomal bridges and the ultrafine BLM–DNA bridges (Supplementary Figure 1f and data not shown). These data indicate that the localization of BLM to chromosomal bridges and BLM–DNA bridges is neither cell line dependent nor an artefact due to lack of antibody specificity.
Next, we set out to confirm that the ultrafine BLM–DNA bridges actually contained DNA, as they were not detectable by staining with widely used DNA dyes. As an initial test, we analyzed whether the bridges were sensitive or resistant to treatment by DNase I or RNase A. We found that the frequency of BLM–DNA bridge staining declined significantly (∼50%) after a short treatment (7 min) with a concentration of DNase I (10 mg/ml) that preserved overall chromatin architecture (Figure 3A), consistent with the bridges being composed of DNA. In contrast, RNase had no apparent effect (data not shown). We also confirmed that the BLM–DNA bridges did not colocalize with established mitotic cytoskeletal structures as revealed by staining for either β-tubulin or Aurora B (data not shown and Figure 3B). To increase the sensitivity of DNA detection, we grew GM00637 cells in the presence of bromo-deoxyuridine (BrdU) and then stained anaphase cells using an anti-BrdU antibody, following partial heat denaturation of the DNA to reveal ssDNA regions that are detectable using this antibody (Van Furth and Van Zwet, 1988). This treatment protocol was used because it involves only partial denaturation and is not sufficiently harsh to reveal BrdU epitopes in the condensed chromatin. We then analyzed the colocalization of BrdU and BLM in anaphase cells that did not contain any bridge that could be detected with DAPI or TO-PRO3. As shown in Figure 3C, colocalization of BrdU and BLM was readily detected on such BLM–DNA bridges. This confirms that these bridges represent DNA structures.
The BLM/topoisomerase IIIα/hRMI1 protein complex binds to the ultrafine BLM–DNA bridges in normal anaphase cells
BLM has been shown to bind directly or indirectly to a variety of proteins in human cells (Wu and Hickson, 2006). Of particular significance is the formation of a complex between BLM and two evolutionarily conserved partners, topoisomerase IIIα and hRMI1 (Johnson et al, 2000; Wu et al, 2000; Meetei et al, 2003; Yin et al, 2005). We analyzed, therefore, whether topoisomerase IIIα and/or hRMI1 localize to anaphase bridges alongside BLM in human fibroblasts. As shown in Figures 4A and B, topoisomerase IIIα and hRMI1 also localized to anaphase bridges in GM00637 cells and showed a staining pattern in anaphase cells indistinguishable from that of BLM. This colocalization of topoisomerase IIIα and hRMI1 with BLM was detected on both chromosomal bridges and the BLM–DNA bridges. In contrast, we were not able to detect other BLM-binding factors on either form of anaphase bridge using the antisera described in the Materials and methods. No bridge staining was seen for the WRN, PML, RAD51, BRCA1, NBS1, MRE11 or MLH1 proteins (Supplementary Figure 2A–G). Of particular interest was the lack of staining for phosphorylated histone H2AX (γ-H2AX; data not shown), as recent data indicate that this marker is found on chromosomal bridges in γ-ray-treated cells (Suzuki et al, 2006). This would suggest that the BLM–DNA bridges that we have identified do not contain unrepaired dsDNA breaks.
Figure 4.
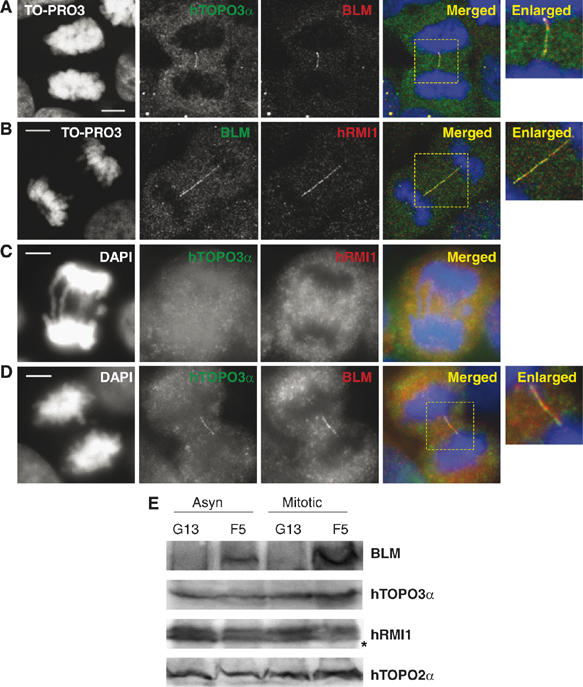
Topoisomerase IIIα (hTOPO3α) and hRMI1 colocalize with BLM to anaphase bridges and their localization is dependent upon BLM. (A) Colocalization of BLM (red) and hTOPO3α (green) to anaphase bridges in GM00637 cells. The merged image shows yellow fluorescence, where the two signals coincide. (B) Colocalization of hRMI1 (red) and BLM (green). (C) hTOPO3α and hRMI1 are absent from anaphase bridges in the GM08505 BS cell line. (D) Stable expression of BLM (red) in GM08505 cells (to generate PSNF5) causes hTOPO3α protein (green) to relocalize to anaphase bridges. (E) Western blot of asynchronous and mitotic PSNG13 (vector-only transfectant) and PSNF5 (+BLM) cells showing that expression of BLM is found in PSNF5 cells only, and that PSNF5 and PSNG13 cells express equivalent levels of hTOPO3α and hRMI1. The asterisk denotes a nonspecific band detected by the anti-hRMI1 antibody (Yin et al, 2005). Topoisomerase IIα (hTOPO2α) was used as a loading control. Scale bars, 5 μm.
Previous studies revealed that the recruitment of topoisomerase IIIα to PML bodies or its retention therein is at least partially dependent upon BLM, as topoisomerase IIIα is stably expressed, but is mislocalized in BS cell lines (Johnson et al, 2000; Wu et al, 2000; Bischof et al, 2001). To our knowledge, the issue of whether hRMI1 localization is dependent upon the presence of BLM has not been analyzed previously. We asked, therefore, whether the localization of either topoisomerase IIIα or hRMI1 to anaphase bridges depended on the presence of BLM. We were unable to detect topoisomerase IIIα or hRMI1 (Figure 4C) on either chromosomal bridges or BLM–DNA bridges in cells lacking BLM. Restoration of the correct localization of topoisomerase IIIα and hRMI1 (Figure 4D and data not shown) was achieved by expression of BLM in GM08505 cells (to generate PSNF5) (Figure 4D). The incorrect localization of topoisomerase IIIα and hRMI1 in BS cells was not due to a lack of stable expression of either protein, as shown by Western blotting (Figure 4E). We conclude, therefore, that topoisomerase IIIα and hRM1 are only recruited to and/or retained on anaphase bridges in cells expressing BLM.
Next, we asked if the presence of BLM on anaphase bridges depended on other factors. First, we addressed whether BLM localized normally in cells lacking ATM or FANCD2. ATM was chosen because it phosphorylates BLM during mitosis (Beamish et al, 2002). FANCD2 was of interest because BLM has been immunopurified in a complex with Fanconi anemia proteins, including FANCD2 (Meetei et al, 2003). However, in ATM- and FANCD2-deficient cells, BLM was localized normally to anaphase bridge structures (Supplementary Figure 3A). Moreover, treatment of cells with a high dose (10 mM) of caffeine for 2 h to inhibit ATM, ATR and the DNA-dependent protein kinase did not obviously influence the localization of BLM (Supplementary Figure 3B). Next, we asked if BLM localization was influenced by the absence of topoisomerase IIIα. Because TOP3α is an essential gene in mammals (Li and Wang, 1998), we addressed this issue by small interfering RNA (siRNA)-mediated depletion of topoisomerase IIIα. We found that depletion of topoisomerase IIIα did not prevent BLM association with anaphase bridges (Supplementary Figure 3C).
Chromosomes are not always fully disjoined in anaphase
Next, we analyzed the prevalence of chromosomal bridges and BLM–DNA bridges in anaphase cells from SV40-transformed human fibroblasts (GM00637) derived from a normal individual. Around 10% of the total anaphase population was found to be at an early stage of anaphase, as defined by the close association of the two masses of condensed chromatin. The remaining 90% of the population could be viewed as being in mid to late anaphase, where the two DNA masses had clearly migrated apart towards the opposite poles of the mitotic spindle. Unexpectedly, we found that 89% of the early anaphase GM00637 cell population exhibited at least one bridge structure, as detected by BLM staining (Figure 5A). Because the DNA masses were insufficiently separated at this stage, it was not possible to reliably distinguish between DAPI-positive and -negative bridges. In late anaphase cells, where the chromatin masses had separated completely, 42% of the GM00637 cells still displayed a discernible, BLM-positive signal on a bridge structure (Figure 5A).
Figure 5.
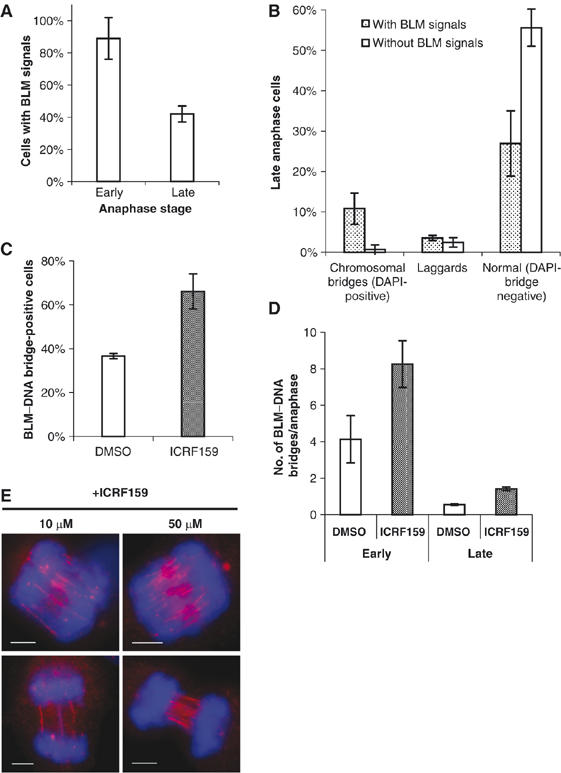
BLM–DNA bridges are commonly found in normal human cells and their prevalence can be increased by treatment with topoisomerase II inhibitors. (A) Quantification of the percentage of early and late anaphase GM00637 cells exhibiting BLM staining of bridge DNA. (B) Quantification of the percentage of late anaphase cells that exhibit either no BLM staining or BLM-positive staining on DAPI-positive chromosomal bridges, on lagging chromatin, or on apparently normal (no DAPI-positive bridges) anaphases. Lagging chromatin was scored as positive if it exhibited BLM staining or contained a BLM–DNA bridge. Experiments were performed in triplicate and error bars represent standard deviations. Over 300 anaphase cells in each case were analyzed. (C) Effect of ICRF-159 (10 μM) or solvent alone on the percentage of late anaphase cells displaying at least one BLM–DNA bridge. (D) As in (C), except quantification of the average number of BLM–DNA bridges per anaphase. (E) Representative anaphase cells showing multiple BLM–DNA bridges after treatment with 10 or 50 μM ICRF-159 for 24 h. Scale bars, 5 μm.
In the population of late anaphase cells, we could ask what proportion of the anaphase bridges were DAPI-positive conventional chromosomal bridges and what proportion were DAPI-negative BLM–DNA bridges. As expected from the data presented in Figure 3, the vast majority of the DAPI-positive chromosomal bridges exhibited BLM staining (Figure 5B). Similarly, in those cells exhibiting lagging chromatin, 60% of the samples stained positive for BLM on the lagging DNA (Figure 5B). Of most interest, however, was the finding that 32% of the apparently normal (i.e. those with no DAPI-positive bridge) GM00637 cells contained a discernible BLM–DNA bridge (Figure 5B). As this population made up the vast majority (>80%) of the total cells, the overall proportion of anaphase cells that contained a BLM–DNA bridge was, therefore, determined to be 26.5%. Because we were concerned that the above data might be an artefact of the SV40 transformation of GM00637 cells, we also quantified BLM–DNA bridge formation in untransformed MRC5 fibroblasts (which were isolated from a normal individual). The data presented in Supplementary Figure 4 indicate that MRC5 cells also displayed a significant proportion (23%) of apparently normal anaphases that contained a BLM–DNA bridge. Taken together, these data indicate that DNA bridges are far more prevalent in the anaphase population of normal human cells than has hitherto been appreciated. Nevertheless, there was a progressive reduction in the percentage of cells displaying BLM–DNA bridges as the various stages of anaphase were acted out and as cells progressed to telophase. This suggests that, whatever the source of the bridge DNA, there is likely to be a progressive resolution (or nonspecific breakage) of these structures during anaphase.
Next, we asked if the frequency of BLM–DNA bridges could be altered by treatment of GM00637 cells with low doses of the catalytic inhibitor of topoisomerase II, ICRF-159 (Tanabe et al, 1991). The dose used (10 μM) was not sufficient to induce G2 arrest at the so-called catenation checkpoint (Downes et al, 1994) (Supplementary Figure 5), and did not increase the frequency of conventional DAPI-positive chromosomal bridges in GM00637 fibroblasts (data not shown). Nevertheless, we found that ICRF-159 caused a significant increase in the percentage of apparently normal anaphases that displayed at least one BLM–DNA bridge (Figure 5C). Analysis of these ICRF-159-treated cells also suggested that they contained an unusually large number of BLM–DNA bridges per cell. Hence, we quantified the number of bridges per anaphase in cells treated with a low (10 μM) or high (50 μM) concentration of ICRF-159. As shown in Figure 5D, early anaphase cells treated with 10 μM ICRF-159 exhibited on average eight BLM–DNA bridges per cell compared to four in the control population exposed to solvent alone. This ICRF-159-induced increase in BLM–DNA bridge formation was still evident in late anaphase cells (1.42 versus 0.56), although the overall frequency declined compared to that seen in early anaphase cells. Treatment of cells with 50 μM ICRF-159 increased BLM–DNA bridge formation dramatically and to levels that could not be quantified reliably. Representative images of ICRF-159-treated anaphase cells are shown in Figure 5E.
We then asked if cells deficient for BLM (PSNG13) showed an altered frequency of anaphase bridging following exposure to ICRF-159 compared to the BLM-complemented PSNF5 cells. We found that PSNG13 (BLM−) cells showed a consistently higher frequency of ICRF-159-induced anaphase bridges than did PSNF5 (BLM+) cells (Figure 6A). Indeed, in untreated PSNG13 cells, there was a level of anaphase bridging equivalent to that in PSNF5 cells treated with 5 μM ICRF-159 for 24 h. Based on the ability of ICRF-159 to induce BLM–DNA bridge formation, we asked if PSNG13 cells might be unusually sensitive to the cytotoxic effects of this agent. For this, the PSNG13 (BLM−) and PSNF5 (BLM+) cell lines were treated with ICRF-159 either for a 24 h period or continuously, before analysis of clonogenic cell survival. The PSNG13 cells were found to be significantly more sensitive to killing by ICRF-159 than were the PSNF5 cells using either of these treatment protocols (Figure 6B).
Figure 6.
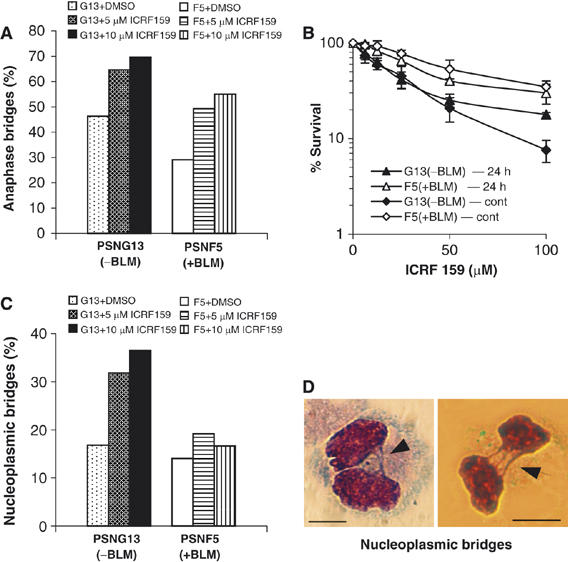
Inhibition of topoisomerase II exacerbates chromosome segregation defects in BS cells. (A) Percentage of PSNG13 and PSNF5 anaphase cells (n=>200 cells in each case) that exhibit DAPI-stained anaphase bridges in the absence of ICRF-159 or after exposure to 5 or 10 μM ICRF-159 for 24 h. (B) Clonogenic survival analysis of PSNG13 (vector alone) and PSNF5 (+BLM) cells following a 24 h or continuous (cont) exposure to ICRF-159. Analyses were performed in triplicate. Data points are the means and error bars represent standard deviations. (C) Percentage of cytokinesis-blocked PSNF5 and PSNG13 cells (n⩾1000 cells in each case) that exhibit nucleoplasmic bridges under the conditions for (A). (D) Representative images of binucleated PSNG13 cells showing examples of nucleoplasmic bridges (arrows). Scale bars, 10 μm.
To determine whether the ICRF-159-induced anaphase bridges might persist even beyond the end of anaphase in BS cells, the PSNG13 (BLM−) and PSNF5 (BLM+) cells were allowed to complete a round of mitosis in the presence of a cytokinesis inhibitor (cytochalasin B) (Thomas et al, 2003) to prevent nonspecific rupture of bridges during furrow ingression. As shown in Figure 6C, binucleated PSNG13 cells exhibited a significantly higher frequency of ICRF-159-induced nucleoplasmic bridges than did the equivalent PSNF5 cells. Examples of the nucleoplasmic bridges seen in cytokinesis-blocked PSNG13 cells are shown in Figure 6D. Taken together, these results confirm that loss of BLM function leads to chromosome segregation defects during mitosis, and suggest that BLM acts to resolve the bridges in anaphase.
BLM–DNA bridges frequently link centromeric DNA
Next, we asked whether the BLM–DNA bridges might link specific chromosomal structures or loci. Of primary interest was centromeric heterochromatin as this is replicated late in S-phase and is the last region of metaphase chromosomes from which the cohesin complex is removed (reviewed by Watanabe, 2005). To track centromeric DNA, we stained anaphases for Hec1, an outer kinetochore marker (Ciferri et al, 2005), and used immunofluoresence to quantify the frequency with which a Hec1 focus was observed lying at the ends of BLM–DNA bridges. We found that 55% of the BLM–DNA bridges (n=140) had a Hec1 focus at one or both ends of the bridge (Supplementary Figure 6A and B). Significantly, the Hec1 foci associated with BLM–DNA bridges were generally not found in the cluster of Hec1 foci found at the leading edge of the separating sister DNA masses, indicating that these centromeric regions were lagging behind the bulk DNA to some extent. Some Hec1 foci were also found at the tips of bridges linking DAPI-positive lagging chromosomes (Supplementary Figure 6C).
BLM–DNA bridges contain the PICH protein and are more prevalent in cells lacking BLM
While this manuscript was in preparation, Baumann et al (2007) reported the presence of thread-like structures in anaphase cells that contain the PICH helicase, although these authors did not demonstrate whether these threads represent a DNA structure. Nevertheless, they did identify that these so-called ‘PICH threads' frequently link centromeric loci, as shown here for BLM–DNA bridges. To investigate whether PICH threads and BLM–DNA bridges were related, we co-stained GM00637 anaphase cells for PICH and BLM. As shown in Figure 7A, BLM and PICH colocalized to BLM–DNA bridges. These data confirm that PICH threads and BLM–DNA bridges represent the same structures, and that PICH threads are therefore composed of DNA.
Figure 7.
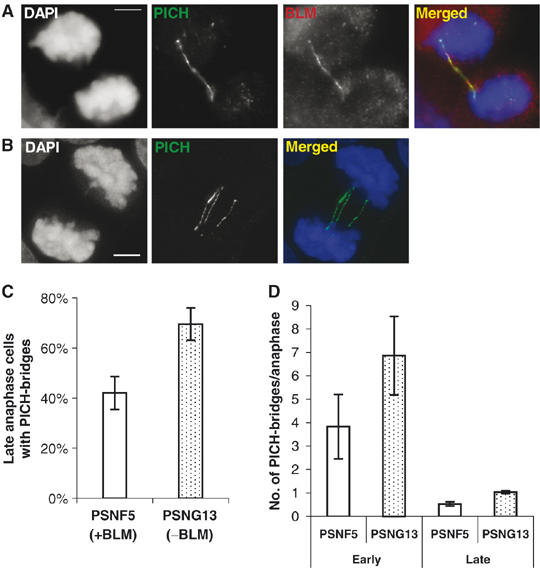
BLM-deficient cells exhibit an increased frequency of DNA bridges revealed by PICH staining. (A) A representative example showing the colocalization of PICH and BLM to a DAPI-negative BLM–DNA bridge in GM00637 cells. (B) Z-projection of multiple deconvoluted stacking images showing that the localization of PICH to DAPI-negative DNA bridges is observed in PSNG13 cells lacking BLM. (C) Quantification of the percentage of late anaphase cells of the isogenic PSNF5 (+BLM) and PSNG13 (−BLM) pair that exhibit DAPI-negative PICH bridges. (D) Quantification of the average number of PICH bridges per anaphase in PSNG13 and PSNFG5 cells. Analyses were performed in triplicate. Data points are the means and error bars represent standard deviations. Over 100 anaphase cells in each case were analyzed.
Next, we analyzed whether PICH staining afforded us the opportunity to quantify the frequency of DAPI-negative bridges in BS cells. This analysis was impossible previously, because BS cells lacking BLM also show mislocalization of topoisomerase IIIα and RMI1, and therefore, we lacked a robust marker of the DAPI-negative bridges to use in such analyses. As shown in Figure 7B, PICH localization to DAPI-negative bridges was still evident in PSNG13 (BLM−) cells, indicating that PICH is not dependent upon BLM for its localization to these bridges. Hence, we quantified PICH-positive bridges in PSNF5 and PSNG13 cells to address whether BLM normally plays a role in the suppression of BLM–DNA bridges. We found that PSNG13 (BLM−) cells had a significantly increased frequency of PICH-positive bridges and a greater number of bridges per cell than did PSNF5 (BLM+) cells (Figures 7C and D). Taken together, these data indicate that BLM and PICH colocalize to ultrafine DNA bridges in mitosis, and that BLM is required for the suppression of these bridges in anaphase cells.
The data presented above indicated that BLM likely plays a role in suppressing the accumulation of DNA bridges in anaphase. Nevertheless, we wanted to gain additional evidence that BLM effects its role in anaphase itself, such as via bridge resolution, rather than acting earlier in the cell cycle to prevent the bridges from forming. To address this, we again exploited PICH as a marker of DNA bridges and asked if BLM was recruited to bridges only after their presence could be detected by PICH staining. We found that PICH localization to condensed chromatin and to bridges was detectable during metaphase (Figure 8A), when the bridges were still short, and then became more prominent on the longer bridges evident in anaphase (Figure 8B). In contrast, BLM staining was virtually absent from the chromatin in metaphase and only became prominent in anaphase, suggesting that BLM is only recruited to pre-existing bridges around the time of the metaphase to anaphase transition. Consistent with this, in cells depleted for shugoshin (Sgo), which leads to premature centromeric disjunction in early mitotic cells (McGuinness et al, 2005), PICH staining on bridges was obvious, whereas BLM staining was absent (Figure 7C). Taken together, these data indicate that BLM is recruited to pre-formed, ultrafine DNA bridges around the time of initiation of anaphase, consistent with a role in bridge resolution during anaphase.
Figure 8.
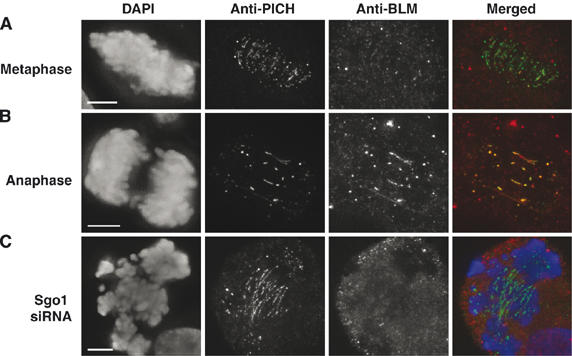
BLM is only recruited to DNA bridges in anaphase. (A) Z-projections of deconvolution images showing a metaphase GM00637 cell with PICH staining on centromeres and short bridges (green), but virtually no BLM staining (red). (B) As in (A), but on a mid-anaphase cell. Note the appearance of BLM staining on the bridges in this panel. (C) PICH, but not BLM, localizes to DNA bridges observed in early mitotic HeLa cells in which Sgo1 has been depleted to induce premature centromeric disjunction.
Discussion
We have shown that the BS gene product, BLM, is required for the suppression of mitotic chromosome missegregation. Unexpectedly, we found that BLM localizes specifically to anaphase bridges and associates with lagging chromatin during the late stages of mitosis. This localization permitted us to detect a class of ultrafine DNA bridges that persists well into the latter stages of anaphase. These bridges can be found in SV40-transformed cells, in hTert-immortalized cells and in untransformed cells, and are apparently identical to the ‘PICH-threads' described recently (Baumann et al, 2007). Formation of these bridges occurs in an unperturbed cell cycle, although their frequency can be increased by inhibition of topoisomerase II.
BS cells are known to exhibit a higher than normal frequency of micronuclei (Rosin and German, 1985). Our finding that BS cells also display excessive anaphase bridging and lagging chromosomes offers an explanation for this observation, as it is generally accepted that one source of micronuclei is through fragmentation of unsegregated DNA during cytokinesis. Although one driver for tumorigenesis in BS is likely to be hyper-recombination leading to loss of heterozygosity (Chaganti et al, 1974; Luo et al, 2000; Wu and Hickson, 2003), our data now suggest that chromosome missegregation due to a failure to efficiently resolve anaphase bridges could be an equally important driver through the generation of aneuploidy and gene dosage imbalances. Aneuploidy is a very common feature of solid tumors in man (Draviam et al, 2004; Rajagopalan and Lengauer, 2004) and, given the increase in incidence of almost all forms of cancer in BS patients (German, 1993, 1995), it is tempting to speculate that a defect in the BLM-dependent pathway for suppression of anaphase bridging may be linked more generally to the process of tumorigenesis.
Based on previous analyses, there are two explanations, which are not mutually exclusive, for why BLM might localize to anaphase bridges. First, as suggested from biochemical studies, BLM/topoisomerase IIIα/hRMI1 are required for the dissolution of homologous recombination intermediates that contain double Holliday junctions (Wu and Hickson, 2003; Wu et al, 2006), and it is a failure to complete this process before anaphase that leads to bridge formation as the still interlinked recombining DNA molecules cannot be separated. Second, BLM and its partners may play a role in the resolution of intertwined DNA structures that arise during DNA replication. Whereas there is currently no biochemical evidence to support this proposal, there is some structural similarity between recombination intermediates containing a double Holliday junction and unreplicated chromosomal regions where two replication forks converge (Branzei et al, 2006; Cobb and Bjergbaek, 2006). The findings that centromeric loci are preferentially associated with BLM–DNA bridges, and that the topoisomerase II inhibitor, ICRF-159, exacerbates chromosome missegregation defects in BS cells, are strongly suggestive that at least some of these bridges represent aberrant replication structures. A model for the generation of BLM–DNA bridges during DNA replication is depicted in Figure 9. Of relevance to this model, Seki et al, 2006 reported that chicken BLM and topoisomerase IIIα are required for the transition from metaphase to anaphase via a role in sister-chromatid dissolution.
Figure 9.
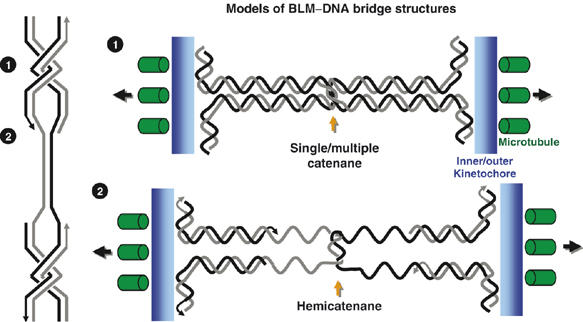
Model for the generation of BLM–DNA bridges. We propose that the BLM–DNA bridges arise during DNA replication as either (1) fully replicated, but still intertwined duplexes (cantenanes) or (2) partially replicated, hemicatenated DNA, that could arise at sites of converging replication forks. A high proportion of the bridge structures link kinetochores (blue), where Hec1 binds, and which attach to microtubules (green) that are under tension (black arrows).
One striking finding from our studies has been an ability to detect a class of ultrafine DNA bridges in the anaphase population of human cells. As a result of this, we were able to demonstrate that DNA bridges are far more prevalent in anaphase cells than hitherto has been appreciated. Indeed, we could detect DAPI-negative BLM–DNA bridges in 20–30% of late anaphase cells. This already remarkably high proportion was increased still further by prior treatment of the cells with a low dose of ICRF-159. Given that this high frequency of BLM–DNA bridging was detected in normal cell lines, which do not exhibit a correspondingly high frequency of aneuploidy or cell death at mitosis, it would appear that these bridges must be resolved successfully before cytokinesis. Consistent with this proposal, we observed a progressive reduction in the percentage of cells exhibiting bridges, as the different stages of anaphase were acted out.
Because of the colocalization of PICH with BLM on the ultrafine bridges, we were able to confirm that cells lacking BLM show a higher frequency of these bridges than do isogenic cells corrected by expression of BLM. Moreover, the bridges persist longer during anaphase in cells lacking BLM, indicating a role for BLM in bridge avoidance and/or resolution. The observation that these bridges start to become evident in metaphase, where they can be detected by staining for PICH protein (as reported by Baumann et al, 2007), but that BLM only associates with the bridges at the time that cells enter anaphase, strongly suggests that BLM acts to resolve (either directly or indirectly) the bridge DNA. Given that topoisomerase IIIα is an efficient decatenase in the presence of BLM and RMI1 (Wu and Hickson, 2006), we propose that this heteromeric complex is recruited in anaphase to catenated DNA structures that persist following DNA replication and acts to resolve them to permit faithful sister-chromatid disjunction. Nevertheless, it is clear that, even in BS cells, the bridges eventually disappear, although this might be because of nonspecific breakage due to the forces exerted by the mitotic spindle rather than being due to resolution. It is possible also that the retarded rate of bridge resolution in BS cells is catalyzed by a partially redundant decatenase.
It is important to address why the ultrafine BLM–DNA bridges identified here have proven so difficult to detect previously. The simplest explanation is that they are so fine in structure that staining with conventional DNA dyes is an insufficiently sensitive method to reveal them. However, we could not detect colocalization of BLM–DNA bridges with phospho-histone H3, with the condensin subunit, SMC2, with topoisomerase IIα or with GFP-tagged histone H2B (Supplementary Figure 7). One possible explanation is that the BLM–DNA bridges have a composition that is fundamentally different from that of conventional anaphase bridges. For example, BLM–DNA bridges might contain DNA that has not undergone condensation. Such a failure to complete condensation might be because DNA repair processes are incomplete, and hence a persistent atypical DNA structure in some way prevents condensation from occurring. Previous studies have indicated that the forces exerted by the mitotic spindle are certainly strong enough to expel nucleosomes from dsDNA (Houchmandzadeh et al, 1997; Bennink et al, 2001). Hence, the BLM–DNA bridges may not be wrapped into a chromatin structure in the conventional way. Another possibility is that the BLM–DNA bridges contain an unusual DNA structure (perhaps excessively stretched) that does not permit stable association of dyes, such as DAPI or Hoechst, which bind to the minor groove of the double helix. Further work will be needed to address these questions.
In summary, we have shown that BS cells have an abnormally high frequency of anaphase bridges. BLM localizes specifically to DNA bridges in anaphase cells. We have identified a class of ultrafine DNA bridges that is unexpectedly prevalent in the anaphase population of normal cells, including untransformed fibroblasts. These bridges appear to be resolved progressively during the different stages of anaphase. Consistent with the known chromosome instability and cancer predisposition associated with BS, our data implicate BLM in regulating ploidy through a role in anaphase bridge resolution.
Materials and methods
Cell lines and cell culture
PSNF5 and PSNG13 are isogenic cell lines differing only in their BLM status. PSNF5 is a stable BS cell line expressing a FLAG epitope-tagged, wild-type BLM protein from the CMV promoter in a pcDNA3-based construct. PSNG13 is a control BS cell transfectant containing the pcDNA3 vector only. The derivation of these lines has been reported previously (Gaymes et al, 2002; Davies et al, 2004). The PG3.1 cell line is a stable transfectant expressing YFP-tagged BLM. The cell lines discussed above were grown in minimal essential medium alpha (MEM-α) containing 350 μg/ml G418. The SV-40-transformed normal human fibroblast cell lines, GM00637 and WI38/VA13, as well as the SV-40 transformed AT fibroblast line, AT5 BIVA, the FANCD2-deficient fibroblast line, PD733i, and the untransformed MRC5 cells were maintained in MEM-α. hTERT-immortalized human foreskin fibroblasts, HS68 and HeLa cells stably expressing GFP-tagged histone H2B were grown in Dulbecco's modified Eagle's medium. All media were supplemented with 10% fetal calf serum, 4 mM glutamine, 100 U/ml penicillin and 100 μg/ml streptomycin. All cultures were maintained at 37°C in a humidified atmosphere containing 5% CO2.
Clonogenic cell survival assays
Cells were plated in 10-cm tissue culture Petri dishes, and 24 h later were treated with various concentrations of ICRF-159 for either 24 h (and then the drug was removed) or continuously. After 15–18 days, cell colonies were fixed with methanol:acetic acid (3:1) for 20 min, and were then stained with 1 mg/ml crystal violet for 14 h. Colonies with more than 50 cells were counted. The number of colonies at each drug dose was expressed as a percentage of the untreated control sample.
Antibodies and indirect immunofluorescence staining
The following primary antibodies were used at the dilutions indicated: Goat anti-BLM, 1:150 (C-18; Santa Cruz); rabbit anti-BLM, 1:300 (IHIC34; (Wu et al, 2000); mouse anti-human TOPO3α, 1:200 (IE3; a kind gift from Aventis Pharma); rabbit anti-WRN, 1:200 (ab200; Abcam); rabbit anti-PML, 1:800 (AB1370; Chemicon); mouse anti-TOPO2α, 1:200 (IF6; CR-UK Clare Hall); rabbit anti-MLH1, 1:400 (G168–728; BD Biosciences); rabbit anti-RAD51, 1:200 (Ab-1; Oncogene Research Products); mouse anti-BRCA1, 1:200 (Santa Cruz); rabbit anti-γH2AX, 1:300 (ab2893; Abcam); rabbit anti-Mre11, 1:400 (NB10042; Novusbio); rabbit anti-Nbs1, 1:600 (BN100143D; Novusbio); rabbit anti-hRMI1, 1:300 (a gift from Dr G Brown, University of Toronto); rabbit anti-hRMI1 (BLAP75), 1:500 (a gift from Dr W Wang); rabbit anti-phospho-Histone H3 S-10, 1:30 (06-570; Upstate); mouse anti-Hec1, 1:200: (9G3; abcam); rat anti-PICH, 1:600 (a gift from Dr E Nigg); goat anti-GFP, 1:200 (ab6673; abcam). The secondary antibodies and dilutions used were: chicken anti-mouse Alexa Fluor 488, 1:600; donkey anti-goat Alexa Fluor 488 or 555, 1:600; donkey anti-rabbit Alexa Fluor 488, 1:400; donkey anti-rat Alexa Fluor 488, 1:500; sheep anti-rabbit Cy3, 1:800; sheep anti-mouse Cy3, 1:600. Secondary antisera were purchased from Sigma or Molecular Probes Inc.
Immunofluorescence staining was performed according to previously described protocols (Wu et al, 2000). Nuclear DNA was detected by mounting slides either in Vectashield mounting medium containing DAPI (1.5 μg/ml) or by staining with Hoechst-33258 (50 μg/ml) and mounting in buffer containing 90% glycerol, 20 mM Tris–HCl (pH 8.0) and 50 μg/ml paraphenylenediamine. Slides were analyzed using either a Zeiss Axioskop 2 plus or a Nikon Eclipse 80i fluorescence microscope equipped with a Plan Apo × 100/1.4 objective. Images were acquired by using either AxioVision or Lucia G/F software. Deconvolution images were generated from 8 to 12 stacking images by using Lucia G/F software.
Treatment of samples with DNaseI or RNaseA
GM00637 cells were treated with 10 μg/ml of either DNase I or heat-treated RNaseA (Sigma) for 7 min in 0.2% Triton X-100, 20 mM PIPES, 1 mM MgCl2 at 37°C before fixation and immunofluorescence staining.
Differential immunofluorescence staining of DNA bridges
GM00637 cells were incubated with 10 μg/ml BrdU for 48 h, and the cells were fixed with 4% paraformaldehyde. Nuclear DNA was partially heat-denatured in 1 × PBS at 90°C for 3 min after permeabilization in 0.5% Triton X-100 for 20 min on ice. Samples were then subjected to immunofluorescence staining as described above. Nuclei were stained by 200 nM TO-PRO3 (Invitrogen) and slides were mounted in ProLong® Gold antifade reagent containing DAPI (Invitrogen). Slides were analyzed using an Olympus BX51 microscope equipped with an Uplan F1 × 100/1.3 objective and a confocal system (Radiance 2000; Bio-Rad Laboratories). Images were captured and analyzed by using Lasersharp 2000 software. Z stack images were acquired at 0.3 μm intervals. Images were further processed using Confocal Assistant 4.02, ImageJ (NIH) and Photoshop CS (Adobe) software.
Western blotting
Cells were lysed with 2% SDS in PBS containing a cocktail of protease inhibitors (Roche) for 5 min at 95°C, and were then passed through a 25G syringe needle to shear genomic DNA. Whole-cell lysates were separated on 5 or 10% SDS-polyacrylamide gels, and the proteins were then transferred to a nitrocellulose membrane and subjected to Western blotting analysis with the antibodies indicated.
Detection of nucleoplasmic bridges in cytokinesis-blocked cells
Cells were plated in 6-cm tissue culture Petri dishes, and were then treated with 2 μg/ml cytochalasin B (to inhibit cytokinesis) and the indicated concentrations of ICRF-159 for 24 h. Following trypsinization to generate a single-cell suspension, the cells were centrifuged onto slides by the use of a cytospin apparatus (Cytospin2), and the DNA was stained using Giemsa. Nucleoplasmic DNA bridges in binucleated cells with well-separated nuclei were scored using a Zeiss Axioskop 2 plus microscope viewed with Plan Neofluor × 40/1.3 and Plan Apochromat × 100/1.4 objectives (Fenech, 2000).
Quantification of anaphase bridges and lagging chromosomes
Cells were grown on chamber slides (Lab Tek CC II) for 24–36 h, and were fixed with 4% paraformaldehyde in PBS at 4°C for 20 min. Cells were then stained with DAPI, and late anaphase cells were analyzed using a Zeiss Axioskop 2 plus microscope system described above.
Flow cytometry
The isogenic PSNG13 and PSNF5 cell lines, or the SV40-transformed normal fibroblast cell line, GM00637, were treated with or without various concentrations of ICRF-159. At the indicated time points, cells were fixed with 80% ice-cold ethanol overnight. Before flow cytometry, cells were resuspended in PBS containing 40 μg/ml propidium iodide and 100 μg/ml RNaseA. Data were collected using a Becton Dickinson FACScalibur machine, and were analyzed with CellQuest software.
Depletion of cellular proteins by RNA interference
HeLa cells were transfected with siRNA duplexes (Invitrogen or Qiagen) using oligofectamine (Invitrogen) for 24–48 h, according to manufacturer's instructions. Depletion of human topoisomerase IIIα was achieved by using Stealth™ RNAi duplexes (Invitrogen). A Stealth RNAi-negative control duplex (Invitrogen) was used as a negative control. Depletion of human Sgo1 was performed using a published RNAi duplex, siSgo1.1A (McGuinness et al, 2005). After transfection, HeLa cells were fixed and subjected to immunostaining, as described above.
Supplementary Material
Supplementary Figure 1
Supplementary Figure 2
Supplementary Figure 3
Supplementary Figure 4
Supplementary Figure 5
Supplementary Figure 6
Supplementary Figure 7
Acknowledgments
We thank members of the CR-UK Genome Integrity Group for helpful discussions, Dr P Mohaghegh for the BLM-YFP construct, Dr G Brown for the anti-hRMI1 antiserum, Drs E Nigg and C Baumann for the anti-PICH antibody, Dr F Iborra for help with confocal microscopy, Dr CZ Bachrati, Dr K Hanada, Dr SL Davies, Dr G Mosedale, Dr PJ McHugh and Dr L Wu for useful comments on the manuscript, the CR-UK Cell Services Unit for the MRC5 and HS68 cells, and Miss PJ White for preparation of the manuscript. This work was supported by Cancer Research UK and the Croucher Foundation (Hong Kong). KLC was supported by a scholarship from the Croucher Foundation (Hong Kong).
References
- Baumann C, Korner R, Hofmann K, Nigg EA (2007) PICH, a centromere-associated SNF2 family ATPase, is regulated by Plk1 and required for the spindle checkpoint. Cell 128: 101–114 [DOI] [PubMed] [Google Scholar]
- Beamish H, Kedar P, Kaneko H, Chen P, Fukao T, Peng C, Beresten S, Gueven N, Purdie D, Lees-Miller S, Ellis N, Kondo N, Lavin MF (2002) Functional link between BLM defective in Bloom's syndrome and the ataxia-telangiectasia-mutated protein, ATM. J Biol Chem 277: 30515–30523 [DOI] [PubMed] [Google Scholar]
- Bennink ML, Leuba SH, Leno GH, Zlatanova J, de Grooth BG, Greve J (2001) Unfolding individual nucleosomes by stretching single chromatin fibers with optical tweezers. Nat Struct Biol 8: 606–610 [DOI] [PubMed] [Google Scholar]
- Bischof O, Kim SH, Irving J, Beresten S, Ellis NA, Campisi J (2001) Regulation and localization of the Bloom syndrome protein in response to DNA damage. J Cell Biol 153: 367–380 [DOI] [PMC free article] [PubMed] [Google Scholar]
- Branzei D, Sollier J, Liberi G, Zhao X, Maeda D, Seki M, Enomoto T, Ohta K, Foiani M (2006) Ubc9- and mms21-mediated sumoylation counteracts recombinogenic events at damaged replication forks. Cell 127: 509–522 [DOI] [PubMed] [Google Scholar]
- Chaganti RS, Schonberg S, German J (1974) A manyfold increase in sister chromatid exchanges in Bloom's syndrome lymphocytes. Proc Natl Acad Sci USA 71: 4508–4512 [DOI] [PMC free article] [PubMed] [Google Scholar]
- Chang M, Bellaoui M, Zhang C, Desai R, Morozov P, Delgado-Cruzata L, Rothstein R, Freyer GA, Boone C, Brown GW (2005) RMI1/NCE4, a suppressor of genome instability, encodes a member of the RecQ helicase/Topo III complex. EMBO J 24: 2024–2033 [DOI] [PMC free article] [PubMed] [Google Scholar]
- Ciferri C, De Luca J, Monzani S, Ferrari KJ, Ristic D, Wyman C, Stark H, Kilmartin J, Salmon ED, Musacchio A (2005) Architecture of the human ndc80-hec1 complex, a critical constituent of the outer kinetochore. J Biol Chem 280: 29088–29095 [DOI] [PubMed] [Google Scholar]
- Cobb JA, Bjergbaek L (2006) RecQ helicases: lessons from model organisms. Nucleic Acids Res 34: 4106–4114 [DOI] [PMC free article] [PubMed] [Google Scholar]
- Davies SL, North PS, Dart A, Lakin ND, Hickson ID (2004) Phosphorylation of the Bloom's syndrome helicase and its role in recovery from S-phase arrest. Mol Cell Biol 24: 1279–1291 [DOI] [PMC free article] [PubMed] [Google Scholar]
- Downes CS, Clarke DJ, Mullinger AM, Gimenez-Abian JF, Creighton AM, Johnson RT (1994) A topoisomerase II-dependent G2 cycle checkpoint in mammalian cells. Nature 372: 467–470 [DOI] [PubMed] [Google Scholar]
- Draviam VM, Xie S, Sorger PK (2004) Chromosome segregation and genomic stability. Curr Opin Genet Dev 14: 120–125 [DOI] [PubMed] [Google Scholar]
- Ellis NA, Groden J, Ye TZ, Straughen J, Lennon DJ, Ciocci S, Proytcheva M, German J (1995) The Bloom's syndrome gene product is homologous to RecQ helicases. Cell 83: 655–666 [DOI] [PubMed] [Google Scholar]
- Fenech M (2000) The in vitro micronucleus technique. Mutat Res 455: 81–95 [DOI] [PubMed] [Google Scholar]
- Gaymes TJ, North PS, Brady N, Hickson ID, Mufti GJ, Rasool FV (2002) Increased error-prone non homologous DNA end-joining—a proposed mechanism of chromosomal instability in Bloom's syndrome. Oncogene 21: 2525–2533 [DOI] [PubMed] [Google Scholar]
- German J (1993) Bloom's syndrome: a Mendelian prototype of somatic mutational disease. Medicine 72: 393–406 [PubMed] [Google Scholar]
- German J (1995) Bloom's syndrome. Dermatol Clin 13: 7–18 [PubMed] [Google Scholar]
- Gisselsson D, Pettersson L, Hoglund M, Heidenblad M, Gorunova L, Wiegant J, Mertens F, Dal Cin P, Mitelman F, Mandahl N (2000) Chromosomal breakage-fusion-bridge events cause genetic intratumor heterogeneity. Proc Natl Acad Sci USA 97: 5357–5362 [DOI] [PMC free article] [PubMed] [Google Scholar]
- Goodwin A, Wang SW, Toda T, Norbury C, Hickson ID (1999) Topoisomerase III is essential for accurate nuclear division in Schizosaccharomyces pombe. Nucleic Acids Res 27: 4050–4058 [DOI] [PMC free article] [PubMed] [Google Scholar]
- Hickson ID (2003) RecQ helicases: caretakers of the genome. Nat Rev Cancer 3: 169–178 [DOI] [PubMed] [Google Scholar]
- Hoffelder DR, Luo L, Burke NA, Watkins SC, Gollin SM, Saunders WS (2004) Resolution of anaphase bridges in cancer cells. Chromosoma 112: 389–397 [DOI] [PubMed] [Google Scholar]
- Houchmandzadeh B, Marko JF, Chatenay D, Libchaber A (1997) Elasticity and structure of eukaryote chromosomes studied by micromanipulation and micropipette aspiration. J Cell Biol 139: 1–12 [DOI] [PMC free article] [PubMed] [Google Scholar]
- Johnson FB, Lombard DB, Neff NF, Mastrangelo MA, Dewolf W, Ellis NA, Marciniak RA, Yin Y, Jaenisch R, Guarente L (2000) Association of the Bloom syndrome protein with topoisomerase IIIalpha in somatic and meiotic cells. Cancer Res 60: 1162–1167 [PubMed] [Google Scholar]
- Kaliraman V, Brill SJ (2002) Role of SGS1 and SLX4 in maintaining rDNA structure in Saccharomyces cerevisiae. Curr Genet 41: 389–400 [DOI] [PMC free article] [PubMed] [Google Scholar]
- Li W, Wang JC (1998) Mammalian DNA topoisomerase IIIalpha is essential in early embryogenesis. Proc Natl Acad Sci USA 95: 1010–1013 [DOI] [PMC free article] [PubMed] [Google Scholar]
- Luo G, Santoro IM, McDaniel LD, Nishijima I, Mills M, Youssoufian H, Vogel H, Schultz RA, Bradley A (2000) Cancer predisposition caused by elevated mitotic recombination in Bloom mice. Nat Genet 26: 424–429 [DOI] [PubMed] [Google Scholar]
- Maftahi M, Han CS, Langston LD, Hope JC, Zigouras N, Freyer GA (1999) The top3(+) gene is essential in Schizosaccharomyces pombe and the lethality associated with its loss is caused by Rad12 helicase activity. Nucleic Acids Res 27: 4715–4724 [DOI] [PMC free article] [PubMed] [Google Scholar]
- McGuinness BE, Hirota T, Kudo NR, Peters JM, Nasmyth K (2005) Shugoshin prevents dissociation of cohesin from centromeres during mitosis in vertebrate cells. PLoS Biol 3: e86. [DOI] [PMC free article] [PubMed] [Google Scholar]
- Meetei AR, Sechi S, Wallisch M, Yang D, Young MK, Joenje H, Hoatlin ME, Wang W (2003) A multiprotein nuclear complex connects Fanconi anemia and Bloom syndrome. Mol Cell Biol 23: 3417–3426 [DOI] [PMC free article] [PubMed] [Google Scholar]
- Mullen JR, Nallaseth FS, Lan YQ, Slagle CE, Brill SJ (2005) Yeast Rmi1/Nce4 controls genome stability as a subunit of the Sgs1–Top3 complex. Mol Cell Biol 25: 4476–4487 [DOI] [PMC free article] [PubMed] [Google Scholar]
- Rajagopalan H, Lengauer C (2004) Aneuploidy and cancer. Nature 432: 338–341 [DOI] [PubMed] [Google Scholar]
- Raynard S, Bussen W, Sung P (2006) A double Holliday junction dissolvasome comprising BLM, topoisomerase IIIalpha, and BLAP75. J Biol Chem 281: 13861–13864 [DOI] [PubMed] [Google Scholar]
- Rosin MP, German J (1985) Evidence for chromosome instability in vivo in Bloom syndrome: increased numbers of micronuclei in exfoliated cells. Hum Genet 71: 187–191 [DOI] [PubMed] [Google Scholar]
- Sanz MM, Proytcheva M, Ellis NA, Holloman WK, German J (2000) BLM, the Bloom's syndrome protein, varies during the cell cycle in its amount, distribution, and co-localization with other nuclear proteins. Cytogenet Cell Genet 91: 217–223 [DOI] [PubMed] [Google Scholar]
- Saunders WS, Shuster M, Huang X, Gharaibeh B, Enyenihi AH, Petersen I, Gollin SM (2000) Chromosomal instability and cytoskeletal defects in oral cancer cells. Proc Natl Acad Sci USA 97: 303–308 [DOI] [PMC free article] [PubMed] [Google Scholar]
- Seki M, Nakagawa T, Seki T, Kato G, Tada S, Takahashi Y, Yoshimura A, Kobayashi T, Aoki A, Otsuki M, Habermann FA, Tanabe H, Ishii Y, Enomoto T (2006) Bloom helicase and DNA topoisomerase IIIalpha are involved in the dissolution of sister chromatids. Mol Cell Biol 26: 6299–6307 [DOI] [PMC free article] [PubMed] [Google Scholar]
- Stewart E, Chapman CR, Al-Khodairy F, Carr AM, Enoch T (1997) rqh1+, a fission yeast gene related to the Bloom's and Werner's syndrome genes, is required for reversible S phase arrest. EMBO J 16: 2682–2692 [DOI] [PMC free article] [PubMed] [Google Scholar]
- Stewenius Y, Gorunova L, Jonson T, Larsson N, Hoglund M, Mandahl N, Mertens F, Mitelman F, Gisselsson D (2005) Structural and numerical chromosome changes in colon cancer develop through telomere-mediated anaphase bridges, not through mitotic multipolarity. Proc Natl Acad Sci USA 102: 5541–5546 [DOI] [PMC free article] [PubMed] [Google Scholar]
- Suzuki M, Suzuki K, Kodama S, Watanabe M (2006) Phosphorylated histone H2AX foci persist on rejoined mitotic chromosomes in normal human diploid cells exposed to ionizing radiation. Radiat Res 165: 269–276 [DOI] [PubMed] [Google Scholar]
- Tanabe K, Ikegami Y, Ishida R, Andoh T (1991) Inhibition of topoisomerase II by antitumor agents bis(2,6-dioxopiperazine) derivatives. Cancer Res 51: 4903–4908 [PubMed] [Google Scholar]
- Thomas P, Umegaki K, Fenech M (2003) Nucleoplasmic bridges are a sensitive measure of chromosome rearrangement in the cytokinesis-block micronucleus assay. Mutagenesis 18: 187–194 [DOI] [PubMed] [Google Scholar]
- Van Furth R, Van Zwet TL (1988) Immunocytochemical detection of 5-bromo-2-deoxyuridine incorporation in individual cells. J Immunol Methods 108: 45–51 [DOI] [PubMed] [Google Scholar]
- Watanabe Y (2005) Sister chromatid cohesion along arms and at centromeres. Trends Genet 21: 405–412 [DOI] [PubMed] [Google Scholar]
- Watt PM, Louis EJ, Borts RH, Hickson ID (1995) Sgs1: a eukaryotic homolog of E. coli RecQ that interacts with topoisomerase II in vivo and is required for faithful chromosome segregation. Cell 81: 253–260 [DOI] [PubMed] [Google Scholar]
- Win TZ, Mankouri HW, Hickson ID, Wang SW (2005) A role for the fission yeast Rqh1 helicase in chromosome segregation. J Cell Sci 118: 5777–5784 [DOI] [PubMed] [Google Scholar]
- Wu L, Bachrati CZ, Ou J, Xu C, Yin J, Chang M, Wang W, Li L, Brown GW, Hickson ID (2006) BLAP75/RMI1 promotes the BLM-dependent dissolution of homologous recombination intermediates. Proc Natl Acad Sci USA 103: 4068–4073 [DOI] [PMC free article] [PubMed] [Google Scholar]
- Wu L, Davies SL, North PS, Goulaouic H, Riou JF, Turley H, Gatter KC, Hickson ID (2000) The Bloom's syndrome gene product interacts with topoisomerase III. J Biol Chem 275: 9636–9644 [DOI] [PubMed] [Google Scholar]
- Wu L, Hickson ID (2003) The Bloom's syndrome helicase suppresses crossing over during homologous recombination. Nature 426: 870–874 [DOI] [PubMed] [Google Scholar]
- Wu L, Hickson ID (2006) DNA helicases required for homologous recombination and repair of damaged replication forks. Annu Rev Genet 40: 279–306 [DOI] [PubMed] [Google Scholar]
- Yankiwski V, Marciniak RA, Guarente L, Neff NF (2000) Nuclear structure in normal and Bloom syndrome cells. Proc Natl Acad Sci USA 97: 5214–5219 [DOI] [PMC free article] [PubMed] [Google Scholar]
- Yin J, Sobeck A, Xu C, Meetei AR, Hoatlin M, Li L, Wang W (2005) BLAP75, an essential component of Bloom's syndrome protein complexes that maintain genome integrity. EMBO J 24: 1465–1476 [DOI] [PMC free article] [PubMed] [Google Scholar]
- Zhong S, Hu P, Ye TZ, Stan R, Ellis NA, Pandolfi PP (1999) A role for PML and the nuclear body in genomic stability. Oncogene 18: 7941–7947 [DOI] [PubMed] [Google Scholar]
Associated Data
This section collects any data citations, data availability statements, or supplementary materials included in this article.
Supplementary Materials
Supplementary Figure 1
Supplementary Figure 2
Supplementary Figure 3
Supplementary Figure 4
Supplementary Figure 5
Supplementary Figure 6
Supplementary Figure 7