

Abstract
In this letter, the long-term stabilization of monodisperse microbubbles produced by flow focusing is demonstrated using lipid encapsulation. Fluorescence microscopy, high-speed camera imaging, and particle size analysis were used to investigate the roles of lipid phase behavior, dissolution, Ostwald ripening, and coalescence in the stability of microbubbles formed by flow focusing. It was found that these behaviors were controlled through compositional changes with respect to lipid, emulsifier, and viscosity agents. Microbubbles coated with lipid and PEG emulsifier in a viscous solution were found to contain an extremely narrow size distribution (diameterav = 51 μm, standard deviation = 4 μm), which was maintained for up to several months.
Introduction
Lipid-coated microbubbles are important in biomedical applications because of their great potential as ultrasound contrast agents and drug and gene delivery vehicles.1-4 The current methods of producing lipid-encapsulated microbubbles consist of sonication and mechanical agitation. The use of either method results in the production of polydisperse microbubbles. Currently available ultrasound contrast agents have a fairly wide size distribution. (An FDA-approved agent has a mean diameter of 1.1–3.3 μm with a maximum bubble diameter as large as 20 μm.)
Encapsulated microbubbles are highly echogenic because of differences in compressibility and density between the microbubble and the surrounding fluid.4 One of the unique properties of microbubble contrast agents is that they resonate when excited in an ultrasound field, which permits detection strategies where the signal from contrast agents is differentiated from that of surrounding tissue. Because the resonance frequency of a bubble is directly related to its size and available ultrasound systems have limited-frequency bandwidth, it is optimal to have an entire population of contrast agents of the same diameter matched to the bandwidth. Therefore, the size and monodispersity of contrast agents are important in diagnostic and therapeutic applications with ultrasound.
A technique called flow focusing can be used to mass generate micrometer-sized gas bubbles with a perfectly monodisperse and controllable diameter.5 This technique utilizes a liquid forced under pressure to focus a stream of gas through an orifice. As the gas jet exits the chamber into a liquid at ambient pressure, the jet breaks into monodisperse microbubbles as a result of capillary instability. The diameter of the microbubble depends on the gas and liquid flow rates and the diameter of the orifice.6 The diameter increases with increasing gas flow rate and decreasing liquid flow rate. Previous demonstrations of this technique have been used only to formulate surfactant-coated microbubbles of air, which rapidly dissolve or coalesce after being produced.
In this letter, we consider the technique of flow focusing to produce monodisperse microbubbles used for ultrasound imaging. Specifically, we demonstrate that with the use of lipid, emulsifier, and viscosity agents, microbubbles produced with flow focusing can be lipid-encapsulated, resulting in a monodisperse population, which remains stable for several months.
Materials and Methods
Data presented in this letter were acquired from a custom-built flow-focusing device fabricated out of stainless steel. The chamber design was similar to that described previously by Gañán-Calvo, although the orifice diameter was 200 μm.5 The gas and liquid flow rates were provided by high precision KD Scientific (Holliston, MA) syringe pumps. The liquid flow rate was maintained at a constant 6 mL/min, and the size of the microbubbles was controlled by changing the gas flow rate. The bubbles exited the chamber into filtered, gas-saturated water. The lipid solution used for stabilizing the bubbles contained the phospholipid 1,2-distearoyl-sn-glycero-3-phosphocholine (DSPC), purchased from Avanti Polar Lipids (Alabaster, AL), and/or the emulsifier PEG-40 stearate (PEG40S), purchased from Sigma (St. Louis, MO). The DSPC/PEG40S solutions were formed at a 9/1 mol/mol ratio. Concentrations are specified in Table 1. Lipids were prepared as described previously7 and suspended as vesicles in either 10 vol % glycerin (Fisher Scientific, Pittsburgh, PA), 10 vol % propylene glycol (Sigma-Aldrich, St. Louis, MO), and 80 vol % water (GPW) or water as specified in Table 1. All water used in these experiments was purified in a Barnstead Nanopure System (Dubuque, IA) and had a resistivity ≥17.9 MΩ and pH 5.5. Air was used as the gas in all cases. All experiments were performed at room temperature. The bulk viscosity was measured using an Ubbelohde viscometer (Cannon Instrument Company, State College, PA) at 22 °C.
Table 1.
Coalescence, Viscosity (at 22 °C), Microstructure, and Dissolution Results Using Different Lipid and Emulsifier Concentrations for Microbubbles Formed in Water and GPW Solutiona
| concentration mg/mL |
water | 10% glycerin 10% propylene glycol 80% water |
|---|---|---|
| 0.28 DSPC 0.08 PEG40S |
51% coalescing, μ = 0.92 cP coating (two-phase) limited dissolution |
no coalescing, μ = 1.88 cP coating (two-phase) limited dissolution |
| 3.5 DSPC 1.0 PEG40S |
<1% coalescing, μ = 1.01 cP coating (two-phase) limited dissolution |
12% coalescing, μ = 2.06 cP coating (two-phase) limited dissolution |
| 0.28 DSPC only | 52% coalescing coating (one-phase) complete dissolution |
3% coalescing, μ = 1.82 cP coating (one-phase) complete dissolution |
| 0.08 PEG40S only | 47% coalescing coating (one-phase) complete dissolution |
no coalescing coating (one-phase) complete dissolution |
| 1.0 PEG40S only | no coalescing, μ = 0.94 cP coating (one-phase) complete dissolution |
no coalescing coating (one-phase) complete dissolution |
| no lipid or surfactant |
55% coalescing, μ = 0.92 cP no coating complete dissolution |
no coalescing, μ = 1.85 cP no coating complete dissolution |
The two populations demonstrating long-term stability are in italics.
The fluorescent probe DiI (Molecular Probes, Eugene, OR) was added to the initial vesicle suspension at a concentration of 0.4 μL/mL before the production of the microbubbles in order to permit fluorescence microscopy of the bubbles and studies of lipid/emulsifier encapsulation.
High-speed imaging was used to observe and quantify the coalescence of bubbles exiting the flow-focusing chamber. Images were acquired using a high-speed camera system (Kodak Motion-corder Analyzer, Redlake, Tuscon, AZ) in conjunction with a xenon strobe (PerkinElmer Optoelectronics, Fremont, CA). Observations were made in the bubble stream from 0.0 to 2.0 mm from the flow-focusing orifice. Coalescence was defined as the fusion of two individual bubbles after exiting the flow-focusing orifice. No coalescence ever occurred in the first 0.35 mm. Downstream coalescence refers to a distance of between 1.5 and 2.0 mm from the orifice.
Fluorescence microscopy permitted an observation of the coatings and the dissolution behavior of microbubbles harvested while exiting the chamber. Fluorescence images were captured with an Orca digital camera (Hamamatsu, Japan) mounted on a Nikon inverted microscope (Melville, NY) and processed with SimplePCI (C-Imaging, Cranberry Township, PA). Measurements of the bubble size distribution in solution were made with an accusizer (Particle Sizing Systems, Santa Barbara, CA).
Results
Within the parameters varied for this study, optimized microbubble production resulted from flow focusing with 0.28 mg/mL DSPC and 0.08 mg/mL PEG40S in a 10 vol % glycerin, 10 vol % propylene glycol, and 80 vol % water (GPW) solution. In this case, a layer of monodisperse microbubbles accumulated in the collection chamber. These microbubbles had a mean diameter of 51 μm and a standard deviation of 4 μm (Figure 1). In addition, we observed that this microbubble layer exhibited remarkable stability, persisting with the same size distribution for 3 months. This result indicates that neither coalescence nor dissolution occurred to any significant degree in the formation and storage of this population.
Figure 1.
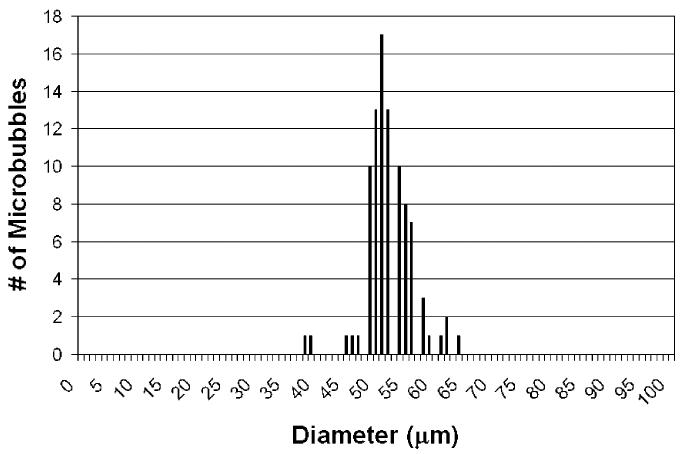
Size distribution data obtained by the accusizer within 15 min of microbubble production. The liquid solution used to make microbubbles contained 0.28 mg/mL DSPC and 0.08 mg/mL PEG40S in GPW solution. The average diameter of the microbubbles was 51 μm with a standard deviation of 4 μm.
To gain insight into the impact of individual surfactant and solution components in the processes of coalescence, coating, and dissolution in the formation of these microbubbles, we had varied and limited the components during microbubble production compared to this optimized situation. Results are summarized in Table 1. Microbubble coalescence, coating, and dissolution were all impacted by the component conditions and affect the stability of these microbubbles.
Bubble coalescence almost always occurred (approximately 50% of bubbles fuse) when the liquid jet surrounding the microbubbles was injected into water (Figure 2a). The only two exceptions were in the cases where the DSPC/PEG40S concentration was increased by more than a factor of 10, in which case the coalescence was reduced to less than 1%, or at a high concentration (1 mg/ml) of PEG40S only, in which case the coalescence was completely suppressed.
Figure 2.

Microbubbles exiting the flow-focusing chamber into a water medium. Liquid solutions contain (a) 0.28 mg/mL DSPC and 0.08 mg/mL PEG40S in water and 51% of the microbubbles coalesced after exiting the chamber, (b) 0.28 mg/mL DSPC and 0.08 mg/mL PEG40S in GPW solution with no coalescence observed, and (c) 0.28 mg/mL DSPC in GPW solution (inset, further downstream, 3% of the microbubbles coalesced). The scale bar represents 70 μm.
Conversely, coalescence was practically eliminated when the liquid jet surrounding the microbubble was injected into GPW (Figure 2b), except for the case where the DSPC/PEG40S concentration had been increased by more than 10 times, in which case 12% coalescence was observed. A small degree of coalescence was observed when PEG40S was eliminated completely (Figure 2c).
When the combination of DSPC and PEG40S was used, we observed that the microbubbles would dissolve slowly in the first few hours and then remain stable for several hours (Figure 3a-c). This is noted as “limited dissolution” in Table 1. However, when either PEG40S or DSPC was omitted from the solution, individual microbubbles would dissolve completely within a few hours, and when bubbles were touching, coalescence was never observed. Pronounced Ostwald ripening was observed in the case of PEG40S-coated microbubbles during this dissolution process. When neither the lipid nor the surfactant was introduced (no coating), microbubbles dissolved so quickly that they could not be harvested for analysis.
Figure 3.
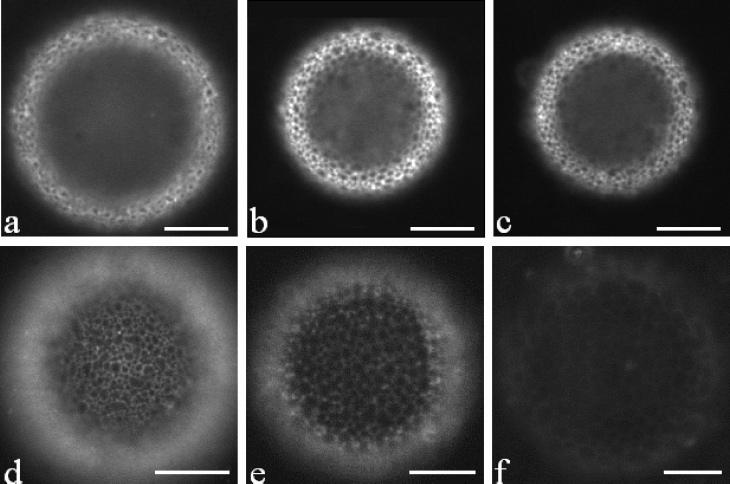
Dissolution images of a fluorescent microbubble (a–c). The microbubble was formed by DSPC and PEG40S in GPW solution. Images recorded (a) immediately after formation, D = 70 μm, (b) at t = 15 min, D = 49 μm, and (c) at t = 90 min, D = 49 μm. The microbubble stopped dissolving within 15 min, and the size remained the same after that. Fluorescent images of microbubbles with different shell components and solution immediately after formation (d–f). (d) DSPC/PEG40S in water, (e) DSPC/PEG40S in GPW solution, and (f) DSPC in GPW solution. Dark domains represent the condensed phase, and the bright region is the expanded phase. The scale bar represents 20 μm.
A two-phase coating was observed only when DSPC and PEG40S were used (Figure 3d and e). The light and dark domains indicate the presence of phase coexistence in the bubble shell, as the fluorescent probe (DiI) partitions more strongly in the expanded PEG40-rich phase compared to the condensed DSPC-rich phase.8 In comparison, when only DSPC was used, only one phase was observed. In this case, we observed dark condensed regions with some probe partitioned to the grain boundaries between the crystalline phases (Figure 3f). When only PEG40S was used, only one phase was observed, where the expanded phase into which the fluorescent probe was distributed appears bright (image not shown).
The coalescence rate of microbubbles injected into water using DSPC/PEG40S and only PEG40S in water also strongly depended on the concentration of the lipid and the emulsifier (Figure 4). Our experiments show that increasing the concentration of lipid and emulsifier or emulsifier alone reduces coalescence.
Figure 4.

Coalescence percentage of microbubbles exiting the flow-focusing chamber as a function of PEG40S and DSPC concentrations in water.
Overall, the only other microbubble population observed with long-term stability was obtained using an ∼12-fold increase in DSPC/PEG40S in which the microbubbles were injected into water. The size distribution data at high concentrations of DSPC/PEG40S in water indicated an average diameter of 62 μm with a standard deviation of 6 μm. Because of dissolution, the size of the microbubbles decreased to an average diameter of 50 μm (20% reduction) with a standard deviation of 11 μm in a day and maintained the same average diameter with a standard deviation of 13 μm measured after several months. In comparison, a 25% size reduction occurred immediately for the microbubbles produced using 1X DSPC/PEG40S injected into GPW.
Discussion
It is necessary to prevent microbubble interaction and coalescence in the bubble stream exiting the flow-focusing chamber because the adsorption of the stabilizing bubble coating takes place in this stream. The viscosity of the GPW solution as described in this letter was doubled (∼1.8 mPa) in comparison to that of water (∼0.9 mPa) at 22 °C, possibly accounting for the observed decrease in microbubble coalescence. Indeed, the coalescence time can be increased by as much as 3 orders of magnitude in similar bubble systems by bulk viscosity doubling in a similar viscosity range by decreasing the film drainage rate.9,10 However, there is known to be a counter effect of increasing viscosity by similar magnitudes. That is a weakening of the liquid jet behind the leading bubble, resulting in increased bubble interactions and coalescence.11 These competing mechanisms could result in an optimum and possibly narrow viscosity range whereby we observed ∼50, ∼0, and ∼12% microbubble coalescence at ∼0.9, ∼1.8, and ∼2.1 mPa, respectively, in which the higher viscosity (∼2.1 mPa) was achieved by a combination of GPW and a high concentration of DSPC.
PEG40S appears to be capable of playing a similar role to the viscosity agents in GPW because high concentrations in water are capable of preventing coalescence. Although PEG40S does not significantly alter the bulk viscosity, it should have rapid adsorption kinetics, thus quickly decreasing the surface tension and increasing the surface viscosities. For example, large surface viscosities result in lower film drainage rates.12,13 In addition, the PEG group is a well-known steric stabilizer that may further guard against coalescence. Further study will be required to definitively determine the sources and mechanisms for lowered coalescence observed here.
Microbubbles produced by flow focusing using DSPC/PEG40S have a limited dissolution and resulting long-term stability. In comparison, complete dissolution occurs for microbubbles produced using DSPC alone or PEG40S alone. These differences in dissolution can be attributed to the phase(s) present in the shells, which greatly impact the nucleation of monolayer collapse and thus the minimum surface tension that can be achieved. In particular, it has been shown recently that the presence of both expanded and condensed phases alters monolayer collapse nucleation such that collapse occurs through a folding process and only at approximately zero surface tension.14,15 In the case of the DSPC/PEG40S-coated bubbles, a significant amount of the PEG40S-rich expanded phase persists after Laplace over-pressure-driven dissolution, between the DSPC-rich condensed-phase domains indicative of a zero surface tension shell, whereas only one phase is present for DSPC- or PEG40S-coated bubbles. Despite the fact that DSPC can form condensed-phase low surface tension monolayers,8 they appear not to be reaching the ultralow surface tension necessary for long-term stability (i.e., reduction of the Laplace overpressure to near zero).
Because the interfacial tension of the PEG40S monolayer is higher than that of the DSPC/PEG40S monolayer8 or DSPC monolayer, Ostwald ripening was pronounced in the case of PEG40S-coated microbubbles. The Ostwald ripening rate is directly proportional to interfacial tension.16,17 Ostwald ripening occurs when the smaller microbubbles shrink as a result of their high Laplace pressure and thus create areas of supersaturation in the local environment that cause larger bubbles to grow. However, ultimately, except for the case of the DSPC/PEG40S-coated microbubbles, dissolution was complete within a few hours.
Conclusions
We found here that microbubble coalescence, dissolution, and Ostwald ripening are the major causes of instability of microbubble size distributions formed using flow focusing. We demonstrated that viscosity agents and the concentrations of the lipid and emulsifier play important roles in controlling these processes. Specifically, of the compositions used here only the microbubbles produced using low concentrations of DSPC/PEG40S in GPW solution have a long-lived monodisperse size distribution and do not require large amounts of lipids to be produced. Coalescence, dissolution, and Ostwald ripening were all limited in this case. The next step will be to reduce the microbubble size from ∼50 μm produced here to less than 5 μm with a polydispersity much less than achievable with current methods in order to provide contrast agents with a diameter range optimized for ultrasound imaging. We expect that we will observe similar trends to those observed here, but the exact optimum conditions for stabilization will depend on the microbubble size, velocity, and separation as the bubbles leave the flow-focusing orifice.
Acknowledgment
Funding was provided by the National Institutes of Health through the NIH Roadmap for Medical Research (grant R21 EB005325), the Office of Naval Research Hydromechanics Program (grant N000140510002), and the Center on Polymer Interfaces and Macromolecular Assemblies (grant NSF DMR 0213618).
References
- 1.Klibanov AL. Adv. Drug Delivery Rev. 1999;37:139–157. doi: 10.1016/s0169-409x(98)00104-5. [DOI] [PubMed] [Google Scholar]
- 2.Skyba DM, Kaul S. Coron. Artery Dis. 2000;11:211–9. doi: 10.1097/00019501-200005000-00003. [DOI] [PubMed] [Google Scholar]
- 3.Unger EC, Porter T, Culp W, Labell R, Matsunaga T, Zutshi R. Adv. Drug Delivery Rev. 2004;56:1291–1314. doi: 10.1016/j.addr.2003.12.006. [DOI] [PubMed] [Google Scholar]
- 4.Dayton Paul A, Ferrara Katherine W. J. Magn. Reson. Imaging. 2002;16:362–77. doi: 10.1002/jmri.10173. [DOI] [PubMed] [Google Scholar]
- 5.Ganan-Calvo AM, Gordillo JM. Phys. Rev. Lett. 2001;87:274501/1–274501/4. doi: 10.1103/PhysRevLett.87.274501. [DOI] [PubMed] [Google Scholar]
- 6.Ganan-Calvo AM. Phys. Rev. E. 2004;69:027301/1–027301/3. doi: 10.1103/PhysRevE.69.027301. [DOI] [PubMed] [Google Scholar]
- 7.Borden MA, Longo ML. Langmuir. 2002;18:9225–9233. [Google Scholar]
- 8.Borden MA, Pu G, Runner GJ, Longo ML. Colloids Surf., B. 2004;35:209–223. doi: 10.1016/j.colsurfb.2004.03.007. [DOI] [PubMed] [Google Scholar]
- 9.Sanada T, Watanabe M, Fukano T. Chem. Eng. Sci. 2005;60:5372–5384. [Google Scholar]
- 10.Chesters AK, Hofman G. Appl. Sci. Res. 1982;38:353–61. [Google Scholar]
- 11.Chen L, Li Y, Manasseh R. Proceedings of the Third International Conference on Multi Phase Flow, ICMF'98; Lyon: France. 1998. [Google Scholar]
- 12.Li DJ. Colloid Interface Sci. 1996;181:34–44. [Google Scholar]
- 13.Danov KD, Valkovska DS, Ivanov IB. J. Colloid Interface Sci. 1999;211:291–303. doi: 10.1006/jcis.1998.5973. [DOI] [PubMed] [Google Scholar]
- 14.Duncan PB, Needham D. Langmuir. 2004;20:2567–2578. doi: 10.1021/la034930i. [DOI] [PubMed] [Google Scholar]
- 15.Gopal A, Lee KYC. J. Phys. Chem. B. 2001;105:10348–10354. [Google Scholar]
- 16.Kabalnov AS. Langmuir. 1994;10:680–4. [Google Scholar]
- 17.Taylor P. Adv. Colloid Interface Sci. 1998;75:107–163. [Google Scholar]