Abstract
The image of an object hidden in highly scattering media was reconstructed using a fast, noise-resistant algorithm newly applied to diffusion tomography. A pulsed light source producing scattered and transmitted light is examined at multiple times. Multiple source detector pairs around the medium are used to obtain data in many different directions. An inverse scattering algorithm with nonuniform regularization achieves rapid inversion convergence.
Probing internal structures of highly scattering media using ultrafast optical sources in the visible and near infrared spectral region has many medical, biological, and industrial applications. Radiation in this spectral region is non-ionizing and safe, which is particularly important for medical applications. Images of objects in highly scattering media obtained using conventional steady-state transillumination shadowgram techniques are blurred by strong multiple scattering. These photons are randomized in the scattering media, and the paths they take to traverse through the media are tortuous and lack a clear well-defined pattern. Over the past 10 years, many methods and techniques have been proposed and tested to overcome the multiple scattering problem. With the rapid advance of laser technology and detection techniques, various gating techniques were demonstrated to selectively detect the first and early arriving photons that travel through the turbid medium along and near the straight line path connecting the source and detector, referred to as ballistic and snake signals (1, 2). Frequency domain techniques using intensity modulated (up to 1 GHz) diode laser sources have also been demonstrated for imaging a simple object hidden in a highly scattering medium with limited success (3). The limitation of these methods is that for thick highly scattering media, the useful signal is weak. In highly scattering media, the diffused signal is predominant with intensities many orders of magnitude stronger than the early image carrying light. These methods require many measurements in many directions to obtain a three-dimensional image that may be difficult in practical applications. One alternative method proposed to overcome this problem is to solve an inverse problem using scattered light profiles measured around the media. Diffusion tomography is used since diffusive scattering is the dominant factor in the problem. Both time-resolved data and frequency domain data can be used for reconstruction.
In this paper, we present a fast inversion approach to reconstruction of hidden objects in a highly scattering medium by taking time slices over a large time range of the temporal profiles measured by many source-detector (S-D) pairs around the medium.
Using multi-time-slices from the temporal profiles increases information data by a large factor so that the number of experimental measurements can be greatly reduced. Thus, the advantage of using time resolved data is clear. Time-resolved measurements can give much more information for image reconstruction with better spatial resolution than any frequency domain (fixed at a few frequencies) or steady state measurement scheme for the same number of S-D pairs.
Algorithm
Diffusion theory was used to describe photon migration in this study. The diffusion equation in turbid media is
 |
1 |
where I(r, t) is the photon density field, S(r, t) is the laser light source, μa is the absorption coefficient, D = 1/[3(μa + (1 − g)μs)] is the diffusion coefficient, μs is the scattering coefficient, g is the scattering anisotropic factor, and c is speed of light in the medium. We are interested in the following problem, given the intensity measurements around the media with and without objects, I(r, t) and I0(r, t), reconstruct a spatial map of the change in optical parameters (absorption and diffusion coefficients).
The forward problem of scattering can be represented in matrix form written as
 |
2 |
where Y has M = (number of S-D pairs) × (number of time slices) elements, which is the change in intensity profile and is a function of the position of source rs, the position of detector rd, and the time-slice in the profile t. X has N = (number of voxels) elements, here a voxel is a space grid element. Xj = cΔμa(rj) or cΔD(rj) is the (time-independent) change in the absorption coefficient or the diffusion coefficient in the voxel j due to presence of hidden objects, and n is signal detector noise. W is an M × N matrix. Its element is called the weight function or “photon measurement density functions” (4). Using the following Green’s function formula, for the case of absorption change, cΔμa, the element of W is given by (4)
 |
3a |
 |
where G0(rj, ri, t) is the Green’s function of Eq. 1 for the reference system (the system with no hidden object). In the case of diffusion or scattering change, cΔD, W is given by
 |
3b |
 |
The fractional signal change Y = −(I − I0)/I0, which corresponds to the first order perturbative solution, is often used by others, with the algebraic reconstruction technique (ART) or simultaneous algebraic reconstruction technique (SART), or conjugate gradients (CGD) as inversion reconstruction algorithms (4, 5, 6).
A more accurate nonperturbative approximation based on a cumulant expansion [similar to the Rytov approximation (7)] is used by us, which fits the experimental data using Y = −ln(I/I0). This treatment, to some extent, automatically includes higher order nonlinear contributions.
We develop a novel inverse reconstruction procedure based on Shaw’s iteration formula (8) modified to the form:
 |
4 |
where Y, the signal change as described before, is the input for inversion. X(n) is the nth iterate solution for the change of parameters. The initial value of X is set to zero in the absence of prior information about hidden objects. T means the transpose matrix. The matrix Λ is chosen to be diagonal, Λij = λjδij, λj = 〈nn〉/〈ΔXjΔXj〉, with 〈⋯〉 the statistical average and ΔXj = Xj − 〈Xj〉. Thus, λj represents the ratio of mean square of detector noise to the expected mean square deviation in the change of parameters (structural noise). In our procedure, the matrix Λ regularizes or converts an ill-posed problem to a well-posed problem. The value of Λ is set according to the spatially dependent experimental noise level and the expected structural noise in the change of optical parameters. Such a spatially dependent choice enhances convergence.
Since W does not relate to the position and optical parameters of hidden objects, the inverse matrix [WTW + Λ]−1 of a given reference system (either homogeneous or inhomogeneous) can be precalculated and prestored as a data base, for later clinical application to various patients. The above novel inversion algorithm and use of multi-time-slices was tested using measured experimental temporal data.
Experiment
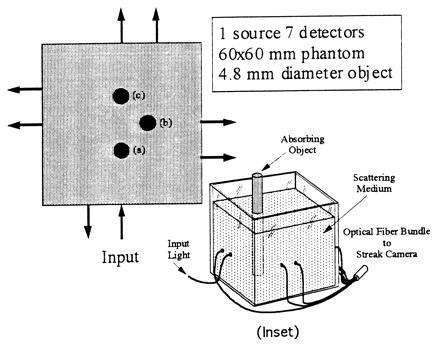
A schematic drawing of the S-D arrangement is shown in Fig. 1. Ultrashort pulses of 100-fs pulse duration at a wavelength of 625 nm were coupled into a rectangular box-shaped random medium by an optical fiber. This geometry is chosen because it is easy to construct an analytical expression of the Green’s function G0 in a finite-sized three-dimensional volume, which is suitable for testing the physical modeling and the inversion algorithm. The scattered pulse signals around the medium were collected by seven optical fibers and time resolved by a streak camera. The size of the sample was 60 × 60 mm and the height was 90 mm. The fibers were located at the mid-plane. The source fiber was at the center of one boundary wall. Two fibers each were placed on the opposite and the side boundary walls of the sample, and one fiber detector was placed on the incident wall. The scattered pulses collected by the seven detection fibers and a reference pulse were coupled onto the input slit of the streak camera for simultaneous detection. The medium was uniform Intralipid solution with a transport mean free path of 2.5 mm and absorption length of about 500 mm. The hidden object was a black painted aluminum rod of diameter of 4.8 mm. Temporal profiles of the scattered pulses around the medium are measured. In this experimental setting of the reference system and the hidden object, the structure was z-independent, so the reconstructed image is presented as a two-dimensional image. However, the method presented in this paper is intrinsically a three-dimensional imaging model.
Figure 1.

A scheme of experimental arrangement of source detector pairs. An absorber was placed at three locations (a, b, and c) inside medium that was 10 mm away from the center of the square. Each fiber pair was 1.25 cm apart, with one at the center of the wall. Inset shows a three-dimensional schematic diagram of the arrangement. [Reprinted with permission from ref. 9 (Copyright 1996, Optical Society of America).]
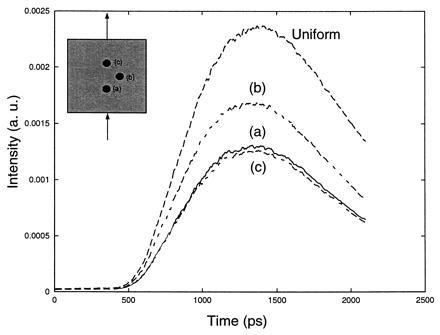
As an example, a typical set of temporal profiles measured for one S-D pair is shown in Fig. 2. In this case, the detector is located straight across the medium in the direction of incidence. Measurements of the uniform medium without the object and with the object placed in three locations 90° from each other are shown. It is clearly shown that the intensity is reduced by introducing the absorbing object, and a larger reduction were observed when the object was placed in the line of the source detector pair. The measurements of three object positions is equivalent to three measurements by rotating S-D pairs 90° while fixing the object location.
Figure 2.

A set of typical experimental temporal profiles of a source detector pair without and with an absorbing object. Curves a, b, and c correspond with the location of absorber at a, b, and c in Fig. 1, respectively. Curve marked uniform was the temporal profile without absorber. The source and the detector were located at the central line of the square on the opposite sides. [Reprinted with permission from ref. 9 (Copyright 1996, Optical Society of America).]
Reconstruction Results
In the image reconstruction, an area in the sample was divided into 28 × 28 voxels which corresponds to an actual voxel size of 2 × 2 mm. Measurements of seven S-D pairs with the above mentioned object locations were used. For each temporal intensity profile, intensity at 40 time slices uniformly distributed from 602 to 2045 ps were used. Thus, a total number of input data points was 21 × 40 = 840. The robustness of the method is demonstrated with a small number of fibers.
Our regularization parameters are spatially dependent:
 |
5 |
Since our distances are measured in (dimensionless) units of pixels, the parameter η it also dimensionless, and chosen by hand to emphasize the larger separations, at which the noise is larger.
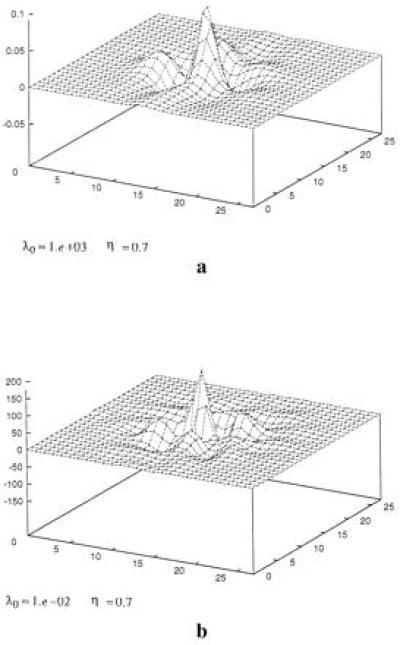
Fig. 3 shows the image of the hidden object obtained with different regularization parameters and different number of iterations. The image of the hidden object has already appeared after a single iteration as shown in Fig. 3a (λ0 = 103). It takes 1 min on a Silicon Graphic Indy R4400 computer, provided [WTW + Λ]−1 is stored. After 500 iterations, a stable image is obtained as shown in Fig. 3b (λ0 = 10−2) by running 1 hr on the same computer. We see that the shape of these two images are similar, but the image in Fig. 3b has better resolution. Noting that these regularization parameters differ by five orders of magnitude, these results confirm the stability our imaging process.
Figure 3.

A comparison of images of two cases. (a) λ0 = 103, after a single iteration, a useful image is obtained by running 1 min on a Silicon Graphic Indy R4400 computer. (b) λ0 = 10−2, with 500 iterations, the image is obtained by running 1 hr on the same computer.
In both cases, the presence of an absorber can be clearly seen in the figure. The location of the maximum change is about 7 mm away from the center, which is about the actual location of the object (10 mm). The full-width at half maximum of the absorber in case 1 is about 8 mm, which is comparable to the diameter of the object (4.8 mm). It is about 4–5 mm in case 2. The fluctuation at other spatial locations are less than one third of the peak value. One reason that the center of the image deviates from that of the experimental set, we think, is that the hidden object is not a pure transparent scattering absorber, and the possible effect of reflection on the surface of the rod was not included in our physical model, Eq. 3a.
Our algorithm is also tested by simulated input data with noise level up to ±15%, the image with correct positions of simulated hidden objects is obtained using proper regularization. This shows that the inversion procedure is noise-resistant.
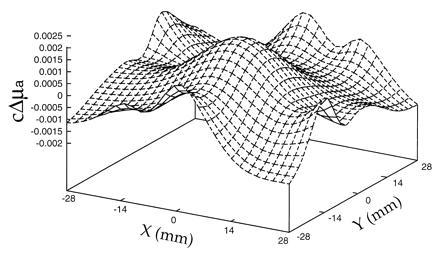
For comparison, the result using the simultaneous algebraic reconstruction technique inversion algorithm commonly used by others on the same time resolved data after 100 iterations (taking X = 0 as a initial input), which runs 3 hr on the same Silicon Graphics workstation, is shown in Fig. 4. There is no clear image of the absorber. Please note that the maximum absorption coefficients is only 0.0025 which is much smaller than that obtained by our new algorithm.
Figure 4.

Reconstructed image of an absorber hidden in a highly scattering medium using experimental temporal profiles based on simultaneous algebraic reconstruction technique (after 100 iterations, initial value X = 0). Computation time is about 3 hr on a Silicon Graphics workstation.
Our success in image reconstruction of a hidden object in scattering media shown here demonstrates that:
(i) taking multiple time slices of temporal experimental profiles accumulates experimental data much more quickly than other methods, as is needed in high spatial resolution imaging;
(ii) precalculating the part of the inversion relating to the reference system, and storing it as a data base, permits later imaging at cheap cost in nearly real-time;
(iii) using large regularization, one can obtain an image in a fast and noise resistant way, that is useful for fast diagnostic; and
(iv) using small regularization and iterations, one can also obtain an image with better resolution, that may be used for a more detailed diagnostic application.
Acknowledgments
This work is supported in part by National Aeronautics and Space Administration, Office of Naval Research, Army Research Office, New York State Technology Foundation, and Mediscience Technology Corp.
Footnotes
The publication costs of this article were defrayed in part by page charge payment. This article must therefore be hereby marked “advertisement” in accordance with 18 U.S.C. §1734 solely to indicate this fact.
Abbreviation: S-D, source-detector.
References
- 1.Alfano R R, Liang X, Wang L M, Ho P P. Science. 1994;264:1913–1915. doi: 10.1126/science.264.5167.1913. [DOI] [PubMed] [Google Scholar]
- 2.Huang D, Swanson E A, Lin C P, Schuman J S, Stinson W G, Chang W, Hee M R, Flotte T, Gregory K, Puliafito C A, Fujimoto J G. Science. 1991;254:1178–1181. doi: 10.1126/science.1957169. [DOI] [PMC free article] [PubMed] [Google Scholar]
- 3.Chance B, Kang K, He L, Weng J, Sevick E. Proc Natl Acad Sci USA. 1993;90:3423–3427. doi: 10.1073/pnas.90.8.3423. [DOI] [PMC free article] [PubMed] [Google Scholar]
- 4.Arridge, S. R. (1993) in Medical Optical Tomography: Functional Imaging and Monitoring, ed. Muller, G. SPIE Vol. IS11, pp. 31–64.
- 5.Singer J R, Grunbaum F A, Kohn P D, Zubelli J P. Science. 1993;248:990–993. doi: 10.1126/science.248.4958.990. [DOI] [PubMed] [Google Scholar]
- 6.Das B B, Dolne J J, Barbour R L, Graber H L, Chang J, Zevallos M, Liu F, Alfano R R. SPIE. 1995;2389:16–28. [Google Scholar]
- 7.Ishimaru A. Wave Propagation and Scattering in Random Media. New York: Academic; 1978. [Google Scholar]
- 8.Shaw C B., Jr J Math Anal Appl. 1972;37:83–112. [Google Scholar]
- 9.Cai W, Das B B, Liu F, Zevallos M, Lax M, Alfano R R. In: OSA TOPS on Advances in Optical Imaging and Photon Migration. Alfano R R, Fujimoto J G, editors. Vol. 2. Washington, DC: Optical Soc. Am.; 1996. pp. 269–275. [Google Scholar]


