

Abstract
The energetic profiles of a significant number of protein-DNA systems at 20°C reveal that, despite comparable Gibbs free energies, association with the major groove is primarily an enthalpy driven process, whereas binding to the minor groove is characterized by an unfavorable enthalpy that is compensated by favorable entropic contributions. These distinct energetic signatures for major versus minor groove binding are irrespective of the magnitude of DNA bending and/or the extent of binding-induced protein refolding. The primary determinants of their different energetic profiles appear to be the distinct hydration properties of the major and minor grooves, namely that the water in the AT-rich minor groove is in a highly ordered state and its removal results in a substantial positive contribution to the binding entropy. Since the entropic forces driving protein binding into the minor groove are a consequence of displacing water ordered by the regular arrangement of polar contacts, they cannot be regarded as hydrophobic.
Keywords: DNA binding, DNA grooves, hydration, thermodynamics, electrostatics
Structural and energetic characterizations of protein-nucleic acid complexes are important for a better understanding of the molecular interactions that govern transcriptional regulation. Of particular importance are the energetic profiles of DNA binding domains (DBDs) interacting with their target recognition sites. DBDs are known to interact specifically with either the major or minor grooves of DNA, with binding-induced structural effects ranging from negligible perturbation of the B-DNA conformation to substantial distortions, such as bending and kinking. One can then ask if there are qualitative differences in the forces driving protein binding to the different grooves of DNA. Comparing the association constants of these two types of DBDs does not furnish a satisfactory answer, since both categories contain examples of stronger and weaker binding interactions. An answer to this question therefore requires a detailed analysis of the forces involved in the formation of the specific protein-DNA complexes. This assumes not only measurement of the association constant but also determination of the Gibbs energy and its enthalpic and entropic components over a broad range of conditions, particularly temperature and ionic strength. In this review, we analyze the thermodynamic characteristics of protein binding to DNA published over the last several years. This overall consideration has revealed qualitative differences in the energetic signatures of binding to the minor and the major grooves of DNA, indicating intrinsic differences between the grooves.
Methodology
Studying the binding reaction at different temperatures is necessary since the state of the reaction components depends on temperature and this is particularly true for DNA-binding proteins, which in their unbounded state are usually not highly stable but partly unfolded even at ambient temperatures.1-7 Association with DNA results in their refolding (Figure 1a) and this has to be taken into account in order to correlate the binding characteristics with structural information obtained for the complexes with fully folded proteins (Figure 1b). Correction for refolding is particularly important when comparing the binding of various proteins, which in their free unbound state differ somewhat in stability, i.e. the extent of unfolding under the conditions of the binding experiments. Correction for refolding can be made in practice using differential scanning calorimetric (DSC) data on the partial heat capacities of the reacting species over the temperature range in which unfolding of the free protein occurs.7,8 Figure 1b illustrates that correction for refolding linearizes the binding enthalpy dependence on temperature and can considerably change the magnitude of the enthalpy and its dependence on temperature, i.e. the heat capacity effect of binding. The binding Gibbs free energies do not require correction for refolding since the free energy of temperature-induced conformational changes of proteins at nearly ambient temperatures are usually small and may be neglected. Correspondingly, the binding entropy (derived from the difference between the Gibbs free energy and the corrected binding enthalpy) is also corrected for protein refolding. Therefore, calorimetry has principal importance in studying the energetics of protein-DNA interaction.
Figure 1.
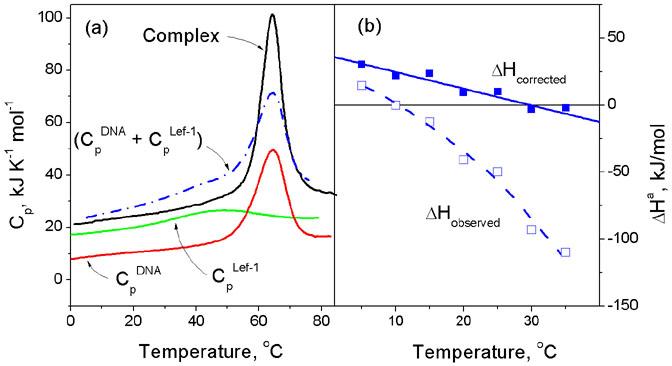
(a) The heat capacity functions of a typical DBD, the HMG box from LEF-1, its target DNA duplex and their complex, determined by differential scanning calorimetry (DSC). This shows that the protein starts to unfold from very low temperatures but on association with DNA it refolds and forms a stable complex that dissociates and unfolds cooperatively at about 62°C. The heat of protein refolding at any given temperature can be determined by integrating the differences between the summed heat capacity of the free protein and DNA (Blue dot-dash line) and the observed heat capacity of the complex (Black solid line). (b) The observed enthalpy of association of the HMG box from LEF-1 with its target DNA measured by isothermal titration calorimetry (ITC) and the function corrected for heats of protein refolding upon binding: the corrected function corresponds to the enthalpy of association of the fully folded DBD with the DNA. For details see4,7.
Investigation of the effect of ionic strength is necessary in studying the interaction of such highly charged molecules as DNA and DNA-binding proteins in order to assess the contribution of electrostatic forces in this process.9-11 Since specific protein-DNA complexes are characterized by below micromolar dissociation constants, investigation of their interaction requires use of very dilute solutions and can be studied only by various optical methods sensitive for binding (e.g. fluorescence anisotropy or FRET titration). Analysis of the optically obtained binding isotherms (Figure 2a) permits determination of the binding constant (Ka) and its dependence on the ionic strength (Figure 2b). The dependences of the logarithm of the association constants, log(Ka) on the logarithm of the salt concentration is effectively described by the linear equation: log(Ka) = log(Knel)-N·log[Salt]. The first term results from the non-electrostatic interactions between protein and DNA and the second term, reflects the entropy of mixing the released counterions with the ions in bulk solution.9,12 This salt-dependent second term does not depend on temperature2,13,14 and determines the electrostatic component of protein-DNA interactions. Extrapolating log(Ka) function to log[Salt]=0, where the second term vanishes, one can determine the non-electrostatic component of the Gibbs energy of association, ΔGnel = -2.3RTlog(Knel) and then the electrostatic component of the Gibbs energy of association as ΔGel = ΔGa-ΔGnel. The later is equivalent to -TΔSel since enthalpy of electrostatic interactions is zero.2,13,14 The non-electrostatic association entropy factor is then obtained from the relation, TΔSnel=TΔSa-TΔSel.
Figure 2.
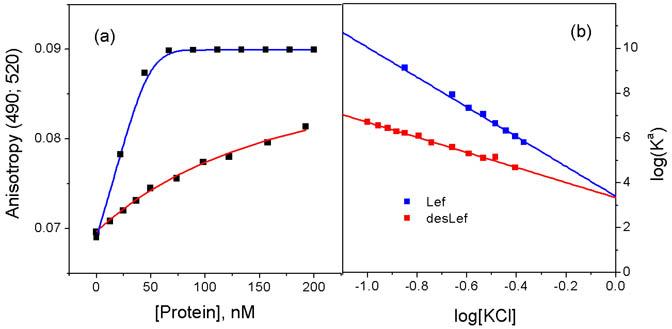
(a). Binding isotherms of the HMG box from Lef-1 (Lef86) and its truncated form lacking the 8-residue C-terminal extension (Lef79), measured by fluorescence anisotropy titration.4 These provide the value of the association constant, Ka and thus the Gibbs free energy of association, ΔGa(T) = -RTln(Ka). Using the ITC-measured enthalpy of association, after correction for refolding, one can then determine then the binding entropy factor, TΔSa(T)=ΔHa(T)-ΔGa(T). (b) The dependences of the logarithm of the association constants, log(Ka), on the logarithm of the salt concentration is effectively described by the linear equation: log(Ka) = log(Knel)-N·log[Salt]. The first term results from the non-electrostatic interactions between protein and DNA and the second salt dependent term represents the electrostatic component of protein-DNA interaction. Extrapolating this function to log[Salt]=0, where the second term becomes zero, one can determine the non-electrostatic component of the Gibbs energy of association, ΔGnel = -2.3RTlog(Knel). In this example ΔGnel is virtually identical for Lef86 and Lef79, demonstrating that the C-terminal extension of Lef86 makes only electrostatic interactions with the DNA.
Thermodynamic parameters of protein-DNA interactions
The energetics of association of various DNA-binding proteins with their target DNAs have been studied calorimetrically by many groups over the years.2-6,15-30 For the present analysis, we have selected data obtained under similar conditions (20°C, near neutral pH, 100 mM NaCl) and analyzed by the same approach, namely correcting for refolding effects and resolving the electrostatic and non-electrostatic components of the binding characteristics, as outlined in Figures 1 and 2. All these data are illustrated in Figure 3 and summarized in Table 1 in Supplementary Materials.
Figure 3.
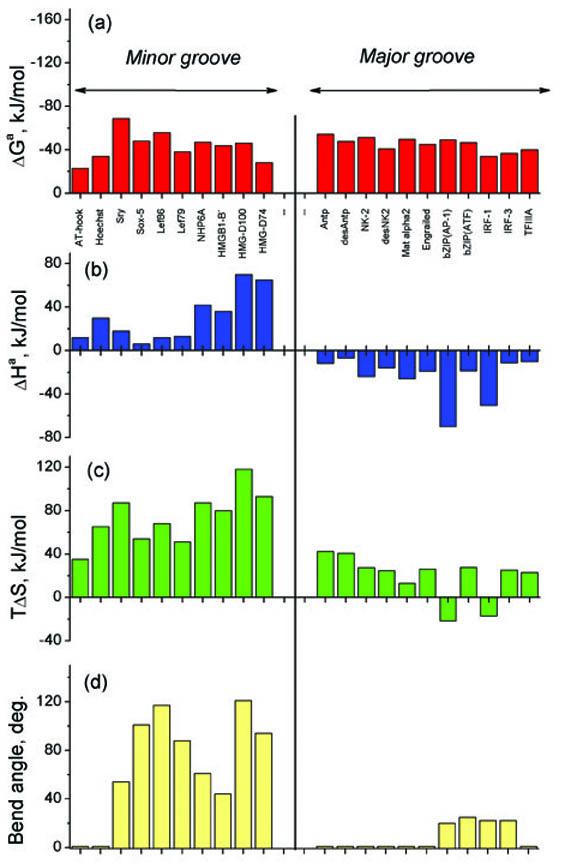
The thermodynamic parameters of association for various DBDs to the major and minor grooves of DNA: (a) The Gibbs energies of association; (b) The enthalpies of association; (c) The entropy factors of association; (d) The DNA bending angles. For the numerical values and the source of the data, see Table 1 in Supplementary Material.
Inspection of the data reveals no dramatic differences in the Gibbs free energies of protein binding to the major and minor grooves of DNA (Figure 3a). Therefore, a particularly striking is the systematic qualitative difference in binding enthalpies for the two grooves (Figure 3b). Specifically, the enthalpies of binding to the minor groove are always positive, while the enthalpies of binding to the major groove are invariably negative. Positive binding enthalpies have been reported by other authors for minor groove DBDs including: Sso7d,20 a thermophilic TATA box binding protein15,22 and Sac7d.24,25 Conversely, negative binding enthalpies have been reported for other major groove DBDs including: the λcI repressor,26 cMyb,23 trp repressor,18 MM17, a ‘single chain dimer’ of transcription factor MASH-130 and the double homeobox Oct1.21
Since the Gibbs free energies of binding at 20°C do not vary greatly, the enthalpy differences are essentially balanced by entropic factors. Indeed, the entropic contribution (i.e. TΔS) of minor groove binding is significantly larger in magnitude than that of major groove binding (Figure 3c). Positive entropies have also been reported for binding of small molecules to the minor groove of DNA, in contrast with drug intercalators for which binding is typically enthalpy-driven (for a recent review see reference31).
The initial observation of a different sign in the enthalpies first arose when comparing the unfavorable enthalpy of the minor groove DBD from Sox-5 with the favorable enthalpies measured for major groove DBDs,7 a finding which at the time was interpreted as reflecting the work required to bend DNA and has been corroborated by other groups.24,32 Recent studies on additional protein-DNA systems now suggest that this interpretation is not always warranted. In fact, attempts to establish a correlation for the magnitudes of DBD-induced bending reveal that the enthalpies do not simply scale with the bending angles, as seen from Figure 3d. For example, Lef-86 bends DNA by 117 degrees yet exhibits a binding enthalpy of only +10 kJ/mol.4 The AT-hook and Hoechst interactions are even more striking in that neither bends DNA, although both bind deeply in the minor groove with association enthalpies of +15 and +30 kJ/mol, respectively.2,33 Studies of several Sac7d mutants that differ in the number of intercalating residues in the DNA minor groove clearly demonstrate that while such binding events induce a range of DNA bending angles (52 to 68 deg),34 their association enthalpies are similar (∼ +35 kJ/mol) at 20 °C.25 The finding that binding enthalpies do not obviously scale with bending angles is evident when comparing the association of sequence-specific HMG box DBDs with sub-optimal (as opposed to cognate) DNA sequences: an overall reduction in bending angle is accompanied by an increased positive binding enthalpy.4
These comparisons suggest that the work required to bend DNA cannot represent the main source of the positive enthalpy associated with protein/ligand binding to the minor groove. The only other possible source of such a large positive enthalpy is the removal of water and/or specifically bound ions from the protein/DNA interface. Specifically bound ions have been observed crystallographically in the AT-rich minor groove of DNA in flash-frozen samples at very low temperatures.35,36 More appropriate to the present solution conditions, NMR measurements conducted at ambient temperatures clearly demonstrate that the occupancy of DNA by Na+ ions is not high, comprising about 0.5 ion per AT-tracts in 0.2 M NaCl at 4 °C, and decreases to 0.2 per AT-tract at temperature increasing to 27 °C.37 Thus, removal of these ions might be associated with a positive enthalpy. However, even if we assume that the enthalpy of removing a single ion is similar to that of releasing one water molecule (i.e., approximately 6 kJ/mol), the Na+ occupancy of the AT-tract is so low that ion displacement into the bulk solution cannot explain the large positive enthalpy of protein binding to the minor groove. It appears therefore that unlike what occurs in the major groove, the enthalpy of dehydrating the minor groove far exceeds the favorable enthalpic contributions from newly formed binding interactions. This conclusion is strongly supported by the observed protein-DNA binding entropies, particularly their non-electrostatic component.
Components of the binding entropy
The binding entropy consists of electrostatic and non-electrostatic components, the first of which arises from the release of counterions from the DNA phosphates and their mixing with ions into bulk solution.9,10 Accordingly, this electrostatic component enhances the affinity but not the specificity of binding, which is determined by the non-electrostatic component. This non-electrostatic component of the binding entropy (corrected for protein refolding) includes a negative contribution resulting from the decrease in translational/rotational degrees of freedom,38 and the changes in hydration of the reaction components. The non-electrostatic entropy resulting from the dehydration of contacting groups is positive, but a negative contribution arises if binding also results in incorporation of water at the newly formed interface.39-44
Figure 4 illustrates that binding to the minor groove proceeds with large positive non-electrostatic entropies, while binding to the major groove is characterized in most cases by small negative non-electrostatic entropies. Since the entropies associated with the decrease of translational/rotational freedom are similar for both categories, the only possible explanation for the large differences in the corrected for refolding non-electrostatic entropies of binding to the two grooves of DNA is the nature of their hydration.
Figure 4.
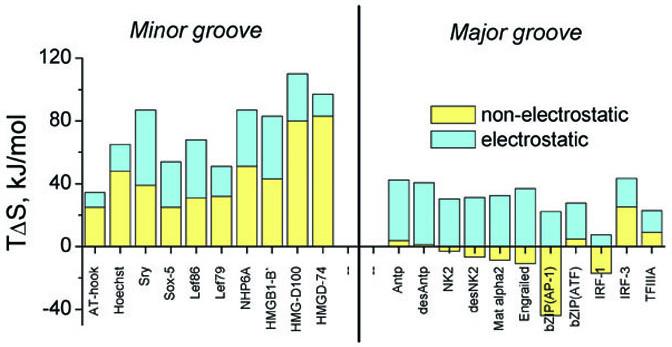
The non-electrostatic and electrostatic components of the entropy factors for binding of the DBDs to the major and minor grooves of DNA at 20°C in 100 mM NaCl. For both categories, the electrostatic component is in blue and the non-electrostatic in yellow. For references and details, see the legend to Figure 3
There is indeed evidence that water is incorporated in the interfaces of certain homeodomain/DNA39-43 and IRF/DNA complexes.44 However, the value of the negative non-electrostatic entropy and enthalpy in most of these cases is rather small for assuming that water incorporation is associated with complex formation: the bound water found in these complexes is likely to be bound also in the free state of the protein and DNA. The only cases among those considered for which water ordering seems to occur upon complex formation are the bZIP/AP-1 and IRF1 complexes which proceed with a large negative enthalpy and entropy (Figure 3 b and c).5,45 In the case of the minor groove, judging from the predominance of AT sequences among its DBD binding sites and bearing in mind the absence of the 2-amino group in adenosine (relative to guanosine), it is argued that this groove is more apolar than the major groove. Furthermore, it is known that apolar groups promote water ordering.46-49 It is therefore tempting to assume that the large positive non-electrostatic entropy of protein binding to the minor groove results from the dehydration of apolar groups on forming hydrophobic contacts between protein and DNA. This hypothesis, however, does not explain the large positive enthalpy of binding to the minor groove since the enthalpy of formation of hydrophobic contacts is known to be close to zero at ∼20 °C.48,49 Analysis of the heat capacity effects of association also shows that it is not the formation of hydrophobic contacts that gives rise to the large positive non-electrostatic entropy.
Heat capacity effects of protein-DNA association
The heat capacity effect of protein-DNA association is invariably negative, as illustrated for the binding of λcI repressor,26 c-Myb23 and Oct121 to the major groove, as well as for the binding of TBP,22 Sso7d20 and Sac7d24 to the minor groove. However, the net heat capacity effect due to binding-induced surface dehydration can only be properly evaluated following correction for protein refolding: this correction can result in changes not only in the magnitude of ΔCp (see Figure 1b) but even in its sign.3,4 For comparative analysis of the role of binding-induced dehydration, the observed heat capacity effects have been normalized per square Angstrom of interfacial surface area since this varies substantially among the different protein-DNA complexes. Figure 5 presents surface-normalized ΔCp values for the association of folded DBDs lacking long charged extensions (thereby excluding NHP6A, HMGB1-B’, HMG-D100, and Lef86 from the analysis), since such extensions contribute a large positive ΔCp component arising from multiple electrostatic interactions with DNA phosphates.3,4 The DNA binding helices of the GCN4 bZIP dimer are also highly charged, likewise resulting in a substantial positive contribution to ΔCp.5, and consequently have been removed from the analysis depicted in Figure 5.
Figure 5.
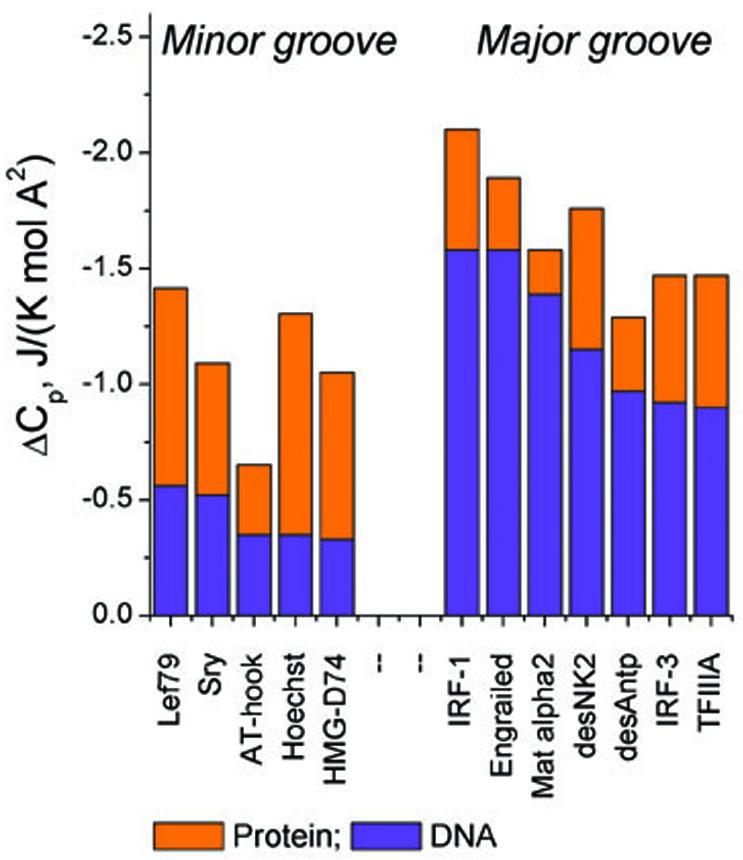
Surface-normalized heat capacities of binding calculated from ΔASA values for dehydration of the DBDs (in orange) and those for the DNA (in blue), the latter obtained by subtracting the calculated heat capacity for the DBDs from their experimental ΔCp values. The observed heat capacity values are obtained from the references listed in the legend to Figure 3.
At first glance, an overall negative heat capacity change for both minor and major groove DBDs seems to support the assumption that in both cases protein binding results in extensive dehydration of apolar rather than polar groups, since it is well known that the dehydration of apolar groups results in negative heat capacity effects, in contrast to polar groups for which the heat capacity effects of dehydration are positive.48,49 Of particular interest, however, are the individual contributions from protein and DNA to the overall measured heat capacity effect of complex formation. The heat capacity changes associated with the dehydration of proteins are well described by changes in the water accessible surfaces areas (ΔASA) of polar and apolar groups.50 However, this approach cannot be used to estimate the heat capacity effects from the DNA, since the heat capacity changes associated with the dehydration of DNA groups have not been rigorously characterized to date. The only way therefore to derive the heat capacity effects of DNA dehydration is to calculate the contribution from protein dehydration and subtract it from the observed total ΔCp (see Table 2 in Supplementary Material).
The resultant partitioned ΔCp values presented in Figure 5 for several complexes of known structure reveal a number of unprecedented findings. The heat capacity change due to dehydration of the DBDs is always negative but its overall magnitude is significantly larger for minor groove DBDs, reflecting the fact that the interacting surface of minor groove DBDs is more hydrophobic than that of major groove DBDs. The contributions of DNA are not similar to those of the proteins, a finding which appears counterintuitive considering the complementarity of their contacting surfaces: the heat capacity effect of dehydrating the major groove is much larger than that of the protein, whereas the opposite effect is observed for minor groove binding. Thus, despite the fact that the minor groove is more apolar than the major groove, the surface normalized heat capacity effect of its dehydration is substantially less than that of the major groove (see also Table 2 in Supplementary Material). It appears therefore that the water displaced from the minor groove has a substantially lower heat capacity than that of bulk water. This would be the case if such water is in an ice-like state since the heat capacity of ice is about half that of liquid water.
Hydration of the DNA grooves
The presumption that water ordering in the AT-rich minor groove differs significantly from water hydrating the major groove has been a subject of discussion for quite some time.51,52 The presence of a spine of well-ordered water molecules in the minor groove of AT-rich DNA sequences has been derived from high-resolution X-ray crystallography and neutron diffraction studies.36,53-55 The minor groove is unusually narrow in AT stretches and a primary shell of water molecules runs across the groove, bridging acceptor sites on adjacent AT/TA base pairs (Figure 6). A secondary shell of waters runs along the groove, donating H-bonds to the primary shell of oxygen atoms that assume the tetrahedral coordination characteristic of ice.54 There is further evidence of an ‘outer spine’ of third and fourth-shell water molecules in a pattern of fused hexagons.56,57 Exchange of the bound water with bulk solvent has been studied by NMR and its residence time is longer than that of water residing in the major groove.58,59 Studies of the interaction of bisbenzimide with DNA reveal that the dielectric constant in the minor groove is less than that estimated for the major groove, consistent with stronger hydrogen bonding in the minor groove.60,61 In the major groove, the distribution of H-bond donors and acceptors exhibit greater irregularity than in the minor groove, and no regular water superstructure has been identified.54
Figure 6.
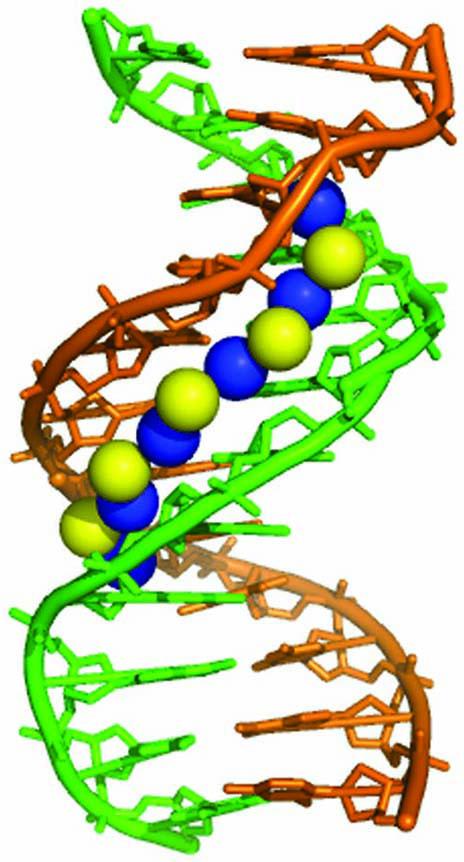
Display of primary (blue) and secondary (yellow) layers of the spine of water in the minor groove of the X-link dodecamer CGCAATTCGCG generated from the coordinates of NDB accession number bd0008.54 A similar structure has been obtained for the identical DNA sequence in Ref.36
Based on the assumption that the water hydrating the minor groove of AT-rich DNA is more ordered than the water hydrating the major groove, its removal is expected to require a greater enthalpy and thereby provide a larger entropy increase than removal of water hydrating the major groove. If water in the AT-rich minor groove is in an “ordered,” ice-like state and its removal requires about 6 kJ·mol-1 (the heat of melting ice at 0 °C), the loss of 11 water molecules coordinated in the first and second layers of the 7 bp binding site of an HMG DBD (i.e. 6 in the first hydration layer and 5 in the second),52 would require approximately 70 kJ·mol-1 of enthalpy at 20°C, the temperature at which the enthalpy of formation of hydrophobic contacts is zero.48,50 This value is in remarkable agreement with that observed for binding of the non-sequence-specific HMG-D74 DBD to the minor groove (Figure 3b), an interaction involving relatively few hydrogen bonds.62,63 Sequence-specific HMG box complexes on the other hand, have a more densely packed interface with a greater number of hydrogen bonds.4 Association of DNA with these DBDs is therefore characterized by negative enthalpic and conformational entropic components, which counterbalance the effects of binding-induced dehydration. Consequently, smaller positive binding enthalpies (Figure 3b) and non-electrostatic entropies (Figure 4) are observed for sequence-specific HMG box minor groove interactions.4
Conclusions
Inspection of the thermodynamic data summarized herein on structurally characterized protein-DNA and drug-DNA complexes reveals a clear qualitative difference in the energetic signatures of binding to the major and minor grooves that appears to be a consequence of their distinct hydration properties. It is important to note that protein binding to the minor groove, as well as the binding of small molecules to this groove,31 occurs principally at AT-rich DNA sequences, the latter corresponding to those very regions in which water ordering is the most prevalent. The consequence of this is that minor groove binding is normally driven by the very large entropy of releasing the ordered water, despite an unfavorable enthalpy. However, this does not represent a hydrophobic force since water ordering in the AT-rich minor groove is determined not by the apolar groups of the DNA but by the regular arrangement of its polar groups that stabilize the ice-like organization of the water in this groove.36,53-55 Further investigation of the state of hydration in the DNA grooves is thus of primary importance for a more complete understanding of the mechanisms of protein binding to DNA.
Supplementary Material
Footnotes
Publisher's Disclaimer: This is a PDF file of an unedited manuscript that has been accepted for publication. As a service to our customers we are providing this early version of the manuscript. The manuscript will undergo copyediting, typesetting, and review of the resulting proof before it is published in its final citable form. Please note that during the production process errors may be discovered which could affect the content, and all legal disclaimers that apply to the journal pertain.
References
- 1.Wright PE, Dyson HJ. Intrinsically unstructured proteins: re-assessing the protein structure-function paradigm. J. Mol. Biol. 1999;293:321–331. doi: 10.1006/jmbi.1999.3110. [DOI] [PubMed] [Google Scholar]
- 2.Dragan AI, Liggins JR, Crane-Robinson C, Privalov PL. The energetics of specific binding of AT-hooks from HMGA1 to target DNA. J. Mol. Biol. 2003;327:393–411. doi: 10.1016/s0022-2836(03)00050-0. [DOI] [PubMed] [Google Scholar]
- 3.Dragan AI, Klass J, Read C, Churchill ME, Crane-Robinson C, Privalov PL. DNA binding of a non-sequence-specific HMG-D protein is entropy driven with a substantial non-electrostatic contribution. J. Mol. Biol. 2003;331:795–813. doi: 10.1016/s0022-2836(03)00785-x. [DOI] [PubMed] [Google Scholar]
- 4.Dragan AI, Read CM, Makeyeva EN, Milgotina EI, Churchill ME, Crane-Robinson C, Privalov PL. DNA Binding and Bending by HMG Boxes: Energetic Determinants of Specificity. J. Mol. Biol. 2004;343:371–393. doi: 10.1016/j.jmb.2004.08.035. [DOI] [PubMed] [Google Scholar]
- 5.Dragan AI, Frank L, Liu Y, Makeyeva EN, Crane-Robinson C, Privalov PL. Thermodynamic Signature of GCN4-bZIP Binding to DNA Indicates the Role of Water in Discriminating Between the AP-1 and ATF/CREB Sites. J. Mol. Biol. 2004;343:865–878. doi: 10.1016/j.jmb.2004.08.101. [DOI] [PubMed] [Google Scholar]
- 6.Dragan AI, Li Z, Makeyeva EN, Milgotina EI, Liu Y, Crane-Robinson C, Privalov PL. Forces driving the binding of homeodomains to DNA. Biochemistry. 2006;45:141–151. doi: 10.1021/bi051705m. [DOI] [PubMed] [Google Scholar]
- 7.Privalov PL, Jelesarov I, Read CM, Dragan AI, Crane-Robinson C. The energetics of HMG box interactions with DNA: Thermodynamics of the DNA binding of the HMG box from mouse Sox-5. Journal of Molecular Biology. 1999;294:997–1013. doi: 10.1006/jmbi.1999.3285. [DOI] [PubMed] [Google Scholar]
- 8.Privalov GP, Privalov PL. Problems and prospects in microcalorimetry of biological macromolecules. Methods Enzymol. 2000;323:31–62. doi: 10.1016/s0076-6879(00)23360-0. [DOI] [PubMed] [Google Scholar]
- 9.Manning GS. The molecular theory of polyelectrolyte solutions with applications to the electrostatic properties of polynucleotides. Q. Rev. Biophys. 1978;11:179–246. doi: 10.1017/s0033583500002031. [DOI] [PubMed] [Google Scholar]
- 10.Record MT, Jr., Anderson CF, Lohman TM. Thermodynamic analysis of ion effects on the binding and conformational equilibria of proteins and nucleic acids: the roles of ion association or release, screening, and ion effects on water activity. Q. Rev. Biophys. 1978;11:103–178. doi: 10.1017/s003358350000202x. [DOI] [PubMed] [Google Scholar]
- 11.Record MT, Jr., Ha JH, Fisher MA. Analysis of equilibrium and kinetic measurements to determine thermodynamic origins of stability and specificity and mechanism of formation of site-specific complexes between proteins and helical DNA. Methods Enzymol. 1991;208:291–343. doi: 10.1016/0076-6879(91)08018-d. [DOI] [PubMed] [Google Scholar]
- 12.Record MT, Jr., Zhang W, Anderson CF. Analysis of effects of salts and uncharged solutes on protein and nucleic acid equilibria and processes: a practical guide to recognizing and interpreting polyelectrolyte effects, Hofmeister effects, and osmotic effects of salts. Adv. Protein Chem. 1998;51:281–353. doi: 10.1016/s0065-3233(08)60655-5. [DOI] [PubMed] [Google Scholar]
- 13.Anderson CF, Record MT., Jr. Salt-nucleic acid interactions. Annu. Rev. Phys. Chem. 1995;46:657–700. doi: 10.1146/annurev.pc.46.100195.003301. [DOI] [PubMed] [Google Scholar]
- 14.Lohman TM, Dehaseth PL, Record MT., Jr. Pentalysine-deoxyribonucleic acid interactions: a model for the general effects of ion concentrations on the interactions of proteins with nucleic acids. Biochemistry. 1980;19:3522–3530. doi: 10.1021/bi00556a017. [DOI] [PubMed] [Google Scholar]
- 15.Bergqvist S, Williams MA, O’Brien R, Ladbury JE. Heat capacity effects of water molecules and ions at a protein-DNA interface. J. Mol. Biol. 2004;336:829–842. doi: 10.1016/j.jmb.2003.12.061. [DOI] [PubMed] [Google Scholar]
- 16.Carra JH, Privalov PL. Energetics of folding and DNA binding of the MAT alpha 2 homeodomain. Biochemistry. 1997;36:526–535. doi: 10.1021/bi962206b. [DOI] [PubMed] [Google Scholar]
- 17.Kozlov AG, Lohman TM. Adenine base unstacking dominates the observed enthalpy and heat capacity changes for the Escherichia coli SSB tetramer binding to single-stranded oligoadenylates. Biochemistry. 1999;38:7388–7397. doi: 10.1021/bi990309z. [DOI] [PubMed] [Google Scholar]
- 18.Ladbury JE, Wright JG, Sturtevant JM, Sigler PB. A thermodynamic study of the trp repressor-operator interaction. J. Mol. Biol. 1994;238:669–681. doi: 10.1006/jmbi.1994.1328. [DOI] [PubMed] [Google Scholar]
- 19.Liggins JR, Privalov PL. Energetics of the specific binding interaction of the first three zinc fingers of the transcription factor TFIIIA with its cognate DNA sequence. Proteins Suppl. 2000;4:50–62. doi: 10.1002/1097-0134(2000)41:4+<50::aid-prot50>3.3.co;2-8. [DOI] [PubMed] [Google Scholar]
- 20.Lundback T, Hansson H, Knapp S, Ladenstein R, Hard T. Thermodynamic characterization of non-sequence-specific DNA-binding by the Sso7d protein from Sulfolobus solfataricus. J. Mol. Biol. 1998;276:775–786. doi: 10.1006/jmbi.1997.1558. [DOI] [PubMed] [Google Scholar]
- 21.Lundback T, Chang JF, Phillips K, Luisi B, Ladbury JE. Characterization of sequence-specific DNA binding by the transcription factor Oct-1. Biochemistry. 2000;39:7570–7579. doi: 10.1021/bi000377h. [DOI] [PubMed] [Google Scholar]
- 22.O’Brien R, DeDecker B, Fleming KG, Sigler PB, Ladbury JE. The effects of salt on the TATA binding protein-DNA interaction from a hyperthermophilic archaeon. J. Mol. Biol. 1998;279:117–125. doi: 10.1006/jmbi.1998.1743. [DOI] [PubMed] [Google Scholar]
- 23.Oda M, Furukawa K, Ogata K, Sarai A, Nakamura H. Thermodynamics of specific and non-specific DNA binding by the c-Myb DNA-binding domain. J. Mol. Biol. 1998;276:571–590. doi: 10.1006/jmbi.1997.1564. [DOI] [PubMed] [Google Scholar]
- 24.Peters WB, Edmondson SP, Shriver JW. Thermodynamics of DNA binding and distortion by the hyperthermophile chromatin protein Sac7d. J. Mol. Biol. 2004;343:339–360. doi: 10.1016/j.jmb.2004.08.042. [DOI] [PubMed] [Google Scholar]
- 25.Peters WB, Edmondson SP, Shriver JW. Effect of mutation of the Sac7d intercalating residues on the temperature dependence of DNA distortion and binding thermodynamics. Biochemistry. 2005;44:4794–4804. doi: 10.1021/bi047382w. [DOI] [PubMed] [Google Scholar]
- 26.Merabet E, Ackers GK. Calorimetric analysis of lambda cI repressor binding to DNA operator sites. Biochemistry. 1995;34:8554–8563. doi: 10.1021/bi00027a005. [DOI] [PubMed] [Google Scholar]
- 27.Takeda Y, Ross PD, Mudd CP. Thermodynamics of Cro protein-DNA interactions. Proc. Natl. Acad. Sci. U. S. A. 1992;89:8180–8184. doi: 10.1073/pnas.89.17.8180. [DOI] [PMC free article] [PubMed] [Google Scholar]
- 28.Holbrook JA, Tsodikov OV, Saecker RM, Record MT., Jr. Specific and non-specific interactions of integration host factor with DNA: thermodynamic evidence for disruption of multiple IHF surface salt-bridges coupled to DNA binding. J. Mol. Biol. 2001;310:379–401. doi: 10.1006/jmbi.2001.4768. [DOI] [PubMed] [Google Scholar]
- 29.Hyre DE, Spicer LD. Thermodynamic evaluation of binding interactions in the methionine repressor system of Escherichia coli using isothermal titration calorimetry. Biochemistry. 1995;34:3212–3221. doi: 10.1021/bi00010a010. [DOI] [PubMed] [Google Scholar]
- 30.Sieber M, Allemann RK. Thermodynamics of DNA binding of MM17, a ’single chain dimer’ of transcription factor MASH-1. Nucleic Acids Res. 2000;28:2122–2127. doi: 10.1093/nar/28.10.2122. [DOI] [PMC free article] [PubMed] [Google Scholar]
- 31.Chaires JB. A thermodynamic signature for drug-DNA binding mode. Arch. Biochem. Biophys. 2006 doi: 10.1016/j.abb.2006.03.027. [DOI] [PubMed] [Google Scholar]
- 32.Jen-Jacobson L, Engler LE, Jacobson LA. Structural and thermodynamic strategies for site-specific DNA binding proteins. Structure. 2000;8:1015–1023. doi: 10.1016/s0969-2126(00)00501-3. [DOI] [PubMed] [Google Scholar]
- 33.Haq I, Ladbury JE, Chowdhry BZ, Jenkins TC, Chaires JB. Specific binding of hoechst 33258 to the d(CGCAAATTTGCG)2 duplex: calorimetric and spectroscopic studies. J. Mol. Biol. 1997;271:244–257. doi: 10.1006/jmbi.1997.1170. [DOI] [PubMed] [Google Scholar]
- 34.Chen CY, Ko TP, Lin TW, Chou CC, Chen CJ, Wang AH. Probing the DNA kink structure induced by the hyperthermophilic chromosomal protein Sac7d. Nucleic Acids Res. 2005;33:430–438. doi: 10.1093/nar/gki191. [DOI] [PMC free article] [PubMed] [Google Scholar]
- 35.Howerton SB, Sines CC, VanDerveer D, Williams LD. Locating monovalent cations in the grooves of B-DNA. Biochemistry. 2001;40:10023–10031. doi: 10.1021/bi010391+. [DOI] [PubMed] [Google Scholar]
- 36.Shui X, Sines CC, McFail-Isom L, VanDerveer D, Williams LD. Structure of the potassium form of CGCGAATTCGCG: DNA deformation by electrostatic collapse around inorganic cations. Biochemistry. 1998;37:16877–16887. doi: 10.1021/bi982063o. [DOI] [PubMed] [Google Scholar]
- 37.Marincola FC, Denisov VP, Halle B. Competitive Na+ and Rb+ binding in the minor groove of DNA. J. Am. Chem. Soc. 2004;126:6739–6750. doi: 10.1021/ja049930z. [DOI] [PubMed] [Google Scholar]
- 38.Tamura A, Privalov PL. The entropy cost of protein association. J. Mol. Biol. 1997;273:1048–1060. doi: 10.1006/jmbi.1997.1368. [DOI] [PubMed] [Google Scholar]
- 39.Billeter M, Guntert P, Luginbuhl P, Wuthrich K. Hydration and DNA recognition by homeodomains. Cell. 1996;85:1057–1065. doi: 10.1016/s0092-8674(00)81306-9. [DOI] [PubMed] [Google Scholar]
- 40.Fraenkel E, Rould MA, Chambers KA, Pabo CO. Engrailed homeodomain-DNA complex at 2.2 A resolution: a detailed view of the interface and comparison with other engrailed structures. J. Mol. Biol. 1998;284:351–361. doi: 10.1006/jmbi.1998.2147. [DOI] [PubMed] [Google Scholar]
- 41.Labeots LA, Weiss MA. Electrostatics and hydration at the homeodomain-DNA interface: chemical probes of an interfacial water cavity. J. Mol. Biol. 1997;269:113–128. doi: 10.1006/jmbi.1997.1026. [DOI] [PubMed] [Google Scholar]
- 42.Li T, Stark MR, Johnson AD, Wolberger C. Crystal structure of the MATa1/MAT alpha 2 homeodomain heterodimer bound to DNA. Science. 1995;270:262–269. doi: 10.1126/science.270.5234.262. [DOI] [PubMed] [Google Scholar]
- 43.Wilson DS, Guenther B, Desplan C, Kuriyan J. High resolution crystal structure of a paired (Pax) class cooperative homeodomain dimer on DNA. Cell. 1995;82:709–719. doi: 10.1016/0092-8674(95)90468-9. [DOI] [PubMed] [Google Scholar]
- 44.Fujii Y, Shimizu T, Kusumoto M, Kyogoku Y, Taniguchi T, Hakoshima T. Crystal structure of an IRF-DNA complex reveals novel DNA recognition and cooperative binding to a tandem repeat of core sequences. EMBO J. 1999;18:5028–5041. doi: 10.1093/emboj/18.18.5028. [DOI] [PMC free article] [PubMed] [Google Scholar]
- 45.Hargreaves VV, Makeyeva EN, Dragan AI, Privalov PL. Stability and DNA binding ability of the DNA binding domains of interferon regulatory factors 1 and 3. Biochemistry. 2005;44:14202–14209. doi: 10.1021/bi051115o. [DOI] [PubMed] [Google Scholar]
- 46.Dec SF, Gill SJ. Heats of solution of gaseous hydrocarbons in water at 15, 25 and 35 oC. J. Solution Chem. 1985;14:827–836. [Google Scholar]
- 47.Gill SJ, Wadso I. An equation of state describing hydrophobic interactions. Proc. Natl. Acad. Sci. USA. 1976;73:2955–2958. doi: 10.1073/pnas.73.9.2955. [DOI] [PMC free article] [PubMed] [Google Scholar]
- 48.Privalov PL, Makhatadze GI. Contribution of hydration and non-covalent interactions to the heat capacity effect on protein unfolding. J. Mol. Biol. 1992;224:715–723. doi: 10.1016/0022-2836(92)90555-x. [DOI] [PubMed] [Google Scholar]
- 49.Spolar RS, Livingstone JR, Record MT., Jr. Use of liquid hydrocarbon and amide transfer data to estimate contributions to thermodynamic functions of protein folding from the removal of nonpolar and polar surface from water. Biochemistry. 1992;31:3947–3955. doi: 10.1021/bi00131a009. [DOI] [PubMed] [Google Scholar]
- 50.Makhatadze GI, Privalov PL. Energetics of protein structure. Adv. Protein Chem. 1995;47:307–425. doi: 10.1016/s0065-3233(08)60548-3. [DOI] [PubMed] [Google Scholar]
- 51.Drew HR, Dickerson RE. Structure of a B-DNA dodecamer. III. Geometry of hydration. J. Mol. Biol. 1981;151:535–556. doi: 10.1016/0022-2836(81)90009-7. [DOI] [PubMed] [Google Scholar]
- 52.Kopka ML, Fratini AV, Drew HR, Dickerson RE. Ordered water structure around a B-DNA dodecamer. A quantitative study. J. Mol. Biol. 1983;163:129–146. doi: 10.1016/0022-2836(83)90033-5. [DOI] [PubMed] [Google Scholar]
- 53.Arai S, Chatake T, Ohhara T, Kurihara K, Tanaka I, Suzuki N, Fujimoto Z, Mizuno H, Niimura N. Complicated water orientations in the minor groove of the B-DNA decamer d(CCATTAATGG)2 observed by neutron diffraction measurements. Nucleic Acids Res. 2005;33:3017–3024. doi: 10.1093/nar/gki616. [DOI] [PMC free article] [PubMed] [Google Scholar]
- 54.Chiu TK, Kaczor-Grzeskowiak M, Dickerson RE. Absence of minor groove monovalent cations in the crosslinked dodecamer C-G-C-G-A-A-T-T-C-G-C-G. J. Mol. Biol. 1999;292:589–608. doi: 10.1006/jmbi.1999.3075. [DOI] [PubMed] [Google Scholar]
- 55.Goodsell DS, Kaczor-Grzeskowiak M, Dickerson RE. The crystal structure of C-C-A-T-T-A-A-T-G-G. Implications for bending of B-DNA at T-A steps. J. Mol. Biol. 1994;239:79–96. doi: 10.1006/jmbi.1994.1352. [DOI] [PubMed] [Google Scholar]
- 56.Egli M, Tereshko V, Teplova M, Minasov G, Joachimiak A, Sanishvili R, Weeks CM, Miller R, Maier MA, An H, Dan CP, Manoharan M. X-ray crystallographic analysis of the hydration of A- and B-form DNA at atomic resolution. Biopolymers. 1998;48:234–252. doi: 10.1002/(SICI)1097-0282(1998)48:4<234::AID-BIP4>3.0.CO;2-H. [DOI] [PubMed] [Google Scholar]
- 57.Tereshko V, Minasov G, Egli M. The Dickerson-Drew B-DNA dodecamer revisited at atomic resolution. J. Am. Chem. Soc. 1999;121:470–471. [Google Scholar]
- 58.Jacobson A, Leupin W, Liepinsh E, Otting F. Minor groove hydration of DNA in aqueous solution: sequence-dependent next neighbor effect of the hydration lifetimes in d(TTAA)2 segments measured by NMR spectroscopy. Nucleic Acids Res. 1996;24:2911–2918. doi: 10.1093/nar/24.15.2911. [DOI] [PMC free article] [PubMed] [Google Scholar]
- 59.Liepinsh E, Otting G, Wuthrich K. NMR observation of individual molecules of hydration water bound to DNA duplexes: direct evidence for a spine of hydration water present in aqueous solution. Nucleic Acids Res. 1992;20:6549–6553. doi: 10.1093/nar/20.24.6549. [DOI] [PMC free article] [PubMed] [Google Scholar]
- 60.Barawkar DA, Ganesh KN. Fluorescent d(CGCGAATTCGCG): characterization of major groove polarity and study of minor groove interactions through a major groove semantophore conjugate. Nucleic Acids Res. 1995;23:159–164. doi: 10.1093/nar/23.1.159. [DOI] [PMC free article] [PubMed] [Google Scholar]
- 61.Jin R, Breslauer KJ. Characterization of the minor groove environment in a drug-DNA complex: bisbenzimide bound to the poly[d(AT)].poly[d(AT)]duplex. Proc. Natl. Acad. Sci. U. S. A. 1988;85:8939–8942. doi: 10.1073/pnas.85.23.8939. [DOI] [PMC free article] [PubMed] [Google Scholar]
- 62.Churchill MEA, Changela A, Dow LK, Krieg AJ. Interactions of high mobility group box proteins with DNA and chromatin. Chromatin. 1999;304:99–133. doi: 10.1016/s0076-6879(99)04009-4. [DOI] [PubMed] [Google Scholar]
- 63.Murphy FV, Sweet RM, Churchill ME. The structure of a chromosomal high mobility group protein-DNA complex reveals sequence-neutral mechanisms important for non-sequence-specific DNA recognition. EMBO J. 1999;18:6610–6618. doi: 10.1093/emboj/18.23.6610. [DOI] [PMC free article] [PubMed] [Google Scholar]
Associated Data
This section collects any data citations, data availability statements, or supplementary materials included in this article.