

Abstract
The viral infectivity factor gene (vif) of HIV-1 increases the infectivity of viral particles by inactivation of cellular anti-viral factors, and supports productive viral replication in primary human CD4 T-cells and in certain non-permissive T cell lines. Here, we demonstrate that Vif also contributes to the arrest of HIV-1 infected cells in the G2 phase of the cell cycle. Viruses deleted in Vif or Vpr induce less cell cycle arrest than wild-type virus, while cells infected with HIV-1 deleted in both Vif and Vpr have a cell cycle profile equivalent to that of uninfected cells. Furthermore, expression of Vif alone induces accumulation of cells in the G2 phase of the cell cycle. These data demonstrate a novel role for Vif in cell cycle regulation and suggest that Vif and Vpr independently drive G2 arrest in HIV-1 infected cells. Our results may have implications for the actions and interactions of key HIV-1 accessory proteins in AIDS pathogenesis.
Keywords: HIV-1 accessory proteins, Vif, Vpr, cell cycle, T-cells
Introduction
Retroviruses depend upon host cell resources for replication. Access to those resources may be limited to a particular phase of the cell cycle. HIV-1 gene expression causes cell cycle arrest in the G2 phase of the cell cycle in a wide variety of cells, from primary human T-cells to yeast (Bartz, Rogel, and Emerman, 1996; Elder et al., 2001; Gummuluru and Emerman, 1999; He et al., 1995; Jowett et al., 1995; Re et al., 1995). Viral Protein R (Vpr), a highly conserved nuclear membrane localized protein, has been implicated in the arrest of infected cells in the G2 phase of the cell cycle, via inhibition of activation of p34CDC2, a regulatory kinase controlling the G2 cell cycle checkpoint (He et al., 1995; Jowett et al., 1995; Re et al., 1995).
Like Vpr, Viral Infectivity Factor (Vif) is a key accessory protein encoded by HIV-1. In particular, Vif plays a critical role in HIV-1 replication in primary human CD4 T-cells (Madani et al., 1998; Sheehy et al., 2002; Simon et al.,1995; Simon et al.,1998). Vif inhibits the incorporation of the host innate restriction factors, APOBEC3G and APOBEC3F, into HIV-1 virions by direct binding to APOBEC3G/F, and induction of rapid degradation via the ubiquitin-proteasomal pathway (Kao et al., 2003; Liddament et al., 2004; Liu et al., 2004; Liu et al., 2005; Marin et al., 2003; Mehle et al., 2004; Sheehy et al., 2003; Wiegand et al., 2004; Yu et al., 2003; Yu et al., 2004; Zheng et al., 2004). Accordingly, Vif prevents editing and degradation of newly synthesized HIV-1 reverse transcripts in infected primary CD4 T-cells (Kao et al., 2003; Mariani et al., 2003).
While one study using pseudotyped HIV-1 deleted in Vpr showed a near complete abrogation of G2 arrest in infected cells (Bartz, Rogel, and Emerman, 1996), another study using wild type HIV-1 with a vpr frameshift mutation showed incomplete attenuation of G2 arrest (He et al., 1995). We wished to determine if other gene products encoded by HIV-1 contribute to the cell cycle arrest of infected cells. Here, we report that Vif accounts for most, if not all, of the residual cell cycle arrest observed in T-cells infected with Vpr deletion mutants.
Results
Deletion of either Vif or Vpr from the HIV-1 NLΔEnv subclone decreases the G2:G1 ratio of transfected T-cells
To determine the effect of specific viral gene products on the cell cycle arrest observed in HIV-1 expressing cells, Jurkat T-cells were transfected with a series of viral deletion mutants (Fig. 1A). The deletion of gene products from HIV-1 for these initial studies was made in the background of an envelope glycoprotein (Env) deletion mutant, NLΔEnv. The Envelope gene (Env) was deleted in each case to prevent viral spread. Viral proteins were expressed intracellularly, but infectious virions capable of additional rounds of infection were not produced. In this way we were able to examine the effects of HIV-1 gene expression on the cell cycle, without the possibility of subsequent rounds of infection.
Figure 1. Deletion of either Vif or Vpr from the HIV-1 NLΔEnv subclone decreases the G2:G1 ratio of transfected T-cells.

(A) Mutations were made to the HIV-1 pNL4-3 DNA as described in Materials and Methods. Shown here are the three mutations that significantly reduced the G2:G1 ratio of transfected cells (NLΔEnvΔVpr, NLΔEnvΔVif, and NLΔEnvΔVprΔVif). (B) Jurkat T-cells were transfected with viral deletion mutants, a CD8α expression vector (as a transfection control), or were mock transfected. Three days later, cells transfected with the viral deletion mutants or CD8α were stained with fluorescent antibodies specific for the viral antigen, Gag, or CD8α, respectively. At this time point, approximately 10% of cells were Gag- or CD8α-positive (data not shown). DNA content was determined by PI staining and G2:G1 ratios were calculated for mock transfected cells, and for Gag- or CD8α-positive cells. The cell cycle profile of the antigen positive transfected cells was determined using both ModFitLT (not shown) and CellQuest analysis (Supp. Fig. 1), as described in Materials and Methods. Both methods required analysis of a minimum of 2,000 Gag+ cells per sample, and the interpretation of the data was the same using either method. For simplicity, only those samples that showed a statistically significant reduction in the G2:G1 ratio compared to NLΔEnv are shown. Each bar represents the average±SEM (standard error of the mean) of between 14 and 29 replicates, from 18 independent experiments, which satisfied acceptance criteria for CellQuest analysis (described in Materials and Methods). A Dunnett (2 sided) t test was used as a post hoc test to determine significance. The differences were statistically significant at the p<0.001 level (indicated by asterisks).
Deletion mutants or the control vector, pCR3CD8α, were transfected into Jurkat T-cells. At 72 hours post-transfection, cells were analyzed for p24gag or CD8α expression and DNA content (Supp. Fig. 1). G2+M:G0+G1 (G2:G1) ratios were calculated for each transfected cell population, to assess the extent to which cells were arrested in the G2 phase of the cell cycle. Cells expressing CD8α showed a slight increase in the G2:G1 ratio, compared to mock transfected cells (Fig. 1B). While the mechanism of this effect is not known, it is possible that transfected cells are more likely to express protein in the G2 phase of the cell cycle. As predicted, cells expressing the viral clone, NLΔEnv, showed an increase in G2 arrest markedly above that of CD8α expressing control cells (Fig. 1B). Deleting either Vif or Vpr from NLΔEnv reduced the G2:G1 ratio from 1.26 ± 0.06 to 0.90 ± 0.04 or 0.94 ± 0.04, respectively. These reductions were both highly significant (p<0.001) although, surprisingly, virus deleted in Vpr still induced a shift from G1 to G2. The G2:G1 ratios observed in cells transfected with Vpu, Nef, or Tat second exon deletion mutants (1.28 ± 0.09, 1.10 ± 0.10, and 1.10 ± 0.06, respectively) were not significantly different from the G2:G1 ratio observed in cells transfected with intact NLΔEnv (p=1.000, p=0.585, p=0.349, respectively, data not shown). Viral transfectants showing a significant difference in G2 arrest compared to NLΔEnv are shown in Figure 1 and indicated by an asterisk. The literature predicts that NLΔEnvΔVpr would have less of an effect on the cell cycle than NLΔEnv, and that is confirmed by these studies. What is strikingly apparent from these data is that the deletion of Vif also results in a significant decrease in cell cycle arrest.
The Vif deletion was also made in the background of NLΔEnvΔVpr to determine whether the residual cell cycle arrest seen with NLΔEnvΔVpr could be decreased to the background levels seen with pCR3CD8α (see Fig. 1B). Notably, deletion of both Vif and Vpr (NLΔEnvΔVprΔVif) reduced the G2:G1 ratio of transfected cells to a level that was NOT statistically significantly different from the CD8α transfected cells (Fig. 1B, p=0.892). Thus, deletion of both Vif and Vpr reduced the cell cycle arrest in NLΔEnv transfected Jurkat T-cells to the level of control transfected cells, while each deletion independently still induced G2 blockade (p<0.001).
Deletion of either Vif or Vpr from the infectious clone, NL4-3, reduces the G2:G1 ratio of infected T-cells
To confirm the results of the transfection experiments, replication competent viruses deleted in Vif were made and tested against wild type and Vpr deleted viruses for their cell cycle arrest capabilities in fully permissive CEM-SS T-cells (Fig. 2 & Table 1) and semi-permissive Jurkat T-cells (data not shown). The accessory gene deletions were identical to those used in the transfection experiments and depicted in Figure 1A. However, in contrast to the transfected subclones, the replication competent viruses expressed the Env gene products necessary for multiple rounds of infection. As shown in Figure 2A, Vpr is equally expressed in wild-type NL4-3 and NLΔVif infected cells, as measured by Western blot, but is not expressed in cells infected with HIV-1 NLΔVpr or NLΔVprΔVif.
Figure 2. Deletion of either Vif or Vpr from wild-type virus, NL4-3, decreases the G2:G1 ratio of infected T-cell lines.


(A) Vpr is expressed in wild-type NL4-3 and NL4-3ΔVif (NLΔVif), but not in NL4-3ΔVpr (NLΔVpr) or NL4-3ΔVifΔVpr (NLΔVifΔVpr) infected cells. CEM-SS T-cells were infected with mock, wild-type HIV-1 NL4-3, or NL4-3 deletion mutants. Accessory gene deletions were the same as shown in Figure 1A. Unlike in Figure 1A, all viral DNA used to produce infectious virions for this experiment possessed the full length Env gene. Four days after infection, cells were lysed and analyzed for expression of Vpr, Vif, Gag, and actin by Western blot. Equal amounts of protein were loaded in each lane. These data are representative of at least 5 independent experiments. (B) Representative cell cycle profiles of infected CEM-SS T-cells are shown. CEM-SS T-cells were infected with wild-type NL4-3, deletion mutants of NL4-3, or were mock infected. Two days later, cells were harvested, stained for the presence of the viral antigen, Gag, and incubated with PI to determine DNA content. Cells modeled represent the live cells for the mock culture and the live, Gag+ cells for the virally infected cultures. The ModFit LT software was used to determine the cell cycle profiles depicted in the figure. The first dark peak represents the G1 peak. The hatched area depicts cells in the S phase of the cell cycle. The second dark peak represents cells in the G2 phase of the cell cycle. The percentage of cells in each phase as modeled by the ModFit LT program is shown above each peak or hatched area. The G2:G1 ratio appears in the box in the upper right hand corner of each histogram. These data are representative of 2 experiments, with 4 replicate samples. Composite data for these experiments are shown in Table 1.
TABLE 1.
Infection of CEM-SS T cells with NL4-3 deletion mutants Cell cycle analysis
| % of cells
|
Ratio | |||
|---|---|---|---|---|
| Cell and Day | G1 | S | G2 | G2:G1 |
| Mock Infected | ||||
| 2 | 44 ± 0.74 | 52 ± 1.35 | 5 ± 0.64 | 0.11 ± 0.01 |
| 4 | 46 ± 0.65 | 50 ± 1.22 | 5 ± 0.77 | 0.10 ± 0.02 |
| NL4-3 Infected* | ||||
| 2 | 17 ± 0.60 | 32 ± 7.13 | 52 ± 7.52 | 3.18 ± 0.53 |
| 4 | 15 ± 1.25 | 34 ± 2.38 | 51 ± 3.59 | 3.39 ± 0.54 |
| NLΔVpr Infected* | ||||
| 2 | 25 ± 1.68 | 55 ± 2.47 | 20 ± 1.04 | 0.81 ± 0.05 |
| 4 | 27 ± 0.60 | 42 ± 0.54 | 32 ± 0.87 | 1.21 ± 0.06 |
| NLΔVif Infected* | ||||
| 2 | 39 ± 0.47 | 33 ± 0.76 | 29 ± 0.99 | 0.75 ± 0.03 |
| 4 | 38 ± 2.29 | 46 ± 4.21 | 16 ± 3.37 | 0.44 ± 0.10 |
| NLΔVprΔVif Infected* | ||||
| 2 | 44 ± 0.99 | 50 ± 1.09 | 6 ± 0.27 | 0.14 ± 0.01 |
| 4 | 46 ± 0.82 | 47 ± 1.18 | 7 ± 0.40 | 0.15 ± 0.01 |
Only gag-positive cells were analyzed.
Percentages represent an average±SEM of 4 replicates from 2 separate experiments.
Two and 4 days after infection with NL4-3, NLΔVpr, NLΔVif, or NLΔVprΔVif, CEM-SS T-cells were harvested and analyzed for p24gag expression and DNA content. Figure 2B displays the cell cycle profiles from a representative experiment on day 2 post-infection and Table 1 summarizes the results of all experiments on days 2 or 4 post-infection. As expected, the majority of Gag positive NL4-3 infected cells in the culture were arrested in the G2 phase of the cell cycle (average G2:G1 ratio > 3). Deletion of Vpr (NLΔVpr) led to a decrease in G2 arrest (average G2:G1 ratios of 0.81 and 1.21 on days 2 and 4, respectively), although, as above, a significant (p<0.05) residual shift from G1 to G2 was still seen. Interestingly, the deletion of Vif (NLΔVif) also resulted in reduced G2 arrest of infected cells (average G2:G1 ratios of 0.75 and 0.44). Of note, deletion of both Vpr and Vif (NLΔVprΔVif) were required to reduce G2 arrest to the level of mock infected cells (average G2:G1 ratios of 0.11 and 0.10). The cell cycle profile for NLΔVprΔVif infected cells (average G2:G1 ratios of 0.14 and 0.15) was almost identical to mock infected cells, confirming the results of our transfection experiments. Thus, while deletion of either Vpr or Vif reduced G2 arrest, deletion of both Vpr and Vif was required to completely abrogate cell cycle arrest.
These observations were confirmed in NL4-3 infected PHA activated primary human CD4 T-cells (Fig. 3). We infected PHA activated CD4 T-cells from HIV-1 negative, healthy donors with wild-type NL4-3 or NL4-3 deletion mutants. Two days after infection, cells were stained with HIV-1 Gag-FITC and propidium iodide (PI) for cell cycle analysis. As shown in Fig. 3, G2 arrest, shown by an increased G2:G1 ratio, was observed in wild-type NL4-3 infected cells. Deletions of either Vif (NLΔVif) or Vpr (NLΔVpr) reduced the ratios of G2:G1 from 0.61 in NL4-3 infected cells to 0.21 in NLΔVif infected cells, and to 0.35 in NLΔVpr infected cells. Importantly, the G2:G1 ratio of cells infected with viruses deleted in both Vif and Vpr (NLΔVprΔVif) was almost identical to that of mock infected cells. These data suggest that both Vif and Vpr contribute to the G2 arrest in HIV-1 infected primary human CD4 T-cells.
Figure 3. Deletion of either Vif or Vpr from wild-type virus, NL4-3, decreases the G2:G1 ratio of infected PHA activated primary CD4 T-cells.
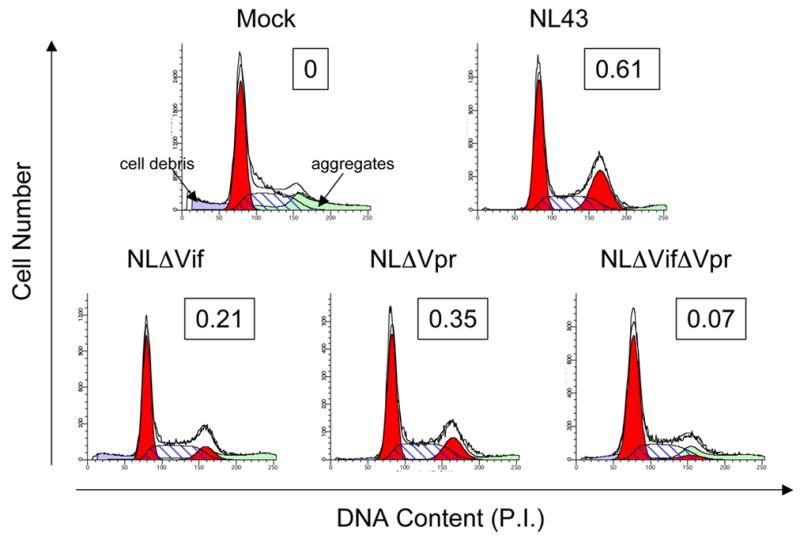
Representative cell cycle profiles of infected PHA activated primary CD4 T-cells are shown. CD4 T-cells were purified from HIV-1 negative healthy donors and stimulated for 4 days with PHA plus IL-2. Cells were then infected with either wild-type NL4-3, deletion mutants of NL4-3, or were mock infected. Two days later, cells were stained for the presence of the viral antigen, Gag, and incubated with PI for cell cycle analysis. Cells were gated on live cells for the mock infected culture, and on live, Gag+ cells for the virally infected cultures. The ModFit LT software was used to determine the cell cycle profiles and the G2:G1 ratio appears in the box in the upper right hand corner of each histogram. These data are representative of 3 experiments.
Frameshift mutation of Vif from an X4-tropic virus, SG3, dramatically reduces the G2:G1 ratio of infected T-cells
In order to test whether Vif induces G2 arrest in the context of a virus other than NL4-3, we analyzed an X4-tropic virus, SG3, and an SG3 frameshift mutation, SG3ΔVif. Three days after infection, CEM-SS T-cells were harvested and stained with Gag-FITC and PI to determine DNA content. Wild-type Vpr was expressed in both SG3 and SG3ΔVif infected cells (Fig. 4A and data not shown). The ratio of G2:G1 was dramatically decreased from 2.39 in wild-type SG3 infected cells to 0.18 in SG3ΔVif infected cells (Fig. 4B). Importantly, in PHA activated primary human CD4 T-cells, the G2:G1 ratios were also markedly diminished in SG3ΔVif, compared to SG3 infected cells (0.19 versus 0.64; Fig. 4C). These data suggest that, for certain viral isolates, Vif could be the major factor leading to accumulation of infected cells in the G2 phase of the cell cycle.
Figure 4. Deletion of Vif from X4-tropic virus, SG3, dramatically decreases the G2:G1 ratio of infected CEM-SS T-cells and PHA activated primary CD4 T-cells.


(A) Vpr is expressed in both wild-type SG3 and SG3ΔVif infected CEM-SS T-cells by Western blot. (B and C) Representative cell cycle profiles of infected CEM-SS CD4 T-cells (B) and PHA activated primary CD4 T-cells (C) are shown. CEM-SS T-cells or PHA activated primary CD4 T-cells were infected with wild-type SG3, or SG3ΔVif, or were mock infected. Three days (B) or two days (C) post-infection, cells were stained for the presence of the viral antigen, Gag, and incubated with PI for cell cycle analysis. Cells were gated on live cells for the mock infected culture, and on the live, Gag+ cells for the virally infected cultures. The ModFit LT software was used to determine the cell cycle profiles and the G2:G1 ratio appears in the upper right hand corner of each histogram. These data are representative of 3 experiments.
Expression of Vif alone is sufficient to increase the G2:G1 ratio of uninfected cells
We reasoned that Vif might be exerting an effect on the cell cycle via modulation of another viral protein, such as Vpr. To test the effects of Vif expression in the absence of other viral proteins, we co-transfected Hela cells with Vif, Vpr, or Nef expression plasmids, and with a plasmid encoding EGFP, to mark transfected cells. At 3 days post-transfection, cells were analyzed for GFP and DNA content. Cells expressing Vif alone showed a significant increase in G2 arrest, as compared to control pcDNA (Fig. 5A-C) or Nef transfected cells (Fig. 5B and 5C). Consistent with previous reports, expression of Vpr alone also induced cell cycle arrest in G2 (Fig. 5A and 5C; p<0.05). These results were confirmed in CEM-SS T-cells; as shown in Figure 6, a significant increase in the G2 arrest of EGFP+ (transfected; p<0.05), but not EGFP- (non-transfected), T-cells was induced by either Vif or Vpr. These data demonstrate that Vif and Vpr independently contribute to the arrest of HIV-1 infected cells in the G2 phase of the cell cycle.
Figure 5. Transfection of either Vif or Vpr increases the G2:G1 ratio of transfected Hela cells.


(A and B) Hela cells were co-transfected with pcDNA3.1, Vif, Nef, or Vpr, plus pEGFP-F. Three days post-transfection, the cells were harvested, fixed in ethanol and stained with PI to determine DNA content. The ModFit LT software was used to determine the cell cycle profiles of the EGFP+ (transfected) cells. The G2:G1 ratio appears in the box in the upper right hand corner of each histogram. These data are representative of 4–5 experiments performed. (C) Average±SEM of the G2:G1 ratio from 4–5 independent experiments for EGFP+ (transfected) cells are summarized. Differences between Vpr or Vif and mock transfected cells were statistically significant, as indicated (p<0.05).
Figure 6. Transfection of either Vif or Vpr increases the G2:G1 ratio of transfected CEM-SS T-cells.

Using nucleofection® by Amaxa, CEM-SS T-cells were co-transfected with pcDNA3.1, Vif, or Vpr, plus pEGFP-F. Forty-eight hours after transfection, the cells were fixed in ethanol and stained with PI to determine DNA content. At this time point, approximately 25% of cells were transfected, as determined by EGFP-positivity (data not shown). ModFit LT software was used to determine the cell cycle profiles of the EGFP+ (transfected) cells. These data are representative of 6 replicates from 3 experiments performed; the G2:G1 ratios of Vif or Vpr transfected cells were significantly different from control (p<0.05), by the Wilcoxon signed-rank test.
Discussion
Our initial experiments using transfection of Env-deleted HIV-1 DNA suggested that Vif contributes to cell cycle arrest. In the absence of Vpr, Vif had a significant effect on G2 arrest in transfected cells. We pursued this observation by infecting both semi-permissive Jurkat T-cells, fully permissive CEM-SS T-cells, and PHA activated primary CD4 T-cells with replication competent virus deleted in Vif. These data provided conclusive evidence that Vif makes a significant contribution to the cell cycle changes induced by HIV-1. Deletion of both Vif and Vpr from HIV-1 almost completely abrogated the ability of the virus to induce G2 arrest. In addition, expression of Vif alone induced an accumulation of cells in the G2 phase of the cell cycle. These data strongly suggest that Vif, like Vpr, contributes to HIV-1 induced G2 arrest. This finding is consistent with a recent report showing that deletion of either Vif or Vpr from non-replication competent virus inhibits HIV-induced cell cycle arrest (Sakai et al., 2006).
Vif is an HIV-1 accessory protein that plays a critical role in HIV-1 replication in primary CD4 T-cells and in certain “non-permissive” transformed T-cell lines (Madani et al., 1998; Sheehy et al., 2002; Simon et al., 1995; Simon et al., 1998). In Vif defective viruses, the host innate restriction factors, APOBEC3G and APOBEC3F, are packaged into viral particles through binding to viral genomic RNA, leading to cytidine deamination of the minus-strand DNA during reverse transcription, and a marked increase in guanine (G) to adenine (A) mutations in the newly synthesized HIV-1 reverse transcripts (Harris et al., 2003; Mangeat et al., 2003; Zhang et al., 2003). This hypermutated viral genome is then degraded by host cell DNA repair enzymes. Vif counteracts the effects of APOBEC3G and APOBEC3F, by inhibiting their incorporation into HIV-1 virions (Kao et al., 2003; Liddament et al., 2004; Liu et al., 2004; Liu et al., 2005; Marin et al., 2003; Mariani et al., 2003; Mehle et al., 2004; Sheehy et al., 2003; Wiegand et al., 2004; Yu et al., 2003; Yu et al., 2004; Zheng et al., 2004), thereby preventing the hypermutation and degradation of viral DNA induced by APOBEC3G/F in target cells. While these recent discoveries have shed considerable light on critical interactions between Vif and host cell restriction factors, there are still unsolved questions about the role of Vif in HIV-1 pathogenesis. For example, Vif has been shown to bind viral genomic RNA (Dettenhofer et al., 2000; Kao et al., 2003; Khan et al., 2001; Zhang et al., 2000), where it may participate in maintenance of correct folding and facilitate packaging and reverse transcription. Here, we show that Vif induces G2 arrest of HIV-1 infected cells, a function previously attributed solely to Vpr.
There is considerable evidence that Vpr induces G2 arrest in HIV-1 infected cells (Bartz, Rogel, and Emerman, 1996; Elder et al., 2001; He et al., 1995; Jowett et al., 1995; Re et al., 1995). Cells arrested in G2 have been shown to produce more virus (Goh et al., 1998; Gummuluru and Emerman, 1999), although prolonged G2 arrest ultimately leads to cell death (Stewart et al., 1997; Stewart et al., 1999; Yuan et al., 2003). Our studies, and those of Sakai et al. (2006), implicate Vif as another accessory protein that plays a role in HIV-induced G2 arrest. Neither study addresses how Vif induces G2 arrest, or why HIV-1 uses two different viral proteins, Vpr and Vif, to arrest cells in the G2 phase of the cell cycle. One possibility is that, since the half-life of infected cell is short in vivo (Perelson et al., 1996), producing as much virus as possible, in the shortest period of time, might be important for viral propagation. Having two viral gene products contribute to modulation of the cell cycle would seem to be one strategy by which HIV-1 could maximize its spread. Alternatively, Vif and Vpr may function differently under different circumstances, e.g., in different cell types, at different levels or stages of infection (unpublished observations), or in the context of different viral isolates. In support of the latter, we found that the majority of G2 arrest in wild-type SG3 infected cells was eliminated in the absence of Vif. This suggests that, in certain viral isolates, Vif is the major viral protein contributing to G2 arrest. It is intriguing to speculate that Vif might target cell cycle regulatory proteins for degradation, in a manner similar to its effects on APOBEC3G/F. Further study is needed to determine how (and why) Vif, in addition to Vpr, functions to perturb the cell cycle of HIV-1 infected cells.
Materials and Methods
Cells
The leukemic T cell lines, Jurkat and CEM-SS, were maintained in RPMI 1640 (Gibco-BRL) supplemented with 10% heat-inactivated fetal bovine serum (FBS) (Gemini Bioproducts, Inc., Calabasas, CA), 100U/mL penicillin G + 100μg/mL streptomycin (Gibco-BRL), and 2mM L-glutamine (Mediatech). The epithelioid carcinoma cell line, Hela, was maintained in Dulbecco’s Minimum Essential Medium (Mediatech) supplemented with 10% FBS. Primary human CD4 T-cells were purified by RosetteSep (StemCell Technologies Inc.), and stimulated with 1.5μg/mL PHA and 30units/mL IL-2 at 37°C for 4 days. All cells were maintained at 37°C and 5%CO2.
Plasmids (see Fig. 1A for schematic representations of selected pNL4-3 deletions)
The NLΔEnv mutant (also named YK161) was described previously (Kim and Panganiban, 1993). Briefly a Stu I to Nhe I deletion was made in the viral clone pNL4-3 (Adachi et al., 1986), followed by Klenow fill-in of the overhangs. Viral DNA’s p1971-1 (5′ NLΔVif), p210-19 (5′ NLΔVpr), p210-13 (3′ NLΔVpu), p210-5 (3′ NLΔNef), and p210-25 (5′ NLΔVif ΔVpr) were obtained from Dr. Ronald Desrosiers through the NIH AIDS Research and Reference Reagent Program (Gibbs, Regier, and Desrosiers, 1994). The mutant lacking the second exon of tat (NLΔTSE) was described previously (Casella, Rapaport, and Finkel, 1999); briefly the first codon of the second exon of tat was changed from CAG to TAG by PCR cloning. NLΔEnvΔVpr was made by replacing a SpeI to EcoRI fragment of NLΔEnv with the corresponding fragment of p210-19. NLΔEnvΔVpu was made by replacing a EcoRI to NdeI fragment of NLΔEnv with the corresponding fragment of p210-13. NLΔEnvΔNef was made by replacing the BamHI to BspeI fragment in NLΔEnv with the corresponding fragment from p210-5. NLΔEnvΔTSE was made by replacing the EcoRI to NdeI fragment in NLΔEnv with the corresponding fragment of NLΔTSE. NLΔEnvΔVif and NLΔEnvΔVprΔVif were made by replacing the SpeI to EcoRI fragment of NLΔEnv with the corresponding fragments from p1971-1 and p210-25, respectively.
The clone, pCR3CD8α, was the kind gift of Dr. Terry Potter. The pCR3CD8α control vector expresses mouse CD8α containing a deleted cytoplasmic tail, under the control of the cytomegalovirus virus immediate early promoter. pEGFP-F was purchased from BD Biosciences Clontech (Palo Alto, CA). The 5′ tagged HA-Vpr was kindly provided by Dr. Nathaniel Landau (He et al., 1995; Marzio et al., 1995). The codon-optimized HIV-1 Vif expression plasmid was the generous gift of Dr. Warner Greene. Briefly, in order to increase expression of the Vif protein, the open reading frame for human codon-optimized vif was synthesized (McLab, South San Francisco, CA) and cloned into the HindIII and BamHI sites of the pcDNA3.1 Hygro (+) expression vector. The procedure followed was substantially similar to one previously reported (Nguyen et al., 2004) except, in this case, the entire vif gene was human codon-optimized, increasing the GC content of vif to 55%.
Preparation of HIV-1 NL4-3 deletion mutant virus stocks
Viral DNA’s, p83-2 (5′ half of NL4-3), p83-10 (3′ half of NL4-3), p1971-1 (5′ NLΔVif), p210-19 (5′ NLΔVpr), and p210-25 (3′ NLΔVifΔVpr) were obtained from Dr. Ronald Desrosiers through the NIH AIDS Research and Reference Reagent Program (Gibbs, Regier, and Desrosiers, 1994). Each half of the proviral DNA (3μg) was cut with EcoRI, ligated, and used to transfect 293T cells using a modified calcium phosphate mediated transfection method in BES buffer. Culture supernatants were collected 24–48 hours after transfection and used to infect CEM-SS cells in the presence of 20μg/mL DEAE Dextran (Sigma, St. Louis, MO). Seven to 10 days after infection, supernatants were clarified by centrifugation at 250×g, collected, and frozen at −70°C.
An aliquot from each virus preparation was tested to ensure that the HIV-1 deletion mutant mRNA was made during infection. CEM-SS T-cells were infected with an amount of virus similar to that used in the actual experiment. Two days post-infection, cells were harvested and mRNA was isolated using the Oligotex™ Direct mRNA Mini Kit. The region of the isolated mRNA spanning the vif and vpr genes was amplified by RT-PCR using the following primers: sense primer (5′-GACATAAAAGTAGTGCCAAGA-3′); antisense primer (5′-CTGACTTCCTGGATGCTTC-3′. The PCR products were sequenced, and aligned with the published sequence (Genbank Accession number M19921) using Blast 2 (http://www.ncbi.nlm.nih.gov/blast/). All deletions were confirmed to be as described by Gibbs et. al. (Gibbs, Regier, and Desrosiers, 1994) and no contamination of any of the virus preparations was noted. The protein levels of Vif and Vpr in cells infected with NLΔVpr or NLΔVif, respectively, were similar to those in NL4-3 infected cells (Fig. 2A and data not shown).
The HIV-1 pSG3 proviral clone contains all genes typical of HIV-1 with the exception of vpu (Ghosh et al., 1993; Wu et al., 1997). To generate HIV-1 SG3ΔVif, a unique Ndel site in the vif coding sequence was digested with Ndel, filled in with Klenow DNA polymerase, and self-ligated to generate a frameshift mutation in Vif. The viral stocks of SG3 and SG3ΔVif were prepared by transfecting plasmids into 293T cells, followed by virus amplification in CEM-SS cells. Vpr is expressed in both wild-type SG3 and SG3ΔVif infected cells (Fig. 6A and data not shown).
Infection by HIV-1 NL4-3 deletion mutants
Jurkat or CEM-SS cells were infected in the presence of 20μg/mL DEAE Dextran (Sigma, St. Louis, MO), with amounts of virus giving approximately equivalent levels of infection. Virus was allowed to adsorb for 1–2 hours at 37°C and 5%CO2. Cells were pelleted by centrifugation, and resuspended in growth medium at a concentration of 2 × 10⁵ cells/mL for Jurkat T-cells and 3 × 10⁵ cells/mL for CEM-SS T-cells. Virus cultures were maintained at 37°C and 5%CO2.
Transfections
Jurkat T-cells were transfected using Lipofectamine reagent (GIBCO BRL, Grand Island, NY) according to the optimized manufacturer’s protocol. In some experiments, Hela cells (2 × 10⁶ cells in 10mm culture plates) were co-transfected using Fugene 6 (Roche Applied Science, Indianapolis, IN) with 18μg of pcDNA, or with the Vif, Vpr, or Nef expression plasmids, and with 2μg of pEGFP-F. Three days after transfection, cells were harvested, washed in PBS and then fixed in ethanol at 4° C. CEM-SS T-cells were transfected using nucleofection® by Amaxa (Yin et al., 2006). Approximately 2 × 10⁶ cells were transfected with 1.8μg of pcDNA, or with Vif or Vpr expression plasmids, plus 0.2μg of pEGFP-F in transfection solution V (program O-17). Forty-eight hours after transfection, cells were harvested and fixed in ethanol at 4° C. Cells were then washed in PBS and stained with PI (100μg/mL PI and 50μg/mL RNase A in PBS) at room temperature for 60 min and kept at 4°C until analysis by two-color flow cytometry.
Analysis of DNA content in T-cells transfected or infected with HIV-1 deletion mutants
Transfected or infected Jurkat or CEM-SS T-cells were fixed in 1% paraformaldehyde, washed in phosphate buffered saline (PBS), and incubated with 2.5μg of the KC57 FITC anti-Gag antibody (Coulter, Hieleah, FL) in 0.1% saponin and 10% FCS in PBS at room temperature for 30 min. The cells were washed in PBS and incubated in PI solution (100μg/mL PI, 0.1% saponin, 5mM EDTA and 50μg/mL RNase A in PBS) for 60 min at room temperature and then kept at 4°C until analyzed by two-color flow cytometry. CD8α expressing cells were stained with anti-CD8α mAb (53-6.72 FITC) for 30 min, washed with PBS, stained with PI solution, and analyzed by two color flow cytometry, as described above.
ModFit LT analysis of DNA content
The ModFit LT software program (Verity Software House, Inc., Maine, CA) was used to determine the distribution of cells in each phase of the cell cycle (G1, S, and G2). Gates were drawn around the live cell population, on a plot of FSC vs. SSC, and around the FL-1 (FITC or EGFP) positive cell population, on a plot of FL-1 vs. FL-2. Acceptance criteria for each histogram were based on the %CV, RCS, % Diploid BAD, and cell number statistics calculated by the ModFit LT program. %CV (coefficient of variance) directly corresponds to the sharpness of the G1 peak and is the most important parameter for the accuracy of the software modeling of S-phase. RCS (reverse chi squared) corresponds to the goodness of fit of the model to the data. % Diploid BAD (Background Aggregates and Debris) corresponds to the percentage of diploid events modeled that may be considered aggregated cells or cellular debris. The following limits were set: %CV<8%, RCS<6, %Diploid BAD<20%, and cell number>2,000. Exceptions were made for histograms that did not satisfy the RCS criterion if they satisfied all other criteria and the cell number was excessively high (i.e. > 40,000). A higher number of cells analyzed corresponded to higher RCS values within the same preparation. These acceptance criteria were loosely based on Guidelines for Clinical DNA Cytometry (Shankey et al., 1993) and personal communications with Verity Software House.
CellQuest analysis of DNA content
The histograms obtained from ModFit LT analysis of transfections done with the envelope deletion mutants did not meet acceptance criteria. Therefore, we adapted a method of analysis from Jowett et al. (Jowett et al., 1995). For each sample, a histogram of the PI fluorescence for all cells was analyzed. The CellQuest software program (Becton Dickinson, San Jose, CA) was used to identify the prominent G1 peak and provide its peak channel of fluorescence. The less visible G2 peak channel of fluorescence was calculated to be 2 times the G1 peak channel of fluorescence (indicating twice the DNA staining). A midpoint between these two peak channels of fluorescence was established and a ratio of cells appearing in channels above the midpoint (G2 region) to cells appearing in channels below the midpoint (G1 region) was calculated. In the text, this ratio is referred to as the G2:G1 ratio. The S phase cells were divided equally between the G2 region and the G1 region by this method of analysis. As with the ModFit LT analysis, a minimum of 2,000 cells per sample were required for inclusion in the analysis. Samples were gated to exclude debris and aggregates and the G2:G1 ratios reported were calculated for the FITC (p24 gag) positive cells in HIV-1 deletion mutant transfections and for all cells in mock transfections. The average ratios presented in Figure 1B were calculated in this manner. Figure 2 shows the CellQuest analysis of a representative experiment. Interestingly, the interpretation of the data was the same whether the ModFit LT analysis or the CellQuest analysis was used.
Flow cytometry
The cells (stained as described above) were analyzed using the FACScan or, in some cases, the FACScalibur flow cytometer (Becton Dickinson, San Jose, CA). When two-color analysis was performed, electronic compensation was used to remove spectral overlap. Twenty thousand to 100,000 events were collected.
Supplementary Material
Deletion of both Vif and Vpr abrogates cell cycle arrest in NLΔEnv transfected T-cells. Representative cell cycle profiles of transfected Jurkat T-cells are shown. The cell cycle profile of the antigen positive transfected cells was determined using both ModFitLT (not shown) and CellQuest analysis. Both methods required analysis of a minimum of 2,000 Gag+ cells per sample, and the interpretation of the data was the same using either method. G2:G1 ratios were calculated for: CD8α positive cells for CD8α transfected cells (a), Mock transfected cells (b), or Gag positive cells for NLΔEnv (c), NLΔEnvΔVpr (d), NLΔEnvΔVif (e), and NLΔEnvΔVprΔVif (f). These data are representative of 18 experiments, with 14 to 29 replicate samples; composite data are shown in Figure 1.
Acknowledgments
We thank the AIDS Research and Reference Reagent Program, Division of AIDS, NIAID, NIH, for supplying Dr. Ronald Desrosier’s viral constructs, P83-2, p83-10, p197-1, p210-19, p210-13, p210-5, and p210-25. We thank Dr. John Kappes for providing us with the SG3 construct. We thank Dr. Richard Ittenbach at The Children’s Hospital of Philadelphia for help with statistical analysis and Hank Pletcher at the University of Pennsylvania for help with cell cycle analysis. We thank Dr. Nathaniel Landau and Dr. Warner Greene for generously providing the 5′ tagged HA-Vpr and the codon-optimized HIV-1 Vif expression plasmid, respectively. We thank the University of Pennsylvania Center for AIDS Research for help with preparing SG3 and SG3ΔVif viral stocks.
Abbreviations
- Env
envelope glycoprotein
- PI
propidium iodide
- Vif
viral infectivity factor
- Vpr
viral protein R
Footnotes
Publisher's Disclaimer: This is a PDF file of an unedited manuscript that has been accepted for publication. As a service to our customers we are providing this early version of the manuscript. The manuscript will undergo copyediting, typesetting, and review of the resulting proof before it is published in its final citable form. Please note that during the production process errors may be discovered which could affect the content, and all legal disclaimers that apply to the journal pertain.
This work was supported by NIH grants RO1-AI40003 (T.H.F.), RO1-AI35513 (T.H.F.), RO1-AI062644 (X-F.Y.), and NRSA-AI9740 (C.R.C.); the Bender Foundation; the Eleanore and Michael Stobin Trust; the UCHSC Cancer Center; the Joseph L. Hollander Chair of Pediatric Rheumatology; and the University of Pennsylvania Center for AIDS Research (T.H.F.).
References
- Bartz SR, Rogel ME, Emerman M. Human immunodeficiency virus type 1 cell cycle control: Vpr is cytostatic and mediates G2 accumulation by a mechanism which differs from DNA damage checkpoint control. J Virol. 1996;70(4):2324–31. doi: 10.1128/jvi.70.4.2324-2331.1996. [DOI] [PMC free article] [PubMed] [Google Scholar]
- Casella CR, Rapaport EL, Finkel TH. Vpu increases susceptibility of human immunodeficiency virus type 1-infected cells to fas killing. J Virol. 1999;73(1):92–100. doi: 10.1128/jvi.73.1.92-100.1999. [DOI] [PMC free article] [PubMed] [Google Scholar]
- Dettenhofer M, Cen S, Carlson BA, Kleiman L, Yu XF. Association of human immunodeficiency virus type 1 Vif with RNA and its role in reverse transcription. J Virol. 2000;74(19):8938–45. doi: 10.1128/jvi.74.19.8938-8945.2000. [DOI] [PMC free article] [PubMed] [Google Scholar]
- Elder RT, Yu M, Chen M, Zhu X, Yanagida M, Zhao Y. HIV-1 Vpr induces cell cycle G2 arrest in fission yeast (Schizosaccharomyces pombe) through a pathway involving regulatory and catalytic subunits of PP2A and acting on both Wee1 and Cdc25. Virology. 2001;287(2):359–70. doi: 10.1006/viro.2001.1007. [DOI] [PubMed] [Google Scholar]
- Ghosh SK, Fultz PN, Keddie E, Saag MS, Sharp PM, Hahn BH, Shaw GM. A molecular clone of HIV-1 tropic and cytopathic for human and chimpanzee lymphocytes. Virology. 1993;194:858–64. doi: 10.1006/viro.1993.1331. [DOI] [PubMed] [Google Scholar]
- Gibbs JS, Regier DA, Desrosiers RC. Construction and in vitro properties of HIV-1 mutants with deletions in “nonessential” genes. AIDS Res Hum Retroviruses. 1994;10(4):343–50. doi: 10.1089/aid.1994.10.343. [DOI] [PubMed] [Google Scholar]
- Goh WC, Rogel ME, Kinsey CM, Michael SF, Fultz PN, Nowak MA, Hahn BH, Emerman M. HIV-1 Vpr increases viral expression by manipulation of the cell cycle: a mechanism for selection of Vpr in vivo. Nat Med. 1998;4(1):65–71. doi: 10.1038/nm0198-065. [DOI] [PubMed] [Google Scholar]
- Gummuluru S, Emerman M. Cell cycle- and Vpr-mediated regulation of human immunodeficiency virus type 1 expression in primary and transformed T-cell lines. J Virol. 1999;73(7):5422–30. doi: 10.1128/jvi.73.7.5422-5430.1999. [DOI] [PMC free article] [PubMed] [Google Scholar]
- Harris RS, Bishop KN, Sheehy AM, Craig HM, Petersen-Mahrt SK, Watt IN, Neuberger MS, Malim MH. DNA deamination mediates innate immunity to retroviral infection. Cell. 2003;113:803–9. doi: 10.1016/s0092-8674(03)00423-9. [DOI] [PubMed] [Google Scholar]
- He J, Choe S, Walker R, Di Marzio P, Morgan DO, Landau NR. Human immunodeficiency virus type 1 viral protein R (Vpr) arrests cells in the G2 phase of the cell cycle by inhibiting p34cdc2 activity. J Virol. 1995;69(11):6705–11. doi: 10.1128/jvi.69.11.6705-6711.1995. [DOI] [PMC free article] [PubMed] [Google Scholar]
- Jowett JB, Planelles V, Poon B, Shah NP, Chen ML, Chen IS. The human immunodeficiency virus type 1 vpr gene arrests infected T-cells in the G2 + M phase of the cell cycle. J Virol. 1995;69(10):6304–13. doi: 10.1128/jvi.69.10.6304-6313.1995. [DOI] [PMC free article] [PubMed] [Google Scholar]
- Kao S, Akari H, Khan MA, Dettenhofer M, Yu XF, Strebel K. Human immunodeficiency virus type 1 Vif is efficiently packaged into virions during productive but not chronic infection. J Virol. 2003;77(2):1131–40. doi: 10.1128/JVI.77.2.1131-1140.2003. [DOI] [PMC free article] [PubMed] [Google Scholar]
- Kao S, Khan MA, Miyagi E, Plishka R, Buckler-White A, Strebel K. The human immunodeficiency virus type 1 Vif protein reduces intracellular expression and inhibits packaging of APOBEC3G, a cellular inhibitor of virus infectivity. J Virol. 2003;77(21):11398–407. doi: 10.1128/JVI.77.21.11398-11407.2003. [DOI] [PMC free article] [PubMed] [Google Scholar]
- Khan MA, Aberham C, Kao S, Akari H, Gorelick R, Bour S, Strebel K. Human immunodeficiency virus type 1 Vif protein is packaged into the nucleoprotein complex through an interaction with viral genomic RNA. J Virol. 2001;75(16):7252–65. doi: 10.1128/JVI.75.16.7252-7265.2001. [DOI] [PMC free article] [PubMed] [Google Scholar]
- Liddament MT, Brown WL, Schumacher AJ, Harris RS. APOBEC3F properties and hypermutation preferences indicate activity against HIV-1 in vivo. Curr Biol. 2004;14(15):1385–91. doi: 10.1016/j.cub.2004.06.050. [DOI] [PubMed] [Google Scholar]
- Liu B, Yu X, Luo K, Yu Y, Yu XF. Influence of primate lentiviral Vif and proteasome inhibitors on human immunodeficiency virus type 1 virion packaging of APOBEC3G. J Virol. 2004;78(4):2072–81. doi: 10.1128/JVI.78.4.2072-2081.2004. [DOI] [PMC free article] [PubMed] [Google Scholar]
- Liu B, Sarkis PT, Luo K, Yu Y, Yu XF. Regulation of Apobec3F and human immunodefiiciency virus type 1 Vif by Vif-Cul5-ElonB/C E3 ubiquitin ligase. J Virol. 2005;79(15):9579–87. doi: 10.1128/JVI.79.15.9579-9587.2005. [DOI] [PMC free article] [PubMed] [Google Scholar]
- Madani N, Kabat D. An endogenous inhibitor of human immunodeficiency virus in human lymphocytes is overcome by the viral Vif protein. J Virol. 1998;72(12):10251–5. doi: 10.1128/jvi.72.12.10251-10255.1998. [DOI] [PMC free article] [PubMed] [Google Scholar]
- Mangeat B, Turelli P, Caron G, Friedli M, Perrin L, Trono D. Broad antiretroviral defense by human APOBEC3G through lethal editing of nascent reverse transcripts. Nature. 2003;424(6944):99–103. doi: 10.1038/nature01709. [DOI] [PubMed] [Google Scholar]
- Mariani R, Chen D, Schrofelbauer B, Navarro F, Konig R, Bollman B, Munk C, Nymark-McMahon H, Landau NR. Species-specific exclusion of APOBEC3G from HIV-1 virions by Vif. Cell. 2003;114(1):21–31. doi: 10.1016/s0092-8674(03)00515-4. [DOI] [PubMed] [Google Scholar]
- Marin M, Rose KM, Kozak SL, Kabat D. HIV-1 Vif protein binds the editing enzyme APOBEC3G and induces its degradation. Nat Med. 2003;9(11):1398–403. doi: 10.1038/nm946. [DOI] [PubMed] [Google Scholar]
- DiMarzio P, Choe S, Ebright M, Knoblauch R, Landau NR. Mutational analysis of cell cycle arrest, nuclear localization, and virion packaging of human immunodeficiency virus type 1 Vpr. J Virol. 1995;69(12):7909–16. doi: 10.1128/jvi.69.12.7909-7916.1995. [DOI] [PMC free article] [PubMed] [Google Scholar]
- Mehle A, Goncalves J, Santa-Marta M, McPike M, Gabuzda D. Phosphorylation of a novel SOCS-box regulates assembly of the HIV-1 Vif-Cul5 complex that promotes APOBEC3G degradation. Genes Dev. 2004;18(23):2861–6. doi: 10.1101/gad.1249904. [DOI] [PMC free article] [PubMed] [Google Scholar]
- Nguyen KL, Iiano M, Akari H, Miyagi E, Poeschla EM, Strebel K, Bour S. Codon optimization of the HIV-1 vpu and vif genes stabilizes their mRNA and allows for highly efficient Rev-independent expression. Virology. 2004;319(2):163–75. doi: 10.1016/j.virol.2003.11.021. [DOI] [PubMed] [Google Scholar]
- Perelson AS, Neumann AU, Markowitz M, Leonard JM, Ho DD. HIV-1 dynamics in vivo: virion clearance rate, infected cell life-span, and viral generation time. Science. 1996;271(5255):1582–6. doi: 10.1126/science.271.5255.1582. [DOI] [PubMed] [Google Scholar]
- Re F, Braaten D, Franke EK, Luban J. Human immunodeficiency virus type 1 Vpr arrests the cell cycle in G2 by inhibiting the activation of p34cdc2-cyclin B. J Virol. 1995;69(11):6859–64. doi: 10.1128/jvi.69.11.6859-6864.1995. [DOI] [PMC free article] [PubMed] [Google Scholar]
- Sakai K, Dimas J, Lenardo MJ. The Vif and Vpr accessory proteins independently cause HIV-1-induced T cell cytopathicity and cell cycle arrest. Proc Natl Acad Sci USA. 2006;103(9):3369–74. doi: 10.1073/pnas.0509417103. [DOI] [PMC free article] [PubMed] [Google Scholar]
- Shankey TV, Rabinovitch PS, Bagwell B, Bauer KD, Duque RE, Hedley DW, Mayall BH, Wheeless L, Cox C. Guidelines for implementation of clinical DNA cytometry. International Society for Analytical Cytology. Cytometry. 1993;14(5):472–7. doi: 10.1002/cyto.990140503. [DOI] [PubMed] [Google Scholar]
- Sheehy AM, Gaddis NC, Choi JD, Malim MH. Isolation of a human gene that inhibits HIV-1 infection and is suppressed by the viral Vif protein. Nature. 2002;418(6898):646–50. doi: 10.1038/nature00939. [DOI] [PubMed] [Google Scholar]
- Sheehy AM, Gaddis NC, Malim MH. The antiretroviral enzyme APOBEC3G is degraded by the proteasome in response to HIV-1 Vif. Nat Med. 2003;9:1404–7. doi: 10.1038/nm945. [DOI] [PubMed] [Google Scholar]
- Simon JH, Southerling TE, Peterson JC, Meyer BE, Malim MH. Complementation of vif-defective human immunodeficiency virus type 1 by primate, but not nonprimate, lentivirus vif genes. J Virol. 1995;69(7):4166–72. doi: 10.1128/jvi.69.7.4166-4172.1995. [DOI] [PMC free article] [PubMed] [Google Scholar]
- Simon JH, Miller DL, Fouchier RA, Soares MA, Peden KW, Malim MH. The regulation of primate immunodeficiency virus infectivity by Vif is cell species restricted: a role for Vif in determining virus host range and cross-species transmission. EMBO J. 1998;17(5):1259–67. doi: 10.1093/emboj/17.5.1259. [DOI] [PMC free article] [PubMed] [Google Scholar]
- Stewart SA, Poon B, Jowett JB, Chen IS. Human immunodeficiency virus type 1 Vpr induces apoptosis following cell cycle arrest. J Virol. 1997;71(7):5579–92. doi: 10.1128/jvi.71.7.5579-5592.1997. [DOI] [PMC free article] [PubMed] [Google Scholar]
- Stewart SA, Poon B, Jowett JB, Xie Y, Chen IS. Lentiviral delivery of HIV-1 Vpr protein induces apoptosis in transformed cells. Proc Natl Acad Sci USA. 1999;96(21):12039–43. doi: 10.1073/pnas.96.21.12039. [DOI] [PMC free article] [PubMed] [Google Scholar]
- Wiegand HL, Doehle BP, Bogerd HP, Cullen BR. A second human antiretroviral factor, APOBEC3F, is suppressed by the HIV-1 and HIV-2 Vif proteins. EMBO J. 2004;23(12):2451–8. doi: 10.1038/sj.emboj.7600246. [DOI] [PMC free article] [PubMed] [Google Scholar]
- Wu X, Liu H, Xiao H, Conway JA, Hunter E, Kappes JC. Functional RT and IN incorporated into HIV-1 particles independently of the Gag/Pol precursor protein. EMBO J. 1997;16(16):5113–22. doi: 10.1093/emboj/16.16.5113. [DOI] [PMC free article] [PubMed] [Google Scholar]
- Yin J, Ma Z, Selliah N, Shivers DK, Cron RQ, Finkel TH. Effective gene suppression using small interfering RNA in hard-to-transfect human T cells. J Immunol Methods. 2006;312(1–2):1–11. doi: 10.1016/j.jim.2006.01.023. [DOI] [PubMed] [Google Scholar]
- Yu X, Yu Y, Liu B, Luo K, Kong W, Mao P, Yu XF. Induction of APOBEC3G ubiquitination and degradation by an HIV-1 Vif-Cul5-SCF complex. Science. 2003;302(5647):1056–60. doi: 10.1126/science.1089591. [DOI] [PubMed] [Google Scholar]
- Yu Y, Xiao Z, Ehrlich ES, Yu X, Yu XF. Selective assembly of HIV-1 Vif-Cul5-ElonginB-ElonginC E3 ubiquitin ligase complex through a novel SOCS box and upstream cysteines. Genes Dev. 2004;18(23):2867–72. doi: 10.1101/gad.1250204. [DOI] [PMC free article] [PubMed] [Google Scholar]
- Yuan H, Xie YM, Chen IS. Depletion of Wee-1 kinase is necessary for both human immunodeficiency virus type 1 Vpr- and gamma irradiation-induced apoptosis. J Virol. 2003;77(3):2063–70. doi: 10.1128/JVI.77.3.2063-2070.2003. [DOI] [PMC free article] [PubMed] [Google Scholar]
- Zhang H, Pomerantz RJ, Dornadula G, Sun Y. Human immunodeficiency virus type 1 Vif protein is an integral component of an mRNP complex of viral RNA and could be involved in the viral RNA folding and packaging process. J Virol. 2000;74(18):8252–61. doi: 10.1128/jvi.74.18.8252-8261.2000. [DOI] [PMC free article] [PubMed] [Google Scholar]
- Zhang H, Yang B, Pomerantz RJ, Zhang C, Arunachalam SC, Gao L. The cytidine deaminase CEM15 induces hypermutation in newly synthesized HIV-1 DNA. Nature. 2003;424(6944):94–8. doi: 10.1038/nature01707. [DOI] [PMC free article] [PubMed] [Google Scholar]
- Zheng YH, Irwin D, Kurosu T, Tokunaga K, Sata T, Peterlin BM. Human APOBEC3F is another host factor that blocks human immunodeficiency virus type 1 replication. J Virol. 2004;78(11):6073–6. doi: 10.1128/JVI.78.11.6073-6076.2004. [DOI] [PMC free article] [PubMed] [Google Scholar]
Associated Data
This section collects any data citations, data availability statements, or supplementary materials included in this article.
Supplementary Materials
Deletion of both Vif and Vpr abrogates cell cycle arrest in NLΔEnv transfected T-cells. Representative cell cycle profiles of transfected Jurkat T-cells are shown. The cell cycle profile of the antigen positive transfected cells was determined using both ModFitLT (not shown) and CellQuest analysis. Both methods required analysis of a minimum of 2,000 Gag+ cells per sample, and the interpretation of the data was the same using either method. G2:G1 ratios were calculated for: CD8α positive cells for CD8α transfected cells (a), Mock transfected cells (b), or Gag positive cells for NLΔEnv (c), NLΔEnvΔVpr (d), NLΔEnvΔVif (e), and NLΔEnvΔVprΔVif (f). These data are representative of 18 experiments, with 14 to 29 replicate samples; composite data are shown in Figure 1.