
Figure 6. Involvement of NMDA receptors in the induction of acute ethanol tolerance.
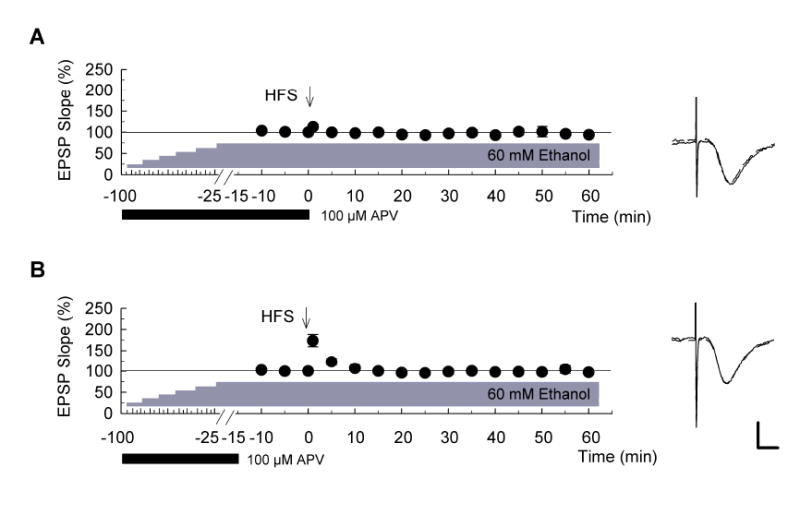
Graphs show the time course of change in EPSP slopes when concentrations of ethanol were stepwise increased by 10 mM every 15 minutes up to 60 mM in the presence of 100 μM D, L-APV, filled bar). Administration of APV was terminated just prior to delivery of high-frequency stimulation (HFS) (A) or 15 min before HFS (B) (n = 5 for each). 60 mM ethanol was continuously administered throughout the recording period. LTP was not induced under these conditions (filled circles). Traces to the right of each graph show representative EPSPs recorded 10 min before (dashed line) and 60 min after HFS (solid). Scale bar: 1 mV, 5 milliseconds.