Abstract
A method for obtaining strongly polarized nuclear spins in solution has been developed. The method uses low temperature, high magnetic field, and dynamic nuclear polarization (DNP) to strongly polarize nuclear spins in the solid state. The solid sample is subsequently dissolved rapidly in a suitable solvent to create a solution of molecules with hyperpolarized nuclear spins. The polarization is performed in a DNP polarizer, consisting of a super-conducting magnet (3.35 T) and a liquid-helium cooled sample space. The sample is irradiated with microwaves at ≈94 GHz. Subsequent to polarization, the sample is dissolved by an injection system inside the DNP magnet. The dissolution process effectively preserves the nuclear polarization. The resulting hyperpolarized liquid sample can be transferred to a high-resolution NMR spectrometer, where an enhanced NMR signal can be acquired, or it may be used as an agent for in vivo imaging or spectroscopy. In this article we describe the use of the method on aqueous solutions of [13C]urea. Polarizations of 37% for 13C and 7.8% for 15N, respectively, were obtained after the dissolution. These polarizations correspond to an enhancement of 44,400 for 13C and 23,500 for 15N, respectively, compared with thermal equilibrium at 9.4 T and room temperature. The method can be used generally for signal enhancement and reduction of measurement time in liquid-state NMR and opens up for a variety of in vitro and in vivo applications of DNP-enhanced NMR.
Two major applications exist for NMR: spectroscopy and imaging. NMR spectroscopy has gained acceptance as one of the major analytical techniques due to the detailed information that can be obtained about molecular structure, dynamics, and intra- and intermolecular interactions. MRI is a noninvasive technique with superior soft-tissue contrast and broad diagnostic value. The technique has gained wide clinical acceptance and is of great importance in diagnostic medicine.
However, despite significant technological advancements (increasing field strength and cooling of electronics), the application of NMR is limited by an intrinsically low sensitivity as compared with other analytical methods. Fundamentally, the low sensitivity originates from the low magnetic energy of nuclear spins compared with the thermal energy at room temperature. At a magnetic field strength of 1.5 T and room temperature, the 1H spins are polarized to only 5 ppm, and an improvement of 200,000 is thus theoretically possible. The two most sensitive nuclei are 1H and 19F, which have large magnetic moments and 100% abundance. But, even at the largest field strength available today (21 T), these nuclei are polarized to only 70 and 67 ppm, respectively. For other nuclei bearing lower magnetic moments (1/4 for 13C and 1/10 for 15N compared with 1H), the theoretical enhancement factor is proportionally greater. The weak nuclear polarization is generally compensated by a high concentration (i.e., a large number of nuclear spins). However, the sensitivity of several other nuclei is reduced further by the low natural abundance of the NMR-active isotope (1.1% for 13C and 0.36% for 15N).
A range of methods has been proposed to enhance the polarization of nuclear spins (denoted hyperpolarization methods), e.g., optical pumping (1), para-hydrogen-induced polarization (PHIP) (2, 3), and dynamic nuclear polarization (DNP) (4, 5). These methods have the potential to create nonthermal polarization close to unity. Optical pumping of the noble gases 3He and 129Xe has been applied in MRI of the lung. Hyperpolarized 129Xe has also been used extensively in NMR spectroscopy both in vivo and in vitro (6). The optical pumping method, however, is limited to the polarization of some of the noble gas isotopes. The PHIP effect involves the insertion of para-hydrogen into a substrate molecule via catalytic hydrogenation. The spin order of the resulting hydrogenated molecule can be converted into nuclear polarization by various methods (4, 5). The PHIP method depends on double or triple bonds in the substrate molecule. The third hyperpolarization method, DNP, is based on polarizing the nuclear spins in the solid state. The mechanism requires the presence of unpaired electrons, which are added to the sample as, e.g., an organic free radical. In order for the DNP process to be effective, the radical must be homogeneously distributed within the sample. To achieve this in an aqueous sample, a glass-former, e.g., glycerol or glycol, is added to prevent crystallization and to produce an amorphous solid after cooling the sample. In the solid state, the high electron spin polarization is in part transferred to the nuclear spins by microwave irradiation. It has been demonstrated previously that the nuclear polarizations of 1H and 13C can be increased to almost 100% and 50%, respectively (7, 8), by means of DNP at low temperature. The method has mainly been applied to the production of polarized targets for neutron-scattering experiments. The DNP method has also been used to improve the sensitivity of NMR in the solid state (9). An enhancement of 170 ± 50 was observed for [1-13C]glycine at 9 T and 20 K, and in a two-dimensional magic-angle spinning 13C-13C correlation spectrum the observed enhancement was ≈17 for [U-13C,15N]proline at 9 T and ≈100 K (10). However, even with the application of so-called magic-angle spinning, the spectral resolution in these examples of DNP-enhanced solid-state NMR is not equivalent to that of liquid-state NMR.
The purpose of this study was to develop a hyperpolarization method that would enable close-to-unity polarization of organic molecules in a liquid solution. We describe a dissolved-phase, DNP-enhanced NMR (DNP-NMR) method, in which the nuclear spins of a sample are hyperpolarized in the solid state and subsequently brought into a liquid solution after rapid dissolution. With this method, we show that it is possible to bring the polarized, cold solid sample into solution while preserving its nuclear polarization. This will enable the DNP-NMR method to be used in a wide range of different in vivo and in vitro applications and to take advantage of the narrow NMR lines in solution, leading to improved sensitivity and spectral resolution. We demonstrate the method by showing examples of enhanced polarization of 13C and 15N in the solid and liquid states of urea. In the article by Golman et al. (11), examples of [13C]urea as a marker for in vivo imaging are shown.
Materials and Methods
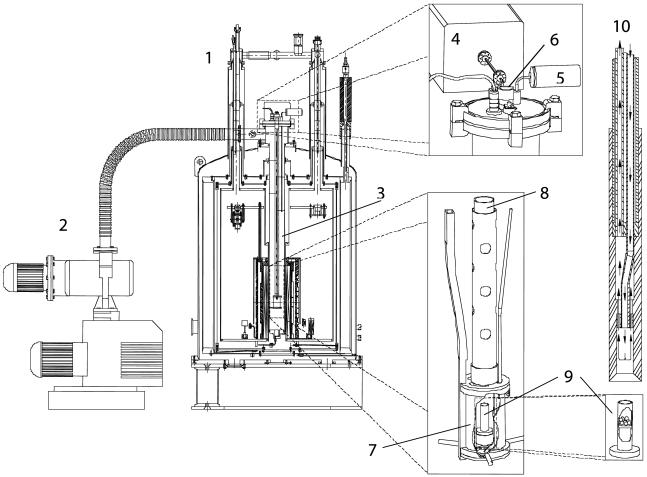
The DNP Polarizer. Magnet and cryostat. A drawing of the DNP polarizer is shown in Fig. 1. The polarizer is based on a standard, high-resolution, narrow-bore 7-T magnet and cryostat (Magnex, Oxford) (1). The cryostat was modified to accommodate a thin-walled (0.01-inch) stainless-steel tube 70 mm in diameter by removing all bore tubes. The stainless-steel tube ends in a copper heat exchanger, which is connected to the liquid-helium dewar via a capillary tube. This arrangement constitutes a variable temperature insert (VTI) (part 3 in Fig. 1). The flow of helium through the capillary tube is controlled by a needle valve from the exterior. The VTI is in thermal contact with the gas-cooled shield and the liquid-nitrogen dewar. The distance from the magnetic center to the top flange is 800 mm. The magnet is charged to 3.35 T and shimmed by the eight cryoshims to a homogeneity of >0.1 ppm within a cylinder of 10-mm diameter and 10-mm length.
Fig. 1.
Schematic drawing of the DNP polarizer and parts. 1, DNP polarizer; 2, vacuum pump; 3, VTI; 4, microwave source; 5, pressure transducer; 6, sample port; 7, microwave container; 8, sample holder; 9, sample container; 10, dissolution wand.
DNP insert. The DNP insert is placed in the cold bore of the magnet (Fig. 1). The DNP insert consists of a central fiberglass tube (18-mm inner diameter) to guide the sample when inserted. The sample is guided to the center of the magnet and ends in a cylindrical metal container (38-mm diameter and 50-mm height) (part 7 in Fig. 1). The function of the metal container is to confine the microwaves, which are guided to the container through waveguides from the exterior. On the VTI top flange, a 50-μm Mylar foil is placed between a WR10 E-bend and a short piece of straight WR10 waveguide going through the top flange. The Mylar foil serves as a vacuum seal. The waveguide continues in a 27-mm-length transition to WR28, a 500-mm thin-walled stainless-steel WR28 piece, and finally in a section of brass WR28. The lower-part brass WR28 couples the microwaves into the metal container through a slit in the side of the cylinder. Inside the metal container, a pair of saddle coils (16-mm diameter, 16-mm length) is placed to measure the NMR signal. The saddle coil is connected to a coaxial transmission line (UT85-SS-CuBe, Oxford Instruments, Tubney Woods, U.K.) and further to a tuning-and-matching network. The tune-and-match circuitry consists of a parallel variable capacitor and variable inductor and a series variable capacitor. By adjusting the length of the transmission line and the three variable impedances, the NMR circuitry is matched to 50 Ω at the 13C frequency of 35.89 MHz and the 1H frequency of 142.7 MHz. The 13C 90° flip angle is ≈100 μs with a transmit power of 15 W. A pressure transducer (part 5 in Fig. 1) measures the helium vapor pressure below the lower radiation shield from outside the VTI through a 3-mm stainless-steel tube. The flow of helium into the VTI is regulated in a servo loop. The level of helium is monitored by measuring the voltage across three 100-Ω Allen Bradley carbon resistors. A constant current heats the resistors sequentially while the voltage across is measured. The voltage profile is characteristic for helium gas phase and liquid phase. The first resistor is placed 50 mm above magnetic center, and the two others are placed above at 10-mm separation. Depending on the level of liquid helium, the needle valve is opened or closed by a stepper motor, and the level of liquid helium can be maintained between the lower and middle resistors.
Pumps. A 200-m3/h roots pump and 40-m3/h rotary vane backing pump (Leybold) (part 2 in Fig. 1) is connected to a 50-mm port on the side of the VTI. The pumping system is capable of sustaining a vapor pressure of ≈0.8 mbar (1 bar = 100 kPa) (corresponding to a bath temperature of 1.2 K) with the microwaves on. The vapor pressure is used as a measure of temperature. The pumps can be closed off by a motorized butterfly valve.
Microwave generator. The microwave source (ELVA-1, St. Petersburg, Russia) (part 4 in Fig. 1) has a maximum output power of 200 mW at 94 GHz, a tuning range of 500 MHz, and a frequency-modulation bandwidth of 10 kHz. The output level can be attenuated continuously up to 60 dB by an analogue solid-state attenuator. The frequency is controlled via an analogue tuning input. Arbitrary waveforms for frequency modulation can be supplied via an additional analogue input.
Software. The polarizer is controlled by a LABVIEW program running on a personal computer controller. The VTI pressure is read through a RS232 connection. The analogue and digital signals for controlling the microwave frequency, microwave power, and the Allen Bradley resistors are generated or sampled by a PXI-6052E sampling card (National Instruments, Austin, TX).
Sample Handling and Dissolution. Preparation of the sample. Urea (99% 13C-labeled, 505 mg, 8.27 mmol) was dissolved in glycerol (1.26 g) to give a nearly saturated solution [29% urea (wt/wt)] with a volume of 1.38 ml. The trityl radical (Tris{8-carboxyl-2,2,6,6-tetra[2-(1-hydroxyethyl)]-benzo(1,2-d:4,5-d′)bis(1,3)dithiole-4-yl}methyl sodium salt) (12) was added to reach concentrations of either 15 or 20 mM. A portion of the solution (40-50 mg) was dispensed as droplets into liquid nitrogen and transferred to the sample container (part 9 in Fig. 1) as frozen pellets. Lower molecular weight samples were prepared in a similar way by reducing the amount of urea dissolved in a given amount of glycerol.
Loading the sample. The sample holder (part 8 in Fig. 1) is a Teflon tube designed to hold the sample container (part 9 in Fig. 1) in position in the magnetic field and subsequently to enable the elevation of the sample before dissolution. When loading the sample container, the sample holder and container are first cooled in a nitrogen bath. Subsequently, the frozen pellets are placed in the container via an opening in the sample holder, and the sample holder is lowered into the VTI. The sample holder is sealed with a rubber septum. The VTI is evacuated to 0.8 mbar to cool the sample to 1.2 K, and the microwave irradiation of the sample is started. During the polarization process, the sample is submerged in liquid helium at the center of the magnetic field (3.35 T).
Dissolution of the sample. Shortly before dissolution, the microwave irradiation is stopped, the VTI is pressurized with helium gas, and the sample is raised 10 cm from the magnetic center to leave the liquid helium. At this position, the magnetic field is ≈3 T. A 10-ml syringe is filled with 7 ml of boiling water and connected to an injection wand (part 10 in Fig. 1). The injection wand is an assembly of two Teflon tubes running inside a carbon-fiber tube. The lower part of the housing is open-ended, allowing for the insertion of the sample container. The Teflon housing also contains a mixing chamber, ensuring the necessary dilution of the sample before it leaves the magnetic field of the polarizer. After inserting the wand into the sample holder, tightly connecting to the sample container, the hot water is injected rapidly (<1 s) into the sample container through one of the tubes in the wand. The sample is dissolved by the hot water and displaced via the second tube to a receiving container.
Polarization Measurement. The polarization in the solid state is quantified by measuring the NMR signal with a Varian (Palo Alto, CA) INOVA400 console. The free induction decay is acquired after a 5-μs pulse (4.5°). The first three points of the free induction decay (15 μs) are omitted before a weighted (2-kHz line broadening) Fourier transform, yielding the solid-state spectrum. The NMR signal intensity is measured by numerical integration of the NMR absorption line after third-order polynomial baseline correction. The nuclear polarization is quantified by comparing the integrals of the DNP-NMR spectrum and the thermal equilibrium solid-state spectrum.
The liquid-state NMR spectra are acquired on the same console and a 9.4-T high-resolution NMR magnet. The hyperpolarized liquid solution is transferred to a 5-mm NMR tube in a spinner and inserted into the 9.4-T magnet in <6 s. The liquid-state polarization is quantified by comparison with the thermal equilibrium liquid-state signal when the thermal equilibrium spectrum can be obtained in a single acquisition. Otherwise a concentrated reference sample of [13C]urea is used. The signal-to-noise ratio (SNR) is measured as peak height divided by the standard deviation of the noise in a 200-Hz spectral region after applying a 1-Hz exponential weight function.
Results
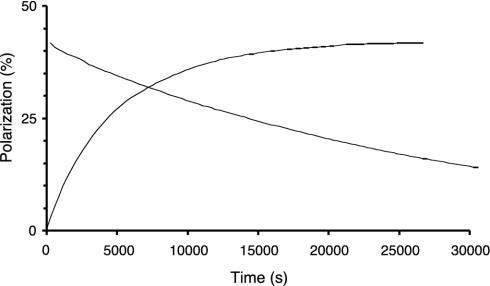
Solid-State Polarization. To examine the profile of the signal build-up as a function of the microwave irradiation time at the cryogenic temperature as well as to monitor the spin-lattice relaxation time, T1, after the irradiation is stopped, NMR signals of the [13C]urea were measured (see Fig. 2). The build-up time constant, τpol, was 4,900 s. After turning off the microwaves, T1 was measured to be 28,200 s. A maximum 13C polarization of 42% was obtained in the solid state for 15 mM radical concentration, microwave frequency of 93.952 GHz, microwave power of 100 mW (source output level), and temperature of 1.1 K. After increasing the radical concentration to 20 mM, the maximum achieved polarization decreased to 26% (Fig. 3), and the build-up time constant and relaxation time were shortened to 2,755 and 15,800 s, respectively. The error on the single exponential data fit was <2% in all cases. The variation in results obtained from identical sample preparations was <10%.
Fig. 2.
13C polarization in the solid state as a function of time with 15 mM radical concentration. The increasing curve shows the polarization build-up with microwaves on (93.952 GHz, 100-mW source output). The decreasing curve shows the polarization decay after shutting off the microwaves. Mono-exponential fittings of the data yield a polarization build-up time constant of 4,900 s and a relaxation time of 28,200 s.
Fig. 3.
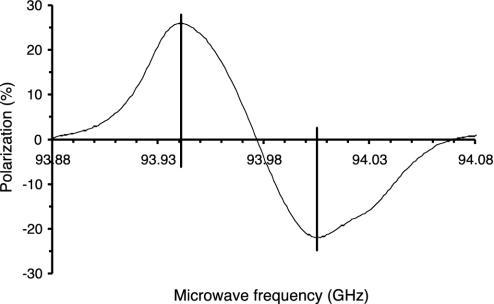
The dependence of the 13C polarization on the microwave frequency with a radical concentration of 20 mM. The output power is 100 mW, and the temperature is ≈1.1 K.
The dependence of the 13C polarization on the microwave frequency is shown in Fig. 3. The DNP spectrum showed a positive and a negative enhancement peak of almost equal intensity: +26% at 93.942 GHz and -22% at 94.005 GHz. The separation of the two peaks was 63 MHz.
The 13C NMR line width (full width at half-maximum) in the solid state was 6 kHz (2-kHz line broadening), and the resonance frequency was 35.89 MHz.
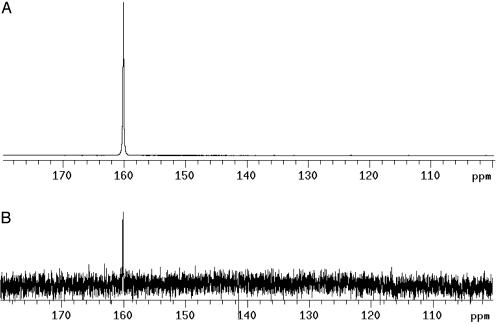
Liquid-State Polarization. To quantify the gain in nuclear polarization in the liquid state, the solid sample was dissolved according to the described method and transferred to the 9.4-T magnet within 6 s for NMR acquisition. In this experiment, unlabeled (natural abundance 13C) urea was used. A 13C spectrum of the unlabeled urea sample was acquired and compared with the thermal equilibrium spectrum (Fig. 4). The thermal equilibrium spectrum was obtained after 65 h of averaging (232,128 transients) at Ernst-angle conditions (repetition time of 1 s and pulse angle of 13.5°). The 13C polarization of the hyperpolarized sample was 20%. The SNR of the hyperpolarized spectrum was 4,592, and the SNR of the thermally polarized sample was 7.
Fig. 4.
(A) 13C spectrum of urea (natural abundance 13C) hyperpolarized by the DNP-NMR method. The concentration of urea was 59.6 mM, and the polarization was 20%. (B) Thermal equilibrium spectrum of the same sample at 9.4 T and room temperature. This spectrum is acquired under Ernst-angle conditions (pulse angle of 13.5° and repetition time of 1 s based on a T1 of 60 s) with full 1H decoupling. The signal is averaged during 65 h (232,128 transients).
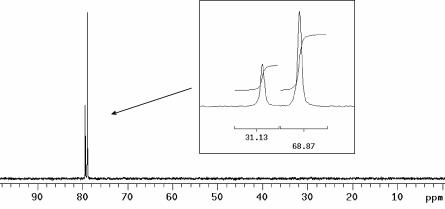
An elegant, simple, and accurate method to measure the 13C polarization is to acquire a 15N spectrum and compare the integral of the doublet peak (J-coupled to the 13C-enriched carbon). The polarization of 13C is the normalized difference of the two integrals (Fig. 5). In this manner, a polarization of 37% was obtained for 13C. From the same spectrum the 15N polarization was determined to 7.8%.
Fig. 5.
15N (natural abundance) spectrum of 13C-labeled urea. (Inset) The normalized partial integrals are shown in the graph. The polarization of 13C was 37% (difference between partial integrals), and the polarization of 15N was 7.8% (determined by comparison with a reference sample of known 15N concentration). The solid sample contained 0.6% (wt/wt) [13C]urea in glycerol and 15 mM radical. After dissolution, the concentration of [13C]urea was 8.24 mM.
Discussion
The utilization of the DNP-NMR method in liquid-state NMR relies on dissolving the polarized solid sample with as little loss of polarization as possible. Because the nuclear T1 in the solid state in the presence of the radical becomes very short at low magnetic field, it is difficult to transport the solid sample out of the polarizer. Furthermore, the dissolution should be performed as expediently as possible and in the highest possible magnetic field. The developed dissolution method, which takes place inside the DNP polarizer, has proven to be very efficient in preserving the nuclear polarization created in the solid state. When corrected for the loss of polarization during transfer of the sample (a transfer time of 6 s and a T1 of 60 s accounts for ≈10% relaxation), it can be concluded that very little polarization is lost during dissolution. On the microscopic scale, the dissolution process is yet to be characterized. However, assuming that dipolar relaxation to solvent protons is the dominant T1 relaxation mechanism, we estimate that the minimum T1 of the carbonyl carbon ranges between 0.5 and 1.0 s at 3.35 T (during the viscous phase of the dissolution). Thus, the dissolution process must be fast on this time scale. Several parameters such as the nature and temperature of the dissolution solvent may influence the degree of relaxation during the dissolution.
When comparing samples having 15 and 20 mM radical concentration, the largest solid- and liquid-state polarizations were observed at the lower radical concentration; however, this is at the expense of a prolonged polarization time. The radical concentration was not decreased further in this study, because the polarization after 1 h of microwave irradiation, which constitutes our intended operating time scale, was better at 20 mM. The signal enhancement was found to be independent of the microwave power level in the interval of 50-200 mW (data not shown). Below 50 mW, the enhancement was found to decrease. We believe that this optimum for the microwave power is due to heating of the sample by resonant absorption of the electron spins.
The DNP spectrum appears to be dominated by the thermal mixing effect (13). The positive and negative enhancement peaks are separated by 63 MHz (Fig. 3). A dominant contribution from the solid effect would appear as peaks separated by twice the nuclear Larmor frequency, i.e., 72 MHz. However, a contribution from the solid effect cannot be excluded. The positive and negative enhancement peaks are asymmetric, which is explained by an asymmetry of the EPR spectrum. We have tested frequency modulation of the microwave source. This has previously been reported to increase the polarization and decrease the polarization rate (5). For the investigated system, however, we have not observed any benefit from frequency modulation. The high polarization of 42% in the solid state is due to the favorable EPR line width of the trityl radical. Furthermore, the trityl radical is unique in terms of water solubility and stability.
We have investigated molecules other than urea and obtained similar results. For example, the substance (C1-hydroxymethyl-1[13C]cyclopropyl)methanol (14) with long 13C T1 was polarized to ≈20%. The described DNP-NMR method is capable of enhancing the NMR signal of most 13C and 15N and in our experience only limited by the relaxation during the transfer of the hyperpolarized sample. The generality of the DNP-NMR method makes it unique compared with other hyperpolarization techniques.
The concentration of the paramagnetic agent, which is essential for polarization, is ≈0.2-0.3 mM in the final solution. However, in the particular example of urea, >99% of the trityl radical can be removed from the aqueous solution by filtration through a short anion-exchange column. Such a filtration will eliminate the very small relaxation effects of the radical and render the solution more suitable for in vivo use.
The polarizer is capable of reaching a base temperature of ≈1.2 K of the pumped 4He bath in the presence of continuous microwave irradiation. This temperature is obtained relatively easily. Elevating the temperature (by decreasing the pumping speed) will not reduce the helium consumption considerably but will have impact on the polarization and the polarization rate. In our experience the DNP enhancement factor is independent of temperature in the range of 1-2 K, and therefore the nuclear polarization is inversely proportional to the temperature. The polarization rate is typically changing with temperature to a power of more than 1. This means that the polarization time may be reduced significantly if SNR can be killed in the individual experiment. Conversely, a further reduction of the temperature (3He or dilution refrigerator) or an increase of the magnetic field should further increase the polarization at the expense of prolonged polarization build-up time.
The strong signal enhancement can be translated into a tremendous reduction in signal averaging time. The conventional NMR spectrum of Fig. 4 was obtained after 65 h of signal averaging. The improvement in SNR from the averaging is estimated to 43 times when corrected for the pulse angle, repetition time, and T1 (the Ernst-angle conditions). Still, the SNR of the enhanced spectrum is 656 times higher (ratio of the measured SNR). Thus, signal averaging for 6562 × 65 h (3,200 years) would have been required to reach the same SNR without enhancement, although a T1-shortening agent could be used to shorten this duration.
The 15N polarization enhancement was on the same order as for 13C in the experiments. However, no attempts were made to optimize the conditions for DNP of 15N. It therefore is likely that the 15N polarization enhancement can be increased further.
Possible Applications of DNP-NMR
To date, the application of NMR and MRI to the study of many physiological processes has been limited by lack of sensitivity. Currently, the magnetic field strength, and thereby the SNR, is limited to 3 T for clinical whole-body imaging and to 21 T for spectroscopy of small samples; there is no indication that substantial technical advancements are to be expected. Most high-resolution NMR spectroscopy is performed on protons due to the relatively higher sensitivity and abundance compared with other nuclei. Because of its strong signal enhancement, DNPNMR provides a possibility to directly observe low-sensitivity nuclei in solution, which otherwise would have been too time-consuming to investigate. The duration of a DNP-NMR experiment, disregarding the polarization time, is limited to the acquisition of a single free induction decay. In the examples shown, dissolution and acquisition is performed within 10 s. The large signal enhancement and the short NMR acquisition time may not only yield a significant improvement in the sensitivity of traditional NMR assays but also enable applications in areas not traditionally assayed by NMR.
DNP-NMR for in vitro use requires a high-resolution NMR spectrometer (magnet and console) to be added to or combined with the DNP polarizer. In the described experimental setup, the dissolved sample was transported from the DNP polarizer to a high-resolution magnet. This transfer is currently performed in 6 s, thus limiting the analysis of short T1 nuclei. For high-resolution NMR applications, it is more practical to dissolve the sample and perform the spectroscopic measurements within the DNP polarizer. This requires an NMR coil arrangement in close proximity to the dissolution chamber but extends the range of molecules and nuclei that can be investigated by the method.
In human whole-body imaging, the large concentration of water protons allows anatomical images of high quality (i.e., with good contrast and high temporal resolution) to be obtained. However, limited information of physiological relevance is contained in the images. With DNP hyperpolarization, it may be possible to image nuclei other than protons, thus enabling a range of new applications based on imaging agents at millimolar concentrations. For instance, the strong signal may enable MR angiography with significantly better temporal and spatial resolution than possible today (as outlined in ref. 11).
Conclusion
We have demonstrated a hyperpolarization method for liquid-state NMR based on DNP in the solid state and a dissolution technique that preserves the nuclear polarization during the transition from the solid to the liquid state. The method is capable of creating solutions of molecules with strongly polarized nuclear spins and is applicable to various nuclei, e.g., 13C and 15N. The proposed DNP-NMR method opens up for a wide range of new NMR spectroscopy and MRI applications in vitro and in vivo because of the ≥10,000-fold enhancement of the nuclear polarization.
Abbreviations: DNP, dynamic nuclear polarization; DNP-NMR, DNP-enhanced NMR; VTI, variable temperature insert; SNR, signal-to-noise ratio.
References
- 1.Brossel, J. & Kastler, A. (1949) La Détection de la Résonance Magnétique des Niveaux Excités: l'Effet de Dépolarisation des Radiations de Résonance Optique et de Fluorescence 229, 1213-1215. [Google Scholar]
- 2.Golman, K., Axelsson, O., Jóhannesson, H., Månsson, S., Olofsson, C. & Petersson, J. S. (2001) Magn. Reson. Med. 46, 1-5. [DOI] [PubMed] [Google Scholar]
- 3.Haake, M., Natterer, J. & Bargon, J. (1996) J. Am. Chem. Soc. 118, 8688-8691. [Google Scholar]
- 4.Abragam, A. & Goldman, M. (1978) Rep. Prog. Phys. 41, 395-467. [Google Scholar]
- 5.Goldman, M. (1970) Spin Temperature and Nuclear Magnetic Resonance in Solids (Oxford Univ. Press, Oxford).
- 6.Goodson, B. (2002) J. Magn. Reson. 155, 157-216. [DOI] [PubMed] [Google Scholar]
- 7.de Boer, W., Borghini, M., Morimoto, K., Niinikoski, T. O. & Udo, T. (1974) J. Low Temp. Phys. 15, 249-267. [Google Scholar]
- 8.de Boer, W. & Niinikoski, T. O. (1974) Nucl. Instrum. Methods 114, 495-498. [Google Scholar]
- 9.Hall, D. A., Maus, D. C., Gerfen, G. J., Inati, S. J., Becerra, L. R., Dahlquist, F. W. & Griffin, R. G. (1997) Science 276, 930-931. [DOI] [PubMed] [Google Scholar]
- 10.Bajaj, V. S., Farrar, C. T., Hornstein, M. K., Mastovsky, I., Vieregg, J., Bryant, J., Eléna, B., Kreischer, K. E., Temkin, R. J. & Griffin, R. G. (2003) J. Magn. Reson. 160, 85-90. [DOI] [PMC free article] [PubMed] [Google Scholar]
- 11.Golman, K., Ardenkjær-Larsen, J. H., Petersson, J. S., Månsson, S. & Leunbach, I. (2003) Proc. Natl. Acad. Sci. USA 100, 10435-10439. [DOI] [PMC free article] [PubMed] [Google Scholar]
- 12.Thaning, M. (2000) U.S. Patent 6,013,810.
- 13.Wind, R. A., Duijvestijn, M. J., Van Der Lugt, C., Manenschijn, A. & Vriend, J. (1985) Prog. Nucl. Magn. Reson. Spectrosc. 17, 33-67. [Google Scholar]
- 14.Golman, K., Ardenkjær-Larsen, J.-H., Svensson, J., Axelsson, O., Hansson, G., Hansson, L., Jóhannesson, H., Leunbach, I, Månsson, S., Petersson, J. S., et al. (2002) Acad. Radiol. 9, Suppl. 2, 507-510. [DOI] [PubMed] [Google Scholar]


