Abstract
Malonyl-CoA, generated by acetyl-CoA carboxylases ACC1 and ACC2, is a key metabolite in the control of fatty acid synthesis and oxidation in response to dietary changes. ACC2 is associated to the mitochondria, and Acc2-/- mice have a normal lifespan and higher fatty acid oxidation rate and accumulate less fat. Mutant mice fed high-fat/high-carbohydrate diets weighed less than their WT cohorts, accumulated less fat, and maintained normal levels of insulin and glucose, whereas the WT mice became type-2 diabetic with hyperglycemic and hyperinsulinemic status. Fatty acid oxidation rates in the soleus muscle and in hepatocytes of Acc2-/- mice were significantly higher than those of WT cohorts and were not affected by the addition of insulin. mRNA levels of uncoupling proteins (UCPs) were significantly higher in adipose, heart (UCP2), and muscle (UCP3) tissues of mutant mice compared with those of the WT. The increase in the UCP levels along with increased fatty acid oxidation may play an essential role in the regulation of energy expenditure. Lowering intracellular fatty acid accumulation in the mutant relative to that of the WT mice may thus impact glucose transport by higher GLUT4 activity and insulin sensitivity. These results suggest that ACC2 plays an essential role in controlling fatty acid oxidation and is a potential target in therapy against obesity and related diseases.
In animals, including humans, there are two major isoforms of acetyl-CoA carboxylase, ACC1 (Mr ≈ 265,000) and ACC2 (Mr ≈ 280,000), which are encoded by separate genes and display distinct tissue and cellular distribution (1-4). The cDNAs encoding the human ACC1 and ACC2 were cloned and sequenced (1, 2, 5), and the predicted amino acid sequences revealed high homologies between the two isoforms except for the extra 114 aa present in the N terminus of ACC2. The first 20 aa of this extra peptide are highly hydrophobic, and they are responsible for guiding the ACC2 to the mitochondrial membrane (6). ACC1, on the other hand, lacks the hydrophobic N-terminal peptide and was shown to be located in the cytosol (6). In the liver and other lipogenic tissues, ACC1 is highly expressed, and the malonyl-CoA it generates is the source of the C2 units for the synthesis of fatty acids. In the heart, muscle, and liver, the malonyl-CoA generated by ACC2 is probably the regulator of the carnitine/palmitoyl-CoA shuttle system associated with the mitochondrial membrane (7).
Increasing evidence suggests that ACC1 and ACC2 play major roles in regulating the rates of fatty acid synthesis and oxidation, respectively, as they relate to energy homeostasis (8). They are under a strict regulation by diet, hormones, and other physiological factors (9). These regulators manifested their actions at the levels of gene expression and by modulating enzyme activities either through allosteric activation by citrate or by covalent modification, phosphorylation/dephosphorylation of specific serine residues (9-13). Starvation-refeeding, especially with a high-carbohydrate diet, increases the expression of the carboxylases. Insulin causes activation of the carboxylases by promoting their dephosphorylation, whereas glucagon and epinephrine cause inactivation of the enzyme by promoting their phosphorylation (10-13). During severe exercise, for instance, when there is a high need for energy and ATP, the ACCs are inactivated by phosphorylation, leading to increased generation of ATP through increased fatty acid oxidation (because of ACC2 inhibition) and decreased consumption of ATP for fatty acid synthesis (because of ACC1 inhibition) (14). Thus, the regulation of ACC activities modulate cellular energy metabolism by regulating the opposing pathways of fatty acid oxidation and synthesis.
Recently we presented evidence that ACC1 is localized to cytosol and ACC2 is associated with the mitochondrial membrane (7). In addition, we have shown that Acc2-null mutant mice that contain functional ACC1 have high levels of fatty acid oxidation (8). These results support the view that cellular malonyl-CoA is compartmentalized; the malonyl-CoA synthesized by ACC1 is used in fatty acid synthesis, whereas the malonyl-CoA generated by ACC2 is involved in the control of fatty acid oxidation (8). To understand the role ACC2 plays in obesity and type 2 diabetes, we fed WT and Acc2 mutant mice with obesity-inducing diets. The results presented here indicate that, whereas the WT mice became obese and diabetic, the increased fatty acid oxidation in the Acc2-null mutant mice reduced obesity and prevented the onset of type 2 diabetes.
Materials and Methods
Generation and Maintenance of ACC2-Deficient Mice. The strategy used to generate Acc2-null mice has been described and reported (8). The mutant and WT mice were maintained, housed, and kept on a 12-hr light/dark cycle and had ad libitum access to normal chow (Purina) or a high-fat/high-carbohydrate diet (32% of the calories are from fat and 38% are from carbohydrate) or a high-fat diet (45% of the calories from fat) (Bioserv, Frenchtown, NJ). Gain in body weight was determined by weighing the mice weekly.
i.p. Glucose Tolerance Test. Mice that were fed a high-fat/high-carbohydrate diet for 4 months were fasted for 6-8 h, and glucose (1 g/kg of body weight) was injected i.p. Glucose levels were measured from tail bleeds with a glucose meter (Abbott) and/or the glucose oxidase method (Sigma) at 0, 15, 30, 60, and 120 min after glucose injection. In addition, ketone bodies (β-hydroxybutyrate) were determined as described earlier (8). Serum insulin levels were measured, in duplicates, on 5 μl of serum sampled from blood collected from the tail vein by using the Rat Insulin ELISA Kit (Crystal Chem, Chicago), according to the manufacturer's recommendations.
Determination of the Fat Contents in Live Mice. Low-resolution NMR 60-MHz Minispec spectrometer, EchoMRI (Bruker Optics, Billerica, MA), or the dual-energy x-ray absorptiometry methods were used for fat quantification in live mice. Mice used for x-ray absorptiometry were anesthetized and scanned three times by using a peripheral densitometer (lunar PIXImus).
Fatty Acid Oxidation in Hepatocytes and Soleus Muscle. Hepatocytes from livers of 3- to 4-month-old WT and mutant Acc2-/- mice were isolated after collagenase perfusion (15). Cells were plated at a density of ≈105 cells per well in medium containing 10% FBS. After 2-h incubations, the medium was replaced with Williams' medium, and cells were incubated overnight at 37°C under a humidified 95% air2/5% CO2 atmosphere.
For the isolation of soleus muscles, mice were killed by cervical dislocation, and two strips of soleus muscles were obtained from each animal. The β-oxidation of fatty acids was determined according to Alam and Saggerson (16) except that [3H]palmitate was used as the substrate for β-oxidation (17).
For the preparation and measurement of fatty acid oxidation in hepatocytes, the procedure of Moon and Rhead (18) was followed. Hepatocytes were cultured in six-well plates for 24 h and washed twice with Dulbecco's PBS before being tested for fatty acid oxidation. The reaction was carried out in triplicate (250 μl per well) each containing 22 μM [9,10(n)-3H]palmitate [53 Ci (1 Ci = 37 GBq)/mmol], which was prepared after complete removal of the solvent under a stream of air containing 5% CO2, and the residue was suspended in Hanks' balanced salt solution (HBSS) containing 10 mg/ml BSA. After 1-h incubation at 37°C under humidified air containing 5% CO2, the reaction medium was transferred to centrifuge tubes, and 2.5 ml of methanol/chloroform (2:1) and 1 ml of 2 M KCl/2 M HCl were added. After vigorously mixing the reactions, mixtures were centrifuged at 3,000 × g for 5 min, and the aqueous phase (1 ml) containing 3H2O was transferred to a new tube, treated once more with the methanol/chloroform and KCl/HCl mixture, and recovered, and radioactivity was measured.
Carnitine Palmitoyl-CoA Transferase 1 (CPT1) Activity in Skeletal Muscle Mitochondria. Muscle mitochondria were isolated as described by Cakes et al. (19) with some modifications. Skeletal muscles (gastrocnemius and soleus) were dissected out and placed immediately in a chilled medium containing 300 mM sucrose, 5 mM Tris·HCl, and 1 mM EGTA, pH 7.4. The tissue was minced with scissors, resuspended in 10 vol of the same medium, and homogenized by using a Kinematica Polytron mechanical tissue blender with two 5-sec bursts (medium speed). The mitochondria were then isolated by using the same procedure described for the isolation of liver mitochondria (20) except that the last step of centrifugation through a high-density sucrose column was skipped. Mitochondrial pellets were finally suspended in 1-3 ml of a medium containing 150 mM KCl, 5 mM Tris·HCl, and 1 mM EGTA (pH 7.4) to a concentration of 15 mg of mitochondrial protein per ml and used immediately for CPT1 assay (21).
CPT1 Activity in Hepatocytes. CPT1 activity of hepatocytes was measured as described by Sleboda et al. (22) with some modifications. Hepatocytes were plated as 1 × 10⁶ cells per well in DMEM with 10% FBS in six-well plates. After incubation for 4 h, the medium was removed, the cells were washed with PBS, and the medium was replaced with 0.7 ml of assay medium consisting of 50 mM imidazole, 70 mM KCl, 80 mM sucrose, 1 mM EGTA, 2 mM MgCl2, 1 mM DTT, 1 mM KCN, 1 mM ATP, 0.1% fatty acid-free BSA, 70 μM palmitoyl-CoA, 1 μCi of l-[3H]carnitine, and 40 μg of digitonin with or without 50 μM malonyl-CoA. After the cells were incubated for 6 min, the reaction was stopped by the addition of 0.5 ml of 4 M ice-cold perchloric acid. The mixture was centrifuged at 8,000 × g for 10 min and the pellet was washed with 0.5 ml of 2 mM perchloric acid, resuspended in 800 μl of H2O, and extracted with 400 μlof n-butanol, and the radioactivity in 180 μl of butanol was determined by liquid scintillation counting.
Northern Blot Analysis. Total RNA was isolated from different tissues by using TRI Reagent (Sigma), and a 6- to 8-μg sample was subjected to 1% agarose gel electrophoresis in the presence of formalin. The fractionated RNA was transferred to Hybond N Filters (Amersham Pharmacia) and hybridized with 32P-labeled uncoupling protein (UCP) cDNA probes by using the NorthernMax Kit (Ambion, Austin, TX). The cDNAs for UCP1 (400 bp), UCP2 (510 bp), and UCP3 (317 bp) were generated by using the sequences from GenBank with accession numbers U009463.1, U69135.1, and U63418.1, respectively. The cDNA for 18S ribosomal RNA was used to normalize RNA loading.
Results and Discussion
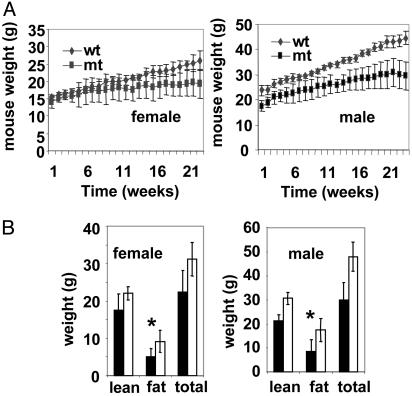
Recently we reported that Acc2-/- mutant mice fed normal chow consumed more food and weighed less than their WT cohorts (8). Because ACC2-generated malonyl-CoA inhibits CPT1, the absence of ACC2 resulted in an increased β-oxidation of fatty acids and less accumulation of fat (8). To further understand the role of ACC2 in energy homeostasis, we carried out comparative studies using Acc2-/- mutants and WT mice fed a high-fat/high-carbohydrate diet (32% of calories from fat and 38% from carbohydrate) or high-fat diet (45% of calories from fat). These diets are known to promote obesity and development of type 2 diabetes and insulin resistance in mice (23). In these studies we used two main groups of mice, males and females, in a C57BL/6 × 129sv genetic background and an inbred line 129sv. The mice were ≈6-8 weeks old when the feeding experiments started with high-fat/high-carbohydrate diet. After 4 months on this diet the WT male mice became obese relative to the Acc2-/- cohorts and weighed an average of 44 g compared with 30 g for the mutant mice (Fig. 1). For the female mice, the average weight of the mutant was 20 g, relative to 26 g for the WT cohorts. It is of interest that the mutant mice maintained nearly the same body weight after 14 weeks on the high-fat/high-carbohydrate diet, whereas the WT mice continued to gain weight (Fig. 1A). After 5 months on the high-fat/high-carbohydrate diet we determined their fat content by using x-ray absorptiometry (Materials and Methods). As shown in Fig. 1B, the most significant increase in the body weight was due to the increases in the fat content of the WT relative to that of the mutant mice in both females and males, i.e., 9.3 ± 2.9 g vs. 5 ± 2.2 g for females, and 17.5 ± 4.8 g vs. 8.5 ± 5 g for males (Fig. 1B).
Fig. 1.
Body weight of WT and Acc2-/- mutant (mt) mice fed a high-fat/high-carbohydrate diet. (A) Seven- to 8-week-old male and female mice (n = 9) were fed a special diet (32% of calories from fat and 38% from carbohydrate) for 24 weeks. The weight of each mouse within each group was measured weekly; the average and variance of the weights are shown. (B) Quantification of total body weight and fat and lean components in live mice in A using the dual-energy x-ray absorptiometry methods as described in Materials and Methods. Filled bars represent mutant and empty bars represent WT. *, P < 0.05, WT vs. mutant.
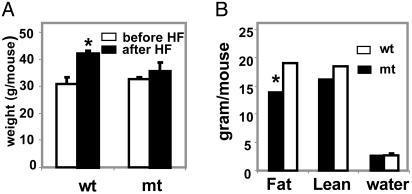
We also examined the effect of the high-fat diet (45% of calories from fat) on mutant and WT male 6- to 8-month-old mice that were of similar weight. After 3 months on this diet, the weight of the mutant mice increased from ≈32.7 ± 0.6 g to 35.6 ± 3 g compared with the WT, which increased from 30.7 ± 2.7 g to 42 ± 1 g (Fig. 2A). As is the case for the mice that were fed a high-fat/high-carbohydrate diet, the increase in body weight when fed a high-fat diet was due to a 36% increase in fat content of the WT mice, as measured by low-resolution NMR (EchoMRI), 19 ± 0.03 g of body fat for the WT mice compared with 14 ± 1.4 g for the Acc2-/- mutant.
Fig. 2.
Body weight of WT and Acc2-/- mutant mice fed a high-fat diet. (A) Male mice of ≈30-g average weight (n = 3) were fed normal chow for 6 months before they were moved to a high-fat (HF) diet. After 3 months on this diet, mouse weight was measured. (B) Analysis of the fat, lean, and water (fluid) content of these mice by using the EchoMRI. The total body weight was measured for each mouse before the analysis (average weight was 35 and 43 g for mutant and WT, respectively). *, P < 0.05.
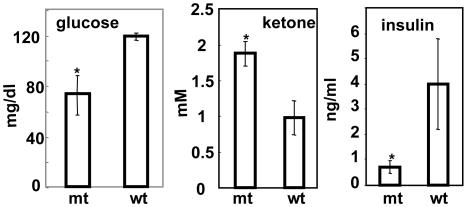
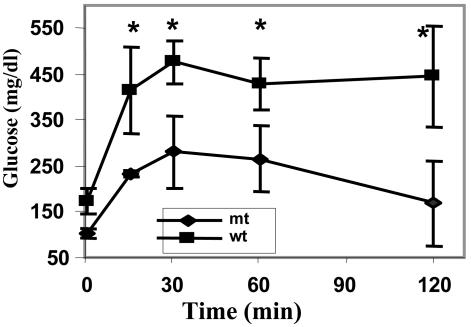
Blood Constituents and Glucose Tolerance Test of Mice Fed a High-Fat/High-Carbohydrate Diet. After ≈4 months of feeding mice a high-fat/high-carbohydrate diet, the levels of their serum glucose were measured after overnight fasting and found to be 122 ± 28 mg and 73 ± 20 mg/dl (n = 10) for WT and Acc2-/- mutants, respectively (Fig. 3). This accounts for almost a 2-fold difference in blood glucose levels between the WT and mutant mice. On the other hand, the concentration of ketone bodies was higher in the mutants, 1.88 ± 0.17 mM compared with 0.98 ± 0.24 mM for the WT, confirming our earlier observation that livers of the mutant mice oxidize fatty acids at higher rates than do WT mice (8). These findings prompted us to measure the insulin levels in both groups. As shown in Fig. 3, the insulin levels in the serum of the WT mice fed a high-fat/high-carbohydrate diet were 5-fold higher than those of the Acc2-/- mutants mice fed the same diet: 4 ± 1.6 ng/ml compared with 0.8 ± 0.24 ng/ml (P < 0.05) insulin, respectively. These findings suggest that these WT mice have become not only hyperglycemic but also hyperinsulinemic and can be characterized as diabetic. The levels of insulin in mutant mice fed a high-fat/high-carbohydrate diet were maintained within the normal range of ≈1 ng/ml, suggesting that increased β-oxidation of fatty acids in the Acc2-/- mutants protected them against diabetes-inducing conditions. These conclusions were confirmed by performing a glucose tolerance test for these mice. As shown in Fig. 4, the level of glucose in the WT, before the injection of glucose, was ≈173 ± 26 mg/dl compared with 106 ± 11 mg/dl (P < 0.05) in the mutants, and after 15 min of glucose administration these levels increased to 415 ± 95 mg/dl for the WT and to 264 ± 7 mg/dl for the mutant. The level of glucose was maintained at ≈500 ± 48 mg/dl in the WT serum, confirming that the WT mice have become indeed diabetic on this high-fat/high-carbohydrate diet. In the mutant group, on the other hand, the glucose levels were 3-fold lower than those of the WT mice after 2 h of glucose injection, suggesting the presence of efficient glucose clearance, high insulin sensitivity, and protection from diabetes-inducing conditions (Fig. 4).
Fig. 3.
Serum constituents of WT and Acc2-/- mutant mice fed a high-fat/high-carbohydrate diet. Blood was collected from tail veins, and serum was collected after separation from cells. Glucose, insulin, and ketone bodies were determined as described in Materials and Methods. The data are shown as mean ± SD; n = 5 mice in each group. *, P < 0.05, WT vs. mutant.
Fig. 4.
Glucose tolerance test. Male animals were fasted for 6-8 h. d-Glucose (1.0 g/kg) was injected into the peritoneum of conscious mice (n = 5) of each WT and Acc2-/- mutant. Blood glucose levels were sampled at the indicated times. Glucose concentration before glucose administration is shown at time 0. *, P < 0.05, WT vs. mutant.
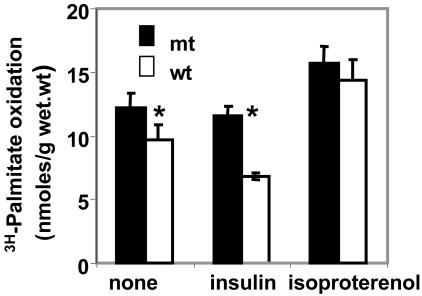
Fatty Acid Oxidation in Mouse Tissues. Effect of hormones on fatty acid oxidation by soleus muscle of Acc2-/- and WT mice. It is well known that insulin promotes glycogen synthesis and glucose oxidation. In addition, insulin activates ACCs. ACC1 produces malonyl-CoA, the key substrate for fatty acid synthesis (10). ACC2 generates malonyl-CoA that inhibits CPT1 activity (7, 8). On the other hand, glucagon inhibits glycolysis and stimulates gluconeogenesis by increasing the concentration of cAMP, which activates the cAMP-dependent protein kinase leading to the phosphorylation of the ACCs, lowering the concentrations of malonyl-CoA, which results in decreasing synthesis and increasing oxidation of fatty acids. The soleus muscle has a well defined cylindrical shape and terminal tendon (25) and it responds to hormonal regulation (type II muscle) and for that reason this muscle can be a valuable model to study fatty acid oxidation and its hormonal regulation (26). As shown in Fig. 5, the oxidation of [3H]palmitate by the soleus muscle was 20% higher in the Acc2-/- mutant muscle than that of the Acc2+/+ WT muscle. Addition of insulin, which is known to activate both carboxylases, ACC1 and ACC2, due to their dephosphorylation by an insulin-activated phosphatase(s), leads to the production of higher levels of malonyl-CoA, which is used for the synthesis of fatty acid by the fatty acid synthase and inhibits CPT1 activity, resulting in lowered fatty acid oxidation. Indeed, as shown in Fig. 5, in the presence of insulin, palmitate oxidation by the Acc2-/- soleus muscle is approximately twice that of the Acc2+/+ soleus muscle of the WT. The addition of insulin had no effect on fatty acid oxidation in the Acc2-/- mutant muscle because of the absence of ACC2 but, as expected, it decreased the palmitate oxidation by the muscle of the WT mice by ≈30-40% (Fig. 5). Conversely, when soleus muscles were treated with isoproterenol, a β-adrenergic-agonist, the fatty acid oxidation increased to the same extent in both the mutant and the WT mice (Fig. 5). Interestingly, the level of palmitate oxidation in Acc2-/- mutant muscles treated with isoproterenol was significantly higher than the oxidation of fatty acid in the untreated muscles. These results suggest that in addition to the major role of ACC2-generated malonyl-CoA in the regulation of CPT1, there might be additional mechanisms involved in the regulation of fatty acid oxidation in response to isoproterenol or possibly glucagon (the activation of CPT1) (27).
Fig. 5.
Fatty acid oxidation and the effect of insulin and isoproterenol on soleus muscle of Acc2-/- and WT mice. Two soleus muscle strips were isolated from each hind limb, and exogenous palmitate oxidation was measured as described in Materials and Methods in the presence and absence of insulin (1μM) and isoproterenol (1 μM) as indicated. One strip of soleus was incubated for 30 min, and the other strip from the same hind limb was incubated for 60 min for internal control. *, P < 0.05.
These results confirmed our proposal that the mitochondria-associated ACC2 is the target of insulin or isoproterenol actions that lead, respectively, to decreased or increased fatty acid oxidation. To rule out the possibility that these differences are not due to changes in the activity of the muscle CPT1, because of the deletion of the ACC2, we measured the activity of this enzyme in purified mitochondria derived from the mutant and WT muscles. The CPT1 activity was the same in the mitochondria derived from muscles of both mutant and WT mice (data not shown). Another possible role for malonyl-CoA is to play as a fuel sensor molecule whose level is modulated in response to diet or exercise (28). Previously, the notion was that the disposition of malonyl-CoA in the cytosol is toward biosynthesis of long-chain fatty acids catalyzed by the fatty acid synthase. However, its levels at the mitochondrial membrane may be regulated by not only its synthesis by ACC2 but also by its degradation by the malonyl-CoA decarboxylase (MCD), an enzyme that is present in the mitochondria (29). Hence, it is our supposition that the ACC2, CPT1, and MCD, which are associated with the mitochondria, coordinate the acute regulation of fatty acid oxidation and may through malonyl-CoA function within the same mitochondrial vicinity.
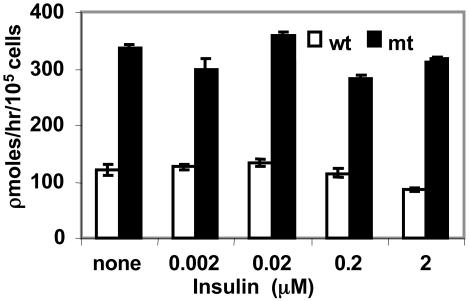
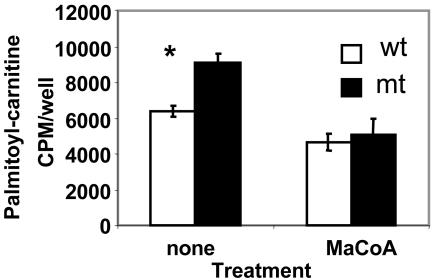
Effect of insulin on fatty acid oxidation in hepatocytes. The liver is the key organ that plays a pivotal role in the metabolism of glucose and fatty acids and in energy homeostasis in animals, including humans. In the Acc2-/- mutant mice the liver accumulated significantly lower amounts of triglycerides than those of the WT mice fed standard diet (8). These differences were attributed to the increase in fatty acid oxidation in the Acc2-/- mutant liver even though malonyl-CoA levels and fatty acid synthase activity were the same in liver extracts of the WT and mutant mice (8). To better understand the role of insulin in the regulation of fatty acid oxidation in the liver, we examined fatty acid oxidation in hepatocytes prepared from livers of Acc2-/- mutants and compared it with that of the WT. As shown in Fig. 6, the level of palmitate oxidized by hepatocytes of the Acc2-/- mutant mice was 2- to 3-fold higher than that of the WT. Although insulin did not affect the palmitate oxidation by hepatocytes obtained from livers of Acc2-/- mutant mice, as shown in Fig. 6, it did reduce palmitate oxidation by ≈30% when added to WT hepatocytes, 121 ± 6 to 86 ± 3 pmol/h per 105 cells, suggesting that the main reason for the depletion of fatty acids from livers of mutant mice is due to their higher oxidation rate. These results are consistent with our finding that ketone bodies in the blood of overnight-starved mutant mice were >2-fold higher than those of the WT cohort mice. These findings, together with the liver phenotype we described previously (8) and the different subcellular localization of ACC1 in cytosol and ACC2 associated with the mitochondria, further reaffirm the unique and different roles of ACC1 and ACC2. To confirm that indeed the higher palmitate oxidation in perfused hepatocytes is due to the relief of inhibition of CPT1 from malonyl-CoA, we assayed the activity of CPT1 in digitonin-permeated hepatocytes. The CPT1 activity was 40% higher in hepatocytes derived from mutant Acc2-/- mutant mice compared with the WT. The addition of malonyl-CoA to these hepatocytes inhibited the CPT1 activity to the same level in both preparations (Fig. 7). These results confirm that a higher rate of fatty acid oxidation in the mutant hepatocytes is not due to the activation of CPT1, but is due to the lack of malonyl-CoA that is generated by ACC2. We also estimated the mRNA level of CPT1 in livers of WT and mutant and found that the level of mRNA was the same in both WT and mutant livers (data not shown).
Fig. 6.
Fatty acid oxidation and the effect of insulin on hepatocytes prepared from livers of WT and Acc2-/- mice. Hepatocytes (105 cells) were grown in triplicates (in six-well plates) for 24 h. Fatty acid oxidation was determined at various insulin concentrations that were added at the start of the experiment. 3H2O was measured in the medium as described in Materials and Methods. Blank values were determined by adding methanol immediately to the culture.
Fig. 7.
CPT1 activity and its inhibition by malonyl-CoA in hepatocytes from WT and mutant mice. Hepatocytes (106 cells) were plated in DMEM with 10% FBS on six-well plates for 4 h. CPT1 activity was determined by formation of palmitoylcarnitine from 1 μCi of l-[3H]carnitine and 70 μM palmitoyl-CoA in the presence or absence of 50 μM malonyl-CoA. *, P < 0.05, WT vs. mutant.
The Expression of UCPs in Different Tissues. A critical unanswered question is, what is the impact of ACC2 mutation on the metabolic rate of the mice? It was suggested that fatty acids are involved in the regulation of the genes encoding the UCPs and that there is a possible relationship among UCPs, energy expenditure, and obesity (30). It is well established that UCP1, the first of several UCPs discovered, plays an important role in facultative thermogenesis in rodents (31). The recent discoveries of other homologues of UCP1, such as UCP3 (expressed in muscle) and UCP2 (expressed in muscle and white adipose tissues), suggested that these proteins might be involved in the mitochondrial proton leak, uncoupling oxidative phosphorylation and preventing ATP synthesis from fuel oxidation, (32). We measured the mRNA levels of the UCPs in different tissues of Acc2-/- mutant mice fed normal chow and compared them to that of their WT cohorts (Fig. 8). The level of UCP3 that is highly expressed in skeletal muscle was ≈2-fold higher in the mutants, and there was no change in UCP3 in heart and the brown adipose tissue. In the adipose tissue and heart of the mutant mice, there was a 2-fold increase in the UCP2 compared with that of the WT, but UCP2 was unchanged in the skeletal muscle and liver of the mutant and WT mice. In brown adipose tissue, UCP1, -2, and -3 were expressed at about the same level in both WT and mutant tissues (Fig. 8). The importance of UCP2 and -3 in the regulation of energy expenditure is not clear yet. Transgenic mice that overexpress human UCP3 showed significant reductions in body weight and decrease in adiposity despite increases in food intake (33). On the other hand, UCP3 gene knockout mice showed that UCP3 was not required for body weight regulation, fatty acid oxidation, or cold-induced thermogenesis (34). In these studies and in UCP2 gene knockout mice, however, there was an increase in production of reactive oxygen species (ROS) in the mitochondria (34, 35). There has been a strong correlation between the increase in fatty acid oxidation and the production of ROS by mitochondria (36). The role of the UCPs in this case is to protect against ROS, during which energy is wasted as heat (37, 38). It is conceivable that, in Acc2-/- mutant mice, which are continuously oxidizing fatty acids, part of the energy could be wasted by UCP2 and -3, which are expressed significantly higher at the level of mRNA in the mutants. In this communication, we provided evidence that, because of uncontrolled fatty acid oxidation in heart, muscle, and liver, mice were resistant to obesity and diabetes (insulin sensitive) when they were fed high-fat and high-fat/high-carbohydrate diets. We also showed an increased mRNA expression of UCP2 in the heart and white adipocytes and UCP3 in muscle. The increase in these UCPs might play an essential role in the regulation of energy expenditure as a result of higher fatty acid oxidation in the mutants.
Fig. 8.
Expression of UCP1, -2, and -3. (A and B) Representative Northern blots of total RNA (5-6 μg) prepared from the skeletal muscles, white adipose tissue, heart, liver, and brown adipose tissue of WT and Acc2-/- mutant mice. The filter was probed several times (after stripping) with the 32P-labeled cDNA fragments of UCP1, -2, and -3 and 18S ribosomal RNA (for quantification analysis). (C) Comparison of mRNA levels in different mouse tissues. B, brown adipose; L, liver; H, heart; M, skeletal muscle; W, white adipose. Data represent three Northern blots from WT and mutant mice that were hybridized with each UCP and 18S ribosomal RNA probe. The intensity of the band corresponds to each UCP normalized to the values of 18S mRNA signals. Values are mean ± SD.
In summary, it has long been known that high cellular fat and fatty acids induce insulin resistance in an animal and play an important role in the development of type 2 diabetes. Randle et al. (39) attributed this to the inhibition of pyruvate dehydrogenase activity by fatty acids. More recently, Shulman and coworkers (40) presented data that support the thesis that increased intracellular fatty acids in muscle or liver lead to activation of serine kinase cascades, which results in decreased insulin receptor substrate (IRS)-1-tyrosine phosphorylation, resulting in decreased IRS-1-associated phosphatidylinositol 3-kinase activity and a decrease in glucose transport activity by GLUT4. The results presented herein support the proposition that malonyl-CoA, generated by ACC2, plays an important role in the development of insulin resistance in mice fed a high-fat/high-carbohydrate diet and subsequent development of type 2 diabetes. Malonyl-CoA inhibits the mitochondrial carnitine-shuttle system, leading to increases in intracellular fatty acid metabolites and activation of the serine kinase cascade, which results eventually in decreased glucose transport, insulin resistance, and development of type 2 diabetes. As we have shown earlier (8) and in the results reported here, the absence of ACC2-generated malonyl-CoA in the Acc2-/- mutant mice would spare the carnitine-shuttle system, resulting in an increase in fatty acid oxidation, thus lowering the intracellular fatty acid concentration and eliminating the potential inhibition of glucose transport. Consequently, the Acc2-/- mutant mice fed a high-fat/high-carbohydrate or a high-fat diet remain insulin-sensitive and do not develop diabetes. The regulation of ACC2 and the development of inhibitors for its activity would be a welcome contribution to anti-obesity and anti-type 2 diabetes therapeutics.
Acknowledgments
We thank Dr. Kenneth Ellis for his help in carrying out the x-ray tests, Dr. Zvi Taicher for low-resolution NMR studies, and Drs. Subrahmanyam Chirala and Jianpeng Ma for discussions and comments. W.O. was the recipient of a postdoctoral fellowship from the Korea Science and Engineering Foundation. This work was supported in part by The Clayton Foundation for Research and National Institutes of Health Grant GM-63115.
Abbreviations: ACC, acetyl-CoA carboxylase; CPT, carnitine palmitoyl-CoA transferase; UCP, uncoupling protein.
References
- 1.Abu-Elheiga, L., Jayakumar, A., Baldini, A., Chirala, S. S. & Wakil, S. J. (1995) Proc. Natl. Acad. Sci. USA 92, 4011-4015. [DOI] [PMC free article] [PubMed] [Google Scholar]
- 2.Abu-Elheiga, L., Almarza-Ortega, D. B., Baldini, A. & Wakil, S. J. (1997) J. Biol. Chem. 272, 10669-10677. [DOI] [PubMed] [Google Scholar]
- 3.Ha, J., Lee, J. K., Kim, K.-S., Witters, L. A. & Kim, K.-H. (1996) Proc. Natl. Acad. Sci. USA 93, 11466-11470. [DOI] [PMC free article] [PubMed] [Google Scholar]
- 4.Thampy, K. G. (1989) J. Biol. Chem. 264, 17631-17634. [PubMed] [Google Scholar]
- 5.Ha, J., Daniel, S., Broyles, S. & Kim, K. H. (1994) J. Biol. Chem. 269, 22162-22168. [PubMed] [Google Scholar]
- 6.Abu-Elheiga, L., Brinkley, W. R., Zhong, L., Chirala, S. S., Woldegiorgis, G. & Wakil, S. J. (2000) Proc. Natl. Acad. Sci. USA 97, 1444-1449. [DOI] [PMC free article] [PubMed] [Google Scholar]
- 7.McGarry, J. D. & Brown, N. F. (1997) Eur. J. Biochem. 244, 1-14. [DOI] [PubMed] [Google Scholar]
- 8.Abu-Elheiga, L., Matzuk, M. M., Abo-Hashema, K. A. H. & Wakil, S. J. (2001) Science 291, 2613-2616. [DOI] [PubMed] [Google Scholar]
- 9.Allred, J. B. & Reilly, K. E. (1996) Prog. Lipid Res. 35, 371-385. [DOI] [PubMed] [Google Scholar]
- 10.Thampy, K. G. & Wakil, S. J. (1988) J. Biol. Chem. 263, 6447-6453. [PubMed] [Google Scholar]
- 11.Mabrouk, G. M., Helmy, I. M., Thampy, K. G. & Wakil, S. J. (1990) J. Biol. Chem. 265, 6330-6338. [PubMed] [Google Scholar]
- 12.Kim, K.-H. (1997) Annu. Rev. Nutr. 17, 77-99. [DOI] [PubMed] [Google Scholar]
- 13.Hardie, D. G. (1989) Prog. Lipid Res. 28, 117-146. [DOI] [PubMed] [Google Scholar]
- 14.Hardie, D. G. & Pan, D. A. (2001) Biochem. Soc. Trans. 30, 1064-1070. [DOI] [PubMed] [Google Scholar]
- 15.Neufeld, D. S. (1997) Methods Mol. Biol. 75, 145-151. [DOI] [PubMed] [Google Scholar]
- 16.Alam, N. & Saggerson, E. D. (1998) Biochem. J. 334, 233-241. [DOI] [PMC free article] [PubMed] [Google Scholar]
- 17.Ibrahimi, A., Bonen, A., Blinn, W. D., Hajri, T., Li, X., Zhong, K., Cameron, R. & Abumrad, N. A. (1999) J. Biol. Chem. 274, 26761-26766. [DOI] [PubMed] [Google Scholar]
- 18.Moon, A. & Rhead, W. (1987) J. Clin. Invest. 79, 59-64. [DOI] [PMC free article] [PubMed] [Google Scholar]
- 19.Cake, M. H., Power, G. W., Stonell, L. M. & Potter, I. C. (1998) J. Exp. Zool. 281, 6-11. [Google Scholar]
- 20.Power, G. L., Cake, M. H. & Newsholme, E. A. (1997) Lipids 32, 31-37. [DOI] [PubMed] [Google Scholar]
- 21.Power, G. W., Cake, M. H. & Potter, I. C. (1993) J. Exp. Zool. 266, 157-162. [Google Scholar]
- 22.Sleboda, J., Risan, K. A., Spydevold, O. & Brener, J. (1999) Biochim. Biophys. Acta 1436, 541-549. [DOI] [PubMed] [Google Scholar]
- 23.Surwit, R. S., Kuhn, C. M., Cochrane, C., McCubbin, J. A. & Feinglos, M. N. (1988) Diabetes 37, 1163-1167. [DOI] [PubMed] [Google Scholar]
- 24.Lopaschuk, G. & Gamble, J. (1994) Can. J. Physiol. Pharmacol. 72, 1101-1109. [DOI] [PubMed] [Google Scholar]
- 25.Chaudry, I. H. & Gould, M. K. (1969) Biochim. Biophys. Acta 177, 527-536. [DOI] [PubMed] [Google Scholar]
- 26.Nandendergche, K., Rishter, E. A. & Hespel, P. (1999) Acta Physiol. Scand. 165, 307-314. [DOI] [PubMed] [Google Scholar]
- 27.Velasco, G., Geelen, M. J. H. & Guzman, M. (1997) Arch. Biochem. Biophys. 337, 169-175. [DOI] [PubMed] [Google Scholar]
- 28.Saha, A. K., Schwarsin, A. J., Roduit, R., Masse, F., Kaushik, V., Tornheim, K., Prentki, M. & Ruderman, N. B. (2000) J. Biol. Chem. 275, 24279-24283. [DOI] [PubMed] [Google Scholar]
- 29.Goodwin, G. W. & Taegtmeyer, H. (1999) Am. J. Physiol. 277, E772-E777. [DOI] [PubMed] [Google Scholar]
- 30.Langin, D., Larrouy, D., Barbe, P., Millet, L., Viguerie-Bascands, N., Andreelli, F., Laville, M. & Vidal, H. (1999) Int. J. Obes. Relat. Metab. Disord. 23, S64-S67. [DOI] [PubMed] [Google Scholar]
- 31.Argyropoulos, G. & Harper, M. E. (2002) J. Appl. Physiol. 92, 2187-2198. [DOI] [PubMed] [Google Scholar]
- 32.Dalgaard, L. T. & Pederson, O. (2001) Diabetologia 44, 946-965. [DOI] [PubMed] [Google Scholar]
- 33.Clapham, J. C., Arch, J. R. S., Chapman, H., Haynes, A., Lister, C., Moore, G., Piercy, V., Carter, S. A., Lehner, I., Smith, S. A., et al. (2000) Nature 406, 415-418. [DOI] [PubMed] [Google Scholar]
- 34.Vidal-Puig, A. J., Grujic, D., Zhang, C.-Y., Hagen, T., Boss, O., Ido, Y., Szczepanik, A., Wade, J., Mootha, V., Cortright, R., et al. (2000) J. Biol. Chem. 275, 16258-16266. [DOI] [PubMed] [Google Scholar]
- 35.Arsenijevic, D., Onuma, H., Pecqueur, C., Raimbault, S., Manning, B. S., Miroux, B., Couplan, E., Alves-Guerra, M. C., Goubern, M., Surwit, R., et al. (2000) Nat. Genet. 26, 387-388.11101825 [Google Scholar]
- 36.Yamagishi, S.-i., Edelstein, D., Du, X.-l., Kaneda, Y., Guzman, M. & Brownlee, M. (2001) J. Biol. Chem. 276, 25096-25100. [DOI] [PubMed] [Google Scholar]
- 37.Diehl, A. M. & Hoek, J. B. (1999) J. Bioenerg. Biomembr. 5, 493-506. [DOI] [PubMed] [Google Scholar]
- 38.Boss, O., Hagen, T. & Lowell, B. B. (2000) Diabetes 49, 143-156. [DOI] [PubMed] [Google Scholar]
- 39.Randle, P. J., Garland, P. B., Hales, C. N. & Newsholme, E. A. (1973) Lancet i, 785-789. [DOI] [PubMed] [Google Scholar]
- 40.Petersen, K. F. & Shulman, G. I. (2002) Am. J. Cardiol. 90, Suppl., 11G-18G. [DOI] [PubMed] [Google Scholar]


