Abstract
Saccharomyces cerevisiae cells reproduce by budding to yield a mother cell and a smaller daughter cell. Although both mother and daughter begin G1 simultaneously, the mother cell progresses through G1 more rapidly. Daughter cell G1 delay has long been thought to be due to a requirement for attaining a certain critical cell size before passing the commitment point in the cell cycle known as START. We present an alternative model in which the daughter cell-specific Ace2 transcription factor delays G1 in daughter cells. Deletion of ACE2 produces daughter cells that proceed through G1 at the same rate as mother cells, whereas a mutant Ace2 protein that is not restricted to daughter cells delays G1 equally in both mothers and daughters. The differential in G1 length between mothers and daughters requires the Cln3 G1 cyclin, and CLN3-GFP reporter expression is reduced in daughters in an ACE2-dependent manner. Specific daughter delay elements in the CLN3 promoter are required for normal daughter G1 delay, and these elements bind to an unidentified 127-kDa protein. This DNA-binding activity is enhanced by deletion of ACE2. These results support a model in which daughter cell G1 delay is determined not by cell size but by an intrinsic property of the daughter cell generated by asymmetric cell division.
In the budding yeast Saccharomyces cerevisiae, mother and daughter cells spend different lengths of time in G1 before entering S phase. The larger mother cell progresses through G1 relatively quickly, whereas the smaller daughter cell is delayed in G1.
The Cln3 G1 cyclin promotes progression through G1 (1, 2). Multiple signal transduction pathways that regulate the rate of G1 progression converge to regulate Cln3 transcription, translation, stability, and activity. Mating pheromone and osmotic shock arrest cells in G1 in part by decreasing the activity of the Cln3/Cdc28 kinase complex (3-5). A leaky scanning mechanism involving a short upstream ORF (6) makes Cln3 translation extremely sensitive to the rate of protein synthesis: a 50% decrease in protein synthesis produces a 10-fold fall in Cln3 protein levels (7). This mechanism probably accounts for regulation of Cln3 translation by the Tor and protein kinase A pathways (7, 8). Nitrogen starvation also down-regulates Cln3 translation and stability (9). CLN3 transcription is maintained throughout the cell cycle but displays some cell cycle periodicity that depends on early cell cycle boxes (ECB) sites upstream of the CLN3 promoter (10, 11). Glucose media induce CLN3 transcription and promote rapid G1 progression (12). Glucose induction of CLN3 requires glycolysis but not cell cycle progression and is not affected by mutations in the well characterized glucose repression or induction pathways (13, 14). Azf1, a glucose-activated transcription factor, binds to repeated elements in the CLN3 promoter (15, 16). Thus, CLN3 is an integrator for signals that regulate the rate of G1 progression in S. cerevisiae.
The classical explanation for daughter cell G1 delay is the critical size model, in which daughter cells remain in G1 until they reach a cell size that triggers entry into S phase (17). In this model, the essential difference between mother and daughter is cell size. Shortly after this model was proposed, Wheals' group (18-20) published a set of studies indicating that the critical size model does not adequately explain yeast cell cycle control. Perhaps their most striking finding was a size-independent component of daughter cell G1 delay (18, 19). This size-independent G1 delay in daughters indicates that at least part of the daughter cell G1 delay is an intrinsic property of the daughter cell.
More recent work has established several mechanisms that produce differential gene expression between mother and daughter cells. The HO gene is expressed exclusively in mother cells (21). ASH1 mRNA is transported into the growing bud and accumulates only in daughter cells, where the Ash1 protein functions to block HO expression (22-24). In addition to Ash1, the Ace2 transcription factor accumulates exclusively in daughter cells (25, 26), and Ace2 target genes are expressed only in daughters (25). These results, demonstrating a daughter-specific pattern of gene expression, provide a conceptual framework to explain the intrinsic G1 delay in daughter cells.
We present work based on the hypothesis that daughter cell G1 delay depends on the specific localization of Ace2 to the daughter cell. In this model, daughter cell G1 delay would be determined not by cell size but by the asymmetric distribution of Ace2 between mother and daughter cells. We report that Ace2 delays G1 in daughter cells. Deletion of ACE2 produces daughter cells that proceed through G1 at the same rate as mother cells. In addition, an ACE2 (G128E) mutation that allows Ace2 to function in both mothers and daughters prolongs G1 in mothers, so that mother/daughter pairs proceed through G1 at the same rate. Ace2 acts as a negative regulator of CLN3 expression in daughter cells through an indirect mechanism.
Methods
Yeast Strains and Growth Conditions. Yeast were grown in YEPD media (1% yeast extract/2% peptone/2% glucose) and SD media (0.67% yeast nitrogen base/2% glucose) with auxotrophic supplements. Strains are listed in Table 2, which is published as supporting information on the PNAS web site, www.pnas.org.
Mutation of the CLN3 daughter delay elements (DDEs) is described in Supporting Text, which is published as supporting information on the PNAS web site. The altered DDE sequences are as follows: DDE1-TTCCAGTCTATC; DDE2-TCCGCATTTCTC; DDE3-TCGCCAATATCT; DDE4-AAGTCTCCCTCT. The mutations were confirmed by sequencing.
Plasmids. Plasmids expressing CLN3 from its own promoter were, or were derived from, pKL001 and pKL034 (27), which express CLN3 from the -930/0 fragment of the CLN3 promoter. Plasmids p414ADH, p424ADH, and p414TEF (28) were used to express CLN3 from the ADH1 and TEF1 promoters and were gifts from M. Funk (Institute of Molecular Biology and Tumour Research, Philipps-Universität Marburg, Marburg, Gemany). Plasmid construction is described in Supporting Text.
Time-Lapse Microscopy and Cell Size Determination. Strains were collected in log phase, transferred to SD-agarose slabs with coverslips, and grown at 30°C for observation at 10-min intervals. After formation of daughter cells, the next budding event was scored for a mother/daughter pair as simultaneous if both cells showed the first sign of bud emergence at the same time point. Mother budding first was scored if a bud was identified forming on the mother cell with no observable bud on the daughter cell. Daughter budding first was scored if a bud was observed forming on a daughter cell with no identifiable bud on the mother cell. Micrographs were measured by using NIH IMAGE Ver. 1.62 to determine cell volume at bud emergence by using the formula: volume = (π/6)ab2, where a is the major axis length, and b is the length of the minor axis (18). For both determinations, at least six sets of samples with n = 20-30 cells each were scored for each strain. Population cell size distributions were measured with a Coulter Counter Model Z2 (Beckman Coulter) by using a 70-μm aperture calibrated with 3-μm latex beads.
GFP. GFP fluorescence was measured by microscopy by using a Zeiss Axioplan 2 microscope with a ×100 oil immersion objective, equipped with a Hamamatsu ORCA-ER (Hamamatsu Photonics, Hamamatsu City, Japan) cooled charge-coupled device camera and recorded as TIFF files. NIH IMAGE Ver. 1.62 was used to integrate fluorescence intensity in mother/daughter pairs after subtracting the background signal measured in the adjacent area. For fluorescence, 300-msec exposures were used. Background fluorescence in control cells without GFP plasmid was undetectable at this exposure. The ratio of fluorescence in the mother over that in the daughter was calculated for each pair and averaged. Values are the averages from eight groups of eight pairs in each group. Separation of mother and daughter cells was determined by observation with differential interface contrast microscopy optics by using the methods described by Lord and Wheals (18). Pairs were chosen in which clear septation was visible; in addition, many of the pairs contained at least one budded cell, clearly indicative of completed mother/daughter separation.
RNA Preparation and Northern Blotting. Total yeast RNA was isolated and separated by formaldehyde gel electrophoresis, blotted, and probed as described (7).
Gel-Shift Assays. Gel shifts were performed as described (16). The probe was a double-stranded synthetic oligonucleotide (5′-GGA TTT AAC GTA TCC ATT GCA TTT CCT CAT TCG GTT TAA CTC CTC T-3′).
Southwestern Blots. The protocol described by Parviz et al. (15) was used for Southwestern blot preparation and probing with the fragment described above for the gel-shift experiments. Blots and gels were exposed by using a Molecular Dynamics PhosphorImager.
Results
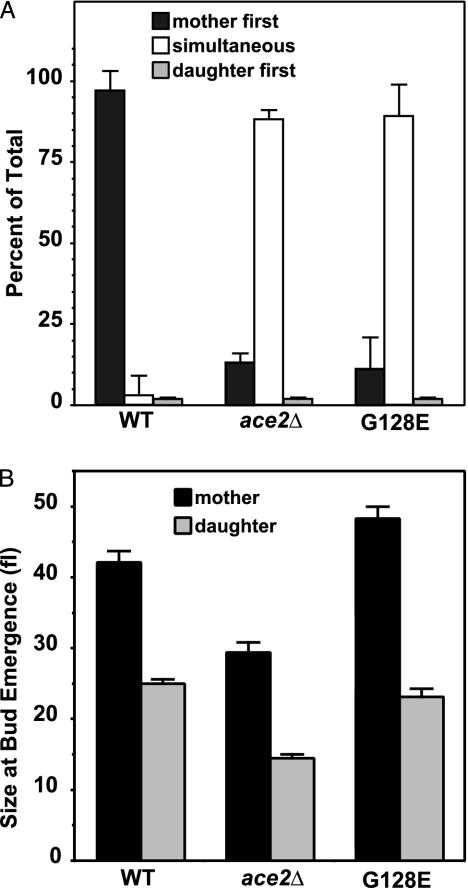
If daughter cell G1 length is determined by daughter-specific components rather than by daughter cell size, then blocking the molecular processes that specify differences between mothers and daughters should produce mother/daughter pairs with equivalent G1 lengths. We used time-lapse experiments to determine whether mutations in ACE2 cause simultaneous mother/daughter budding. In these experiments, we followed the formation of mother/daughter pairs and the subsequent emergence of new buds as mother and daughter completed the next G1 phase. For wild-type strains, the mother cell budded ahead of the daughter cell in >95% of the pairs examined (Fig. 1A). In contrast, we found that ace2Δ mothers and daughters budded simultaneously in ≈90% of the pairs examined, showing that the difference in G1 length between mothers and daughters depends on ACE2.
Fig. 1.
ACE2 and daughter cell G1 delay. (A) Time-lapse experiments. Wild-type (BY4741), ace2Δ (4088), and ace2Δ::ACE2G128E (TTL53) cells were grown as described in Methods. Formation of mother/daughter pairs was followed by using a ×40 objective, and pairs were scored as budding simultaneously if buds appeared on both mother and daughter in a pair that had been unbudded at the previous time point. (B) Images of newly budded cells were measured for long and short axis lengths by using NIH image Ver. 1.62, and cell volumes were calculated as described in Methods. Error bars indicate SEM.
Our experiments suggest that ace2Δ daughters have lost G1 delay and proceed through G1 like mother cells. We measured cell size at bud emergence as a measure of relative G1 length (Fig. 1B). As expected, ace2Δ daughter cells bud at a smaller size than wild-type daughters, indicative of a shortened G1. Because ace2Δ mother cells start out smaller than normal at the first bud emergence, they might be expected to remain smaller than their wild-type counterpart at subsequent rounds of bud formation. Consistent with this idea, deletion of ACE2 also decreased the average size of mother cells at bud emergence.
The converse situation, in which mother cells behave like daughters, is found in cells carrying a dominant ACE2 (G128E) mutation (25, 29), encoding an Ace2 protein not restricted to daughters (25, 29). In our model, Ace2 function in both mother and daughter cells should cause both mothers and daughters to be delayed in G1 equally. As predicted, the ACE2 (G128E) mutation also produces simultaneous budding in mother/daughter pairs (Fig. 1 A).
The presence of Ace2 protein in ACE2 (G128E) mother cells should prolong G1 in mothers to match daughter G1 length. As expected, we found that the ACE2 (G128E) mutation increased the cell size at bud emergence for mother cells, indicating a prolonged G1. Because Ace2 is normally present in daughters, we expected no effect of the ACE2 (G128E) mutation on daughter cell G1 length. Daughter cell size at bud emergence remained unchanged in the ACE2 (G128E) mutants (Fig. 1B).
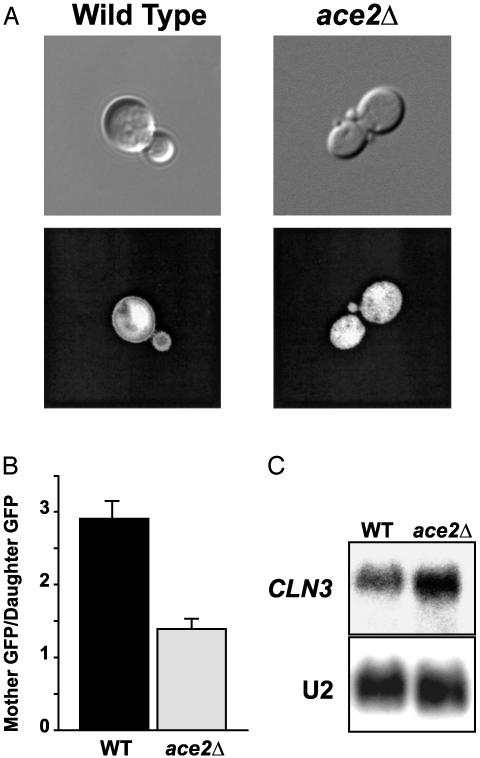
Ace2 and CLN3. Because CLN3 promotes passage through G1, a possible model is that Ace2 decreases expression of CLN3 in daughters, thereby delaying progress through G1. As a test, we constructed a GFP reporter driven by a CLN3 promoter fragment (from -751 to + 1). In wild-type cells, this reporter displayed a modest but consistent decrease in expression in daughter cells compared with mothers (Fig. 2A). This difference in CLN3 expression may be sufficient to explain the difference in G1 length between mothers and daughters. We found that the difference in CLN3-GFP fluorescence between mothers and daughters was abolished in an ace2Δ strain, indicating that Ace2 is necessary for the decreased CLN3-GFP expression in daughters.
Fig. 2.
ACE2 and CLN3 expression in daughter cells. (A) Wild-type and ace2Δ cells were transformed with the PCLN3-GFP reporter and examined in log phase growth by using a ×100 objective with differential interference contrast microscopy (Upper) and fluorescence (Lower). (B) NIH image Ver. 1.62 was used to measure fluorescence in TIFF files generated from mother/daughter pairs, as described in Methods, to yield a ratio of fluorescence in mothers over that in daughters. Average values from eight groups of eight pairs each are presented for each strain. Error bars indicate standard error of the mean. (C) Wild-type and ace2Δ cells were grown in YEPD media to a density of 1 OD660, and samples were collected for RNA preparation and Northern blotting with a CLN3 probe. U2 RNA was probed as a loading and transfer control.
We used fluorescence microscopy and NIH IMAGE to quantitate the difference in GFP levels between mother and daughter cells in wild-type and ace2 mutants. We chose this approach in place of flow cytometry because of the clumping phenotype of ace2Δ mutants. We observed a difference in overall GFP signal between mothers and daughters. This difference was largely abolished in the ace2Δ mutants (Fig. 2B).
A Northern blot shows that CLN3 mRNA levels increase overall when ACE2 is deleted (Fig. 2C). Taken together, these results indicate that the presence of Ace2 in daughter cells produces a decrease in CLN3 expression.
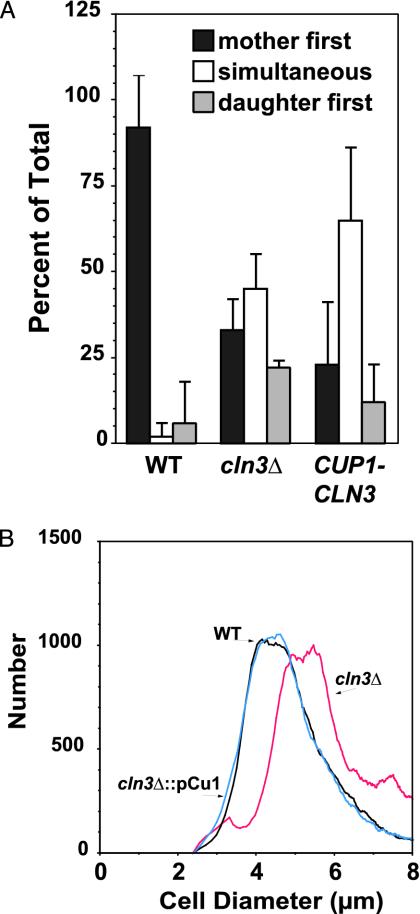
If Ace2 down-regulates CLN3 in daughters to cause a G1 delay, then CLN3 should be necessary for the normal difference in G1 length between mothers and daughters. We found that CLN3 deletion increased the fraction of mother/daughter pairs that budded simultaneously (Fig. 3A). This result indicates that CLN3 plays a role in this process. The effect of CLN3 deletion was not as dramatic as that seen with the ace2Δ strain, suggesting that CLN3 does not completely account for daughter cell G1 delay. Deletion of BCK2, a gene thought to play a parallel role to that of CLN3 in G1 regulation (30-32), had no effect on the budding pattern (not shown).
Fig. 3.
CLN3 regulation is necessary for daughter G1 delay. (A) Wild-type (DS10), cln3Δ (DM15), and cln3Δ::PCUP1-CLN3 (DM16) cells were grown on SD agar slabs for time-lapse scoring as described in Fig. 1. (B) The strains were grown to a density of 0.5 OD660 and collected at log phase for size measurements with a Coulter Counter Channelizer (Beckman Coulter) calibrated with 3-μm latex beads. WT, black trace; cln3Δ, red trace; cln3Δ::pCu1, blue trace.
CLN3 Regulatory Sequences. Ace2 might regulate CLN3 expression via 5′ elements upstream of the CLN3 ORF. There are potential Ace2-binding sites in the CLN3 promoter at positions -1185 and -1016. To test whether ACE2 affects G1 length via the CLN3 promoter, we expressed CLN3 from other promoters. cln3Δ cells carrying a plasmid in which CLN3 is expressed from the CUP1 promoter had a budding phenotype similar to that seen in ACE2 mutants, in which mothers and daughters budded simultaneously (Fig. 3A). This result demonstrates that CLN3 5′ regulatory sequences are required to produce differential G1 length between mothers and daughters.
Simultaneous mother/daughter budding was not simply the result of CLN3 overexpression. Increased CLN3 expression from a multicopy plasmid does not result in simultaneous mother/daughter budding, although it does shorten G1 in both mother and daughter cells, producing a decrease in modal cell size (Table 1). In contrast, expression of CLN3 from heterologous promoters invariably produced simultaneous budding, regardless of effects on cell size (Table 1). Consistent with previous results (1, 2), we found that cell size was inversely proportional to the strength of the promoter driving CLN3 expression. Interestingly, the cell size distribution of the cln3Δ cells expressing CLN3 from the CUP1 and TEF1 promoter constructs was very close to that of wild type. These results indicate that a normal cell size distribution is possible in cultures where mothers and daughters bud simultaneously (Table 1 and Fig. 3B).
Table 1. CLN3 expression and cell size.
| Strain | Simultaneous budding | Cell size | Relative expression |
|---|---|---|---|
| Wild type (DS10) | − | 42.5 ± 0.3 | |
| cln3Δ (DM16) | + | 57.6 ± 0.4 | |
| CLN3-DDEΔ (TL70) | + | 44.0 ± 2.9 | |
| cln3Δ::CEN PCLN3-CLN3 (TL28) | − | 50.1 ± 0.6 | |
| cln3Δ::2μ PCLN3-CLN3 (TL30) | − | 38.2 ± 1.0 | |
| cln3Δ::2μ PADH1-CLN3 (TL50) | + | 37.6 ± 0.3 | 90 |
| cln3Δ CEN PTEF1-CLN3 (TL32) | + | 39.9 ± 0.6 | 50 |
| cln3Δ::CEN PADH1-CLN3 (TL49) | + | 47.8 ± 0.7 | 3 |
Cells were grown in selective medium overnight and transferred to YEPD media for budding measurements and size measurements, as described in Methods. Relative expression levels of 2μ ADH1, CEN TEF1, and CEN ADH1 are from Mumberg et al. (28).
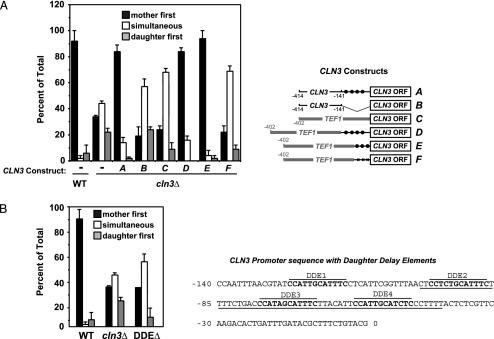
CLN3 promoter deletions were made to define regulatory regions required for G1 delay in daughter cells. CLN3 driven by a promoter fragment from -414 to 0 showed the normal mother-first budding pattern seen in wild-type cells, indicating that sequences within this region are sufficient to produce daughter cell G1 delay (Fig. 4A). The -414/0 promoter construct does not contain the Ace2 consensus sites at positions -1185 and -1016. In contrast, the -414 to -141 CLN3 promoter fragment did not produce normal budding, with mothers and daughters budding simultaneously, indicating that elements within the region from -140/0 are necessary for normal daughter G1 delay.
Fig. 4.
Elements in the CLN3 promoter mediate normal G1 delay in daughter cells. (A) Wild-type (DS10), cln3Δ (DM15), and cln3Δ cells carrying various centromeric plasmids expressing CLN3 from different test promoters were grown for time-lapse experiments as described for Fig. 1. Maps indicating the arrangement of the CLN3 expression constructs are shown (Right), with TEF1 sequence indicated by gray and DDEs indicated by filled circles. Promoter arrangements were: A, TL29, the -414/0 region of the CLN3 promoter; B, TL55, the -414-141 region of the CLN3 promoter; C, TL32, the -402/0 fragment from the TEF1 promoter; D, TL60, the TEF1 promoter with the -140/0 region of the CLN3 promoter; E, TL61, the TEF1 promoter with the -100/-41 region of the CLN3 promoter; F, TL62, the TEF1 promoter with the -100/-41 region of the CLN3 promoter in which the DDEs had been scrambled (indicated by Xs). (B) Wild-type (DS10), cln3Δ (DM15), and a strain carrying mutated DDEs upstream of the CLN3 ORF (TL70) were grown for time-lapse experiments as described. The -140/0 sequence from the CLN3 promoter is shown (Right) with DDEs indicated.
As with all heterologous promoter constructs tested, expression of CLN3 from the TEF1 promoter produced simultaneous mother/daughter budding (Fig. 4). However, we found that insertion of the -140/0 CLN3 promoter segment into the junction between the TEF1 promoter and the CLN3 ORF restored normal daughter cell G1 delay. The -140/0 region contains four copies of a repeated element with a consensus sequence of CCATTGCATTTC. Inserting three of these repeated elements (the underlined sequence in Fig. 4) between the TEF1 promoter and the CLN3 ORF also produced normal daughter cell G1 delay. In contrast, when we rearranged the bases within the repeated elements, the construct was no longer able to confer normal budding. We conclude that the repeated elements in the CLN3 promoter play a role in daughter cell G1 delay and refer to these sequences as daughter delay elements (DDEs).
Specific mutation of the CLN3 DDEs in our wild-type strain produced a loss of daughter cell G1 delay comparable to that seen with deletion of CLN3 (Fig. 4B). However, in contrast to CLN3 deletion, mutation of the DDEs affected only daughter G1 delay and had little effect on the modal cell size of the population (Table 1). This result shows that the CLN3 DDEs play an important role in daughter cell G1 delay.
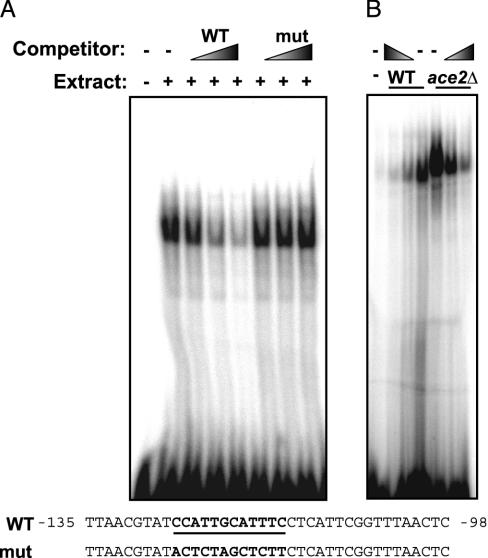
A gel shift using a probe containing the first of the DDEs produced a specific band that was more intense and retarded in mobility with ace2Δ mutant extract than with the wild-type extract (Fig. 5). This result indicates that the DDEs specifically interact with one or more proteins in yeast cell extracts, and that Ace2 alters the formation of the DDE-protein complex.
Fig. 5.
DDEs in the CLN3 promoter produce a specific gel-shift band. Gel-shift assays with 10-μg samples of yeast extract and the probe sequence indicated as wild type were performed as described in Methods. (A) Gel shift with wild-type extract and 10-, 25-, and 50-fold excess unlabeled wild-type (WT) or mutant (mut) competitor. (B) Gel shift with extracts from wild-type and ace2Δ cells.
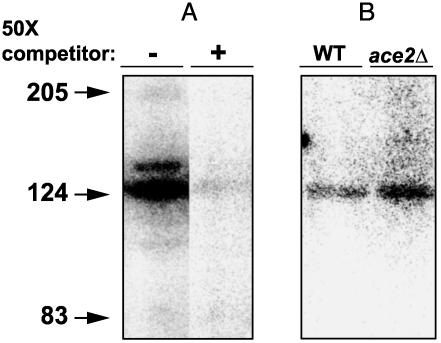
Southwestern blots demonstrated specific binding of labeled DDEs to a protein of ≈127 kDa (Fig. 6A). As with the gel-shift experiments, this band was more intense with extracts from an ace2Δ strain than with wild-type extracts (Fig. 6B).
Fig. 6.
A 126-kDA protein interacts with CLN3 promoter elements. (A) Extracts from wild-type and ace2Δ cells were separated by SDS gel electrophoresis (50 μg per lane) and transferred to nitrocellulose as described in Methods. Radiolabeled wild-type oligo was used to probe the blot in the presence or absence of a 50-fold excess of unlabeled oligo. (B) Extracts from wild-type and ace2Δ cells were separated and probed as described for A. Prestained molecular weight standards were as follows: myosin, 206 kDa; β-galactosidase, 124 kDa; and BSA, 83 kDa.
Discussion
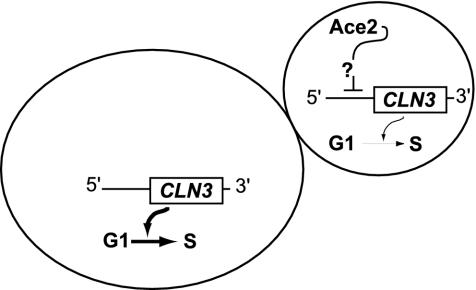
A Model for Daughter Cell G1 Delay. Fig. 7 presents a model in which the exclusive presence of Ace2 in daughter cells inhibits CLN3 expression, prolonging G1 in daughters. Mothers and daughters progress through G1 simultaneously in the absence of Ace2 or when Ace2 is distributed to both mothers and daughters.
Fig. 7.
Proposed model for daughter cell G1 delay.
It is noteworthy that the model presented above contradicts the commonly held model in which daughter cells are delayed in G1 until they reach the critical size for bud emergence. In the critical size model, the only distinction between mother and daughter is cell size. We propose that G1 delay is not related to cell size but is specified by asymmetric distribution of regulatory components. Our model is supported by a set of experiments conducted by Wheals' group two decades ago. In examining populations of mother and daughter cells of equivalent size, Lord and Wheals (18, 19) reported that daughter cells have a substantially longer G1 phase than mother cells, indicating that daughters have an intrinsic G1 delay that is cell size independent. Our results provide a mechanism to explain the intrinsic delay.
We also sought evidence supporting the critical size model. Cells might sense size through the rate of protein synthesis (33), which is higher in larger than in smaller cells (34). Cln3 translation is especially sensitive to the rate of overall protein synthesis (6, 7), and decreased Cln3 translation in the daughter cells would prolong G1. However, we found that deletion of the upstream ORF that links CLN3 translation to the rate of protein synthesis failed to alter mother/daughter budding (not shown).
Two genome-wide screens for altered cell size in S. cerevisiae have recently been reported (35, 36). Although these mutants have been described as affecting the critical size for passing START, our results suggest that S. cerevisiae cells may not have a size checkpoint at all. Instead, we suggest that yeast cells maintain their size by coordinating the rate of cellular growth with the rate of progress through G1. In this view, mutations that affect cell size have interrupted the balance between growth and progression through the cell cycle. Cln3/Cdc28 kinase activity is already known to be the target of a network of pathways that coordinate the rates of growth and G1 progression, (3-7, 9, 13-16, 37, 38). The critical size model is undeniably elegant. However, evolutionary mechanisms may favor complexity over elegance.
CLN3 Regulation. Although we have shown that the CLN3 DDEs are necessary and sufficient to produce daughter G1 delay, the connection between Ace2 and CLN3 is missing. Although many models are possible, perhaps the simplest one is that Ace2 inhibits an activator of CLN3. This latter model is attractive, because deletion of ACE2 increases the formation of protein/DNA complexes in gel-shift and Southwestern assays.
Although our CLN3-GFP experiments indicate decreased reporter in daughters, these experiments pose difficulties in interpretation. Because mother cells had stronger signal intensity and a larger cross-sectional area than the daughters, the GFP signal represents both reporter concentration and quantity. It is not clear whether Cln3 concentration or amount is the most important factor in regulating G1 length. In addition, plasmid distribution between mothers and daughters may be unequal. If so, the inequality depends largely on ACE2. We were unsuccessful with attempts to measure the signal from GFP integrated in place of the CLN3 ORF.
G1 Delay and Average Cell Size. Provided an appropriate level of CLN3 expression exists, strains in which mothers and daughters bud simultaneously can have a normal average cell size. We found that replacing the CLN3 5′ regulatory sequences with heterologous promoters invariably produced simultaneous mother/daughter budding. However, G1 length, and thus the average cell size of the population, depended on promoter strength, which is entirely consistent with a model in which Cln3 does not directly trigger START but instead governs G1 progression as a rate.
We conclude that daughter G1 delay is not required for a normal population cell size distribution. Instead, G1 delay may function to allow daughter cells more time in which to expand their metabolic resources before turning to new cell production.
Supplementary Material
Acknowledgments
We thank Paul Ahlquist (University of Wisconsin, Madison, WI), Roger Brent (Molecular Sciences Institute, Berkeley, CA), Fred Cross (Rockefeller University, New York), Martin Funk (MediGene, Munich), and Emmett Schmidt (Massachusetts General Hospital, Boston) for providing yeast strains and plasmids; and Maureen Barr for useful discussions. We acknowledge the valuable assistance of M. Trudel, C. Carbonara, S. Guillen, A. Miller, D. Porcaro, E. Gizewski, N. Rosenberg, J. Renbourn, and P. Hish. This work was supported by National Science Foundation Grants 9982537 and 0235379 (to W.H.) and National Institutes of Health Grant GM48624 (to D.J.S.).
Abbreviation: DDE, daughter delay element.
References
- 1.Cross, F. (1988) Mol. Cell. Biol. 8, 4675-4684. [DOI] [PMC free article] [PubMed] [Google Scholar]
- 2.Nash, R., Tokiwa, G., Anand, S., Erickson, K. & Futcher, A. B. (1988) EMBO J. 7, 4335-4346. [DOI] [PMC free article] [PubMed] [Google Scholar]
- 3.Jeoung, D.-I., Oehlen, L. J. W. M. & Cross, F. R. (1998) Mol. Cell. Biol. 18, 433-441. [DOI] [PMC free article] [PubMed] [Google Scholar]
- 4.Tyers, M. & Futcher, B. (1993) Mol. Cell. Biol. 13, 5659-5669. [DOI] [PMC free article] [PubMed] [Google Scholar]
- 5.Belli, G., Gari, E., Aldea, M. & Herrero, E. (2001) Mol. Microbiol. 39, 1022-1035. [DOI] [PubMed] [Google Scholar]
- 6.Polymenis, M. & Schmidt, E. V. (1997) Genes Dev. 11, 2522-2531. [DOI] [PMC free article] [PubMed] [Google Scholar]
- 7.Hall, D. D., Markwardt, D. D., Parviz, F. & Heideman, W. (1998) EMBO J. 17, 4370-4378. [DOI] [PMC free article] [PubMed] [Google Scholar]
- 8.Barbet, N. C., Schneider, U., Helliwell, S. B., Stansfield, I., Tuite, M. F. & Hall, M. N. (1996) Mol. Biol. Cell 7, 25-42. [DOI] [PMC free article] [PubMed] [Google Scholar]
- 9.Gallego, C., Gari, E., Colomina, N., Herrero, E. & Aldea, M. (1997) EMBO J. 16, 7196-7206. [DOI] [PMC free article] [PubMed] [Google Scholar]
- 10.Mai, B., Miles, S. & Breeden, L. L. (2002) Mol. Cell. Biol. 22, 430-441. [DOI] [PMC free article] [PubMed] [Google Scholar]
- 11.McInerny, C. J., Partridge, J. F., Mikesell, G. E., Creemer, D. P. & Breeden, L. L. (1997) Genes Dev. 11, 1277-1288. [DOI] [PubMed] [Google Scholar]
- 12.Hubler, L., Bradshaw-Rouse, J. & Heideman, W. (1993) Mol. Cell. Biol. 13, 6274-6282. [DOI] [PMC free article] [PubMed] [Google Scholar]
- 13.Parviz, F. & Heideman, W. (1998) J. Bacteriol. 180, 225-230. [DOI] [PMC free article] [PubMed] [Google Scholar]
- 14.Newcomb, L. L., Diderich, J. A., Slattery, M. G. & Heideman, W. (2003) Eukaryot. Cell 2, 143-149. [DOI] [PMC free article] [PubMed] [Google Scholar]
- 15.Parviz, F., Hall, D., Markwardt, D. & Heideman, W. (1998) J. Bacteriol. 180, 4508-4515. [DOI] [PMC free article] [PubMed] [Google Scholar]
- 16.Newcomb, L. L., Hall, D. D. & Heideman, W. (2002) Mol. Cell. Biol. 22, 1607-1614. [DOI] [PMC free article] [PubMed] [Google Scholar]
- 17.Johnston, G. C., Pringle, J. R. & Hartwell, L. H. (1977) Exp. Cell Res. 105, 79-98. [DOI] [PubMed] [Google Scholar]
- 18.Lord, P. & Wheals, A. (1981) J. Cell Sci. 50, 361-376. [DOI] [PubMed] [Google Scholar]
- 19.Lord, P. & Wheals, A. (1983) J. Cell Sci. 59, 183-201. [DOI] [PubMed] [Google Scholar]
- 20.Wheals, A. E. (1982) Mol. Cell. Biol. 2, 361-368. [DOI] [PMC free article] [PubMed] [Google Scholar]
- 21.Sil, A. & Herskowitz, I. (1996) Cell 84, 711-722. [DOI] [PubMed] [Google Scholar]
- 22.Bertrand, E., Chartrand, P., Schaefer, M., Shenoy, S. M., Singer, R. H. & Long, R. M. (1998) Mol. Cell 2, 437-445. [DOI] [PubMed] [Google Scholar]
- 23.Bobola, N., Jansen, R. P., Shin, T. H. & Nasmyth, K. (1996) Cell 84, 699-709. [DOI] [PubMed] [Google Scholar]
- 24.Takizawa, P. A., Sil, A., Swedlow, J. R., Herskowitz, I. & Vale, R. D. (1997) Nature 389, 90-93. [DOI] [PubMed] [Google Scholar]
- 25.Colman-Lerner, A., Chin, T. E. & Brent, R. (2001) Cell 107, 739-750. [DOI] [PubMed] [Google Scholar]
- 26.Weiss, E. L., Kurischko, C., Zhang, C., Shokat, K., Drubin, D. G. & Luca, F. C. (2002) J. Cell Biol. 158, 885-900. [DOI] [PMC free article] [PubMed] [Google Scholar]
- 27.Levine, K., Huang, K. & Cross, F. R. (1996) Mol. Cell. Biol. 16, 6794-803. [DOI] [PMC free article] [PubMed] [Google Scholar]
- 28.Mumberg, D., Muller, R. & Funk, M. (1995) Gene 156, 119-122. [DOI] [PubMed] [Google Scholar]
- 29.Racki, W. J., Becam, A.-M., Nasr, F. & Herbert, C. J. (2000) EMBO J. 19, 4524-4532. [DOI] [PMC free article] [PubMed] [Google Scholar]
- 30.Di Como, C. J., Chang, H. & Arndt, K. T. (1995) Mol. Cell. Biol. 15, 1835-1846. [DOI] [PMC free article] [PubMed] [Google Scholar]
- 31.Epstein, C. B. & Cross, F. R. (1994) Mol. Cell. Biol. 14, 2041-2047. [DOI] [PMC free article] [PubMed] [Google Scholar]
- 32.Wijnen, H. & Futcher, B. (1999) Genetics 153, 1131-1143. [DOI] [PMC free article] [PubMed] [Google Scholar]
- 33.Moore, S. A. (1988) J. Biol. Chem. 263, 9674-9681. [PubMed] [Google Scholar]
- 34.Woldringh, C. L., Huls, P. G. & Vischer, N. O. E. (1993) J. Bacteriol. 175, 3174-3181. [DOI] [PMC free article] [PubMed] [Google Scholar]
- 35.Jorgensen, P., Nishikawa, J. L., Breitkreutz, B. J. & Tyers, M. (2002) Science 297, 395-400. [DOI] [PubMed] [Google Scholar]
- 36.Zhang, J., Schneider, C., Ottmers, L., Rodriguez, R., Day, A., Markwardt, J. & Schneider, B. L. (2002) Curr. Biol. 12, 1992-2001. [DOI] [PubMed] [Google Scholar]
- 37.Breeden, L. L. (2003) Curr. Biol. 13, R31-R38. [DOI] [PubMed] [Google Scholar]
- 38.Colomina, N., Gari, E., Gallego, C., Herrero, E. & Aldea, M. (1999) EMBO J. 18, 320-329. [DOI] [PMC free article] [PubMed] [Google Scholar]
Associated Data
This section collects any data citations, data availability statements, or supplementary materials included in this article.


