

Abstract
We present a method for estimating the distribution of fitness effects of new amino acid mutations when those mutations can be assumed to be slightly advantageous, slightly deleterious, or strongly deleterious. We apply the method to mitochondrial data from several different species. In the majority of the data sets, the shape of the distribution is approximately exponential. Our results provide an estimate of the distribution of fitness effects of weakly selected mutations and provide a possible explanation for why the molecular clock is fairly constant across taxa and time.
What proportion of mutations are deleterious, neutral, and advantageous? What is the strength of selection that acts on nonneutral mutations? In short, what is the distribution of fitness effects of new mutations? This is one of the most fundamental problems in evolutionary biology, because it lies at the heart of several important questions. It is the question that has been debated for >30 years in the neutralist-selectionist debate (1, 2), but it is also central to our understanding of the molecular clock (3, 4) and the maintenance of genetic variation, at both the molecular and phenotypic levels (5, 6).
The distribution of fitness effects is central to our understanding of the molecular clock because certain distributions can stabilize the clock (7). Although there are exceptions, the molecular clock is remarkably constant over long periods of time, particularly for amino acid substitutions (8, 9). Under the neutral theory of molecular evolution, the rate of substitution per year is equal to uf, where u is the nucleotide mutation rate per year and f is the proportion of mutations that are neutral (2). However, there is no reason why the mutation rate per year should be constant across taxa; in fact, there is some evidence that suggests that the mutation rate is higher in organisms with short generation times (10-12). Ohta and Kimura (13) suggested a solution to this problem. They suggested that there might be a continuum of allelic effects, from very deleterious through slightly deleterious to neutral mutations, rather than the two categories of mutations, deleterious and neutral, proposed under the original neutral theory. Because deleterious mutations with effects less than 1/Ne are effectively neutral, the proportion of mutations of effectively neutral mutations, f, is lower in large populations. Thus, the rate of molecular evolution might be constant if species with short generation times, and hence fast mutation rates, tended to have large population sizes, and therefore low numbers of effectively neutral mutations, i.e., f and u might be negatively correlated. Ohta (4) showed theoretically that this was indeed the case; she showed that if the distribution of fitness effects was exponential and the mutation rate was proportional to the effective population size, then the two factors exactly cancelled each other out to yield a constant rate of molecular evolution. Kimura (3) later showed that if the distribution of fitness effects was gamma distributed with a shape parameter of 1/2, then the two cancelled each other out if the mutation rate was proportional to the square root of the effective population size.
Unfortunately, we know relatively little about the distribution of fitness effects, despite its importance. Analysis of mutation accumulation experiments suggest that the distribution of fitness effects for deleterious mutations is highly leptokurtic, with a few mutations having large fitness effects, and the vast majority having mild effects (14, 15). However, these analyses have very little power to tell us about the precise shape of the distribution of fitness effects; in Keightley's analyses, the mutation rate and the shape of the distribution of fitness effects are confounded with one another. The situation is a little better for advantageous mutations. Theoretical work suggests that the distribution of fitness effects is likely to be exponential (16, 17), and recent work with experimental populations of bacteria has confirmed that the distribution is leptokurtic, with the majority of adaptive mutations having small effects (18).
Analyses of DNA sequence data have also shed some light on the distribution of fitness effects of new mutations. It is evident from the highly conserved nature of most protein-coding sequences that most amino acid mutations are strongly deleterious. It has been estimated that ≈70% of all amino acid mutations have a deleterious effect of >2 × 10⁻⁵ (19). It has also become apparent that there is a class of slightly deleterious mutations, mutations that are sufficiently weakly selected that they can contribute to polymorphism and occasionally become fixed. The evidence for this category of mutations is threefold. First, the ratio of the nonsynonymous to the synonymous substitution rate is higher in species with smaller effective population sizes. This has been shown in mammals (12, 19, 20), Drosophila (19, 21), and birds (22); it is thought that a greater proportion of slightly deleterious amino acid mutations are fixed in the species with the smaller effective population size. Second, nonsynonymous polymorphisms segregate at lower frequencies than synonymous polymorphisms in some species. This has been shown in Drosophila (23, 24) and humans (25), and is thought to be caused by the segregation of slightly deleterious nonsynonymous mutations. Finally, it has been shown in several data sets that the ratio of the number of nonsynonymous (Pn) to synonymous (Ps) polymorphisms is greater than the ratio of the number of nonsynonymous (Dn) to synonymous (Ds) substitutions. This pattern is commonly seen in data sets where recombination is rare, including mitochondrial DNA (26, 27), the self-fertilizing plant Arabidopsis thaliana (28), and Escherichia coli (N. Smith and A.E.-W., unpublished results). If all mutations were either strongly deleterious or neutral, Pn/Ps would equal Dn/Ds; this is the basis of the McDonald-Kreitman (MK) test of neutral molecular evolution (29). However, if there is a class of slightly deleterious mutations, they tend to contribute to polymorphism, but rarely become fixed; they therefore lead to an excess of nonsynonymous polymorphism. Fay et al. (30) recently estimated that at least 20% of nonsynonymous mutations in humans are slightly deleterious.
Work has also started to elucidate the role of adaptive evolution at the DNA sequence level. Several studies have recently estimated that a substantial fraction of the amino acid substitutions in higher primates (30) and Drosophila (24, 31, 32) are a consequence of adaptive evolution rather than random genetic drift. However, inferring the number of advantageous mutations is difficult because the number of substitutions is a function of both the mutation rate to advantageous mutations and the strength of selection favoring them. We do not currently have independent estimates of either of these quantities.
Recently, Nielsen and Yang (33) have estimated the distribution of fitness effects by using DNA sequence data by considering the variation in the rate of substitution between different sites within a gene. They fit a number of distributions to primate mitochondrial DNA data and found some power to differentiate between models. The best fitting models were a normal and a gamma distribution. Both of these distributions fit the data significantly better than an exponential distribution.
Here we introduce a method, based on the MK test, to estimate the distribution of fitness effects from DNA sequence data. The method is suitable for estimating the distribution of fitness effects when there are no strongly advantageous mutations, i.e., all mutations are weakly selected or strongly deleterious.
Materials and Methods
The Method. The method is based on the MK test. In the MK test, we typically have a number of sequences of a gene from within a species and a single sequence from a different species. With data of this form, we can count the number of synonymous (Ps) and nonsynonymous (Pn) polymorphisms, and estimate the number of synonymous (Ds) and nonsynonymous (Dn) substitutions that have occurred between the two species. For our method, we also need estimates of the proportion of sites that are synonymous (ρS) and nonsynonymous (ρn). We deal with the practical aspects of how we estimate Ds, Dn, ρS, and ρn later.
Let us assume that synonymous mutations are neutral and that the distribution of fitness effects of nonsynonymous mutations follows some distribution Z(S). Under this model, assuming a standard Fisher-Wright model of evolution and free recombination we expect to observe
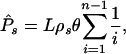 |
1 |
synonymous polymorphisms in a sample of n sequences of length L nucleotides (34), where θ = 4Neu for a diploid or 2Neu for a haploid, and u is the nucleotide mutation rate per generation. The number of nonsynonymous polymorphisms we expect to observe is
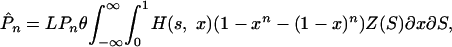 |
2 |
where
 |
and
 |
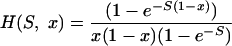
H(S, x) is the time a semidominant mutation with a selective advantage of S spends between x and x + dx (35, 36).
The expected number of synonymous substitutions is
 |
3 |
where λ = 2ut is the time of divergence between the two species under consideration. The expected number of nonsynonymous substitutions is
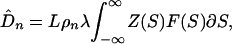 |
4 |
where
 |
F(S) is 2Ne (or Ne for a haploid) times the fixation probability of a semidominant mutation with selective advantage S (2). Note that we implicitly assume here, and in the actual implementation of this method, that the time of divergence is much greater than the age of polymorphisms being considered, and that we can therefore ignore any contribution polymorphism makes to the apparent divergence between the two species.
Because we have four observations, we can potentially estimate four parameters; we need to estimate θ and λ, but this then leaves us with two degrees of freedom to estimate two parameters that describe the distribution of fitness effects of nonsynonymous mutations.
Distribution of Fitness Effects. We have chosen to model the distribution of fitness effects in four ways. In the first model (model 1), we assume that all nonsynonymous mutations are equally deleterious with a selective disadvantage of S. In the second model (model 2), we assume that all nonsynonymous mutations are deleterious, but that they are gamma distributed:
 |
5 |
The gamma distribution provides us with considerable flexibility; the distribution can take a number of shapes, which allows the relative proportions of mutations that are effectively neutral, slightly deleterious (or advantageous), and strongly deleterious to vary independently of each other. For example, if β << 1, then most mutations are either neutral or strongly deleterious, the relative proportions being dictated by the value of α; if β ≈ 1, then a substantial proportion of mutations are neutral, slightly deleterious, and strongly deleterious; and if β >> 1, then most mutations fit into one particular category. Bimodal distributions cannot be modeled by using the gamma distribution.
However, both model 1 and 2 are unrealistic because they assume that all mutations are deleterious. It seems likely, particularly for weakly selected mutations, that each slightly deleterious mutation is matched by a slightly advantageous mutation; for example, if a T mutation occurs at a site that is fixed for C, and has an disadvantage of -S, then a C mutation at the same site, when it is fixed for T, will have a selective advantage of +S. This is the model used to describe the evolution of synonymous codon use (for example, see refs. 37 and 38). If we have a site at which allele A1 has an advantage of +S over allele A2 and the mutation rate is the same between the two alleles, then the time the site will be fixed for A1 is
 |
6 |
(37, 38). This leads to two new models. If we assume that all pairs of alleles have the same absolute strength of selection, the realized distribution of fitness effects will be as follows: a proportion X(S) of the mutations will be selectively disadvantageous with selection -S, and a proportion [1-X(S)] will be selectively advantageous with selection +S (model 1a). For the gamma distribution, the distribution becomes
 |
7 |
(model 2a). We might refer to this as a partially reflected gamma (PRG) distribution, because part of the distribution is reflected around the y axis. Examples of PRG distributions are given in Fig. 1.
Fig. 1.

Some examples of partially reflected gamma distributions. The probability density is plotted as a function of S, the strength of selection. The curves in descending order of leptokurtosis are for shape parameters of 0.5, 1, and 2. Each distribution has a mean value of 1.
Parameter Estimation. To estimate the parameters of our models, we assumed that Pn, Ps, Dn, and Ds are independent Poisson distributed variables, so the likelihood of the data given the parameters of the model is
 |
8 |
where
 |
In reality, Pn, Ps, Dn, and Ds are neither independently nor Poisson distributed because recombination is not free in the data sets we have considered, and we have corrected for multiple hits in the divergence data. For models 2 and 2a, there was generally a set of parameters that gives a perfect fit of the model to the data because there are four parameters and four observations. Although Eqs. 2 and 4 should be integrated between -∞ and +∞, this was not necessary; it turned out to be adequate to integrate the functions between -1,000 and 1,000. To find the maximum likelihood or point estimates, we followed the slope of steepest ascent, as implemented in the mathematica routine findminimum. mathematica routines to perform the analyses are available on request.
For a number of data sets, we estimated the confidence intervals for our maximum likelihood (ML) estimates by performing a random walk of 4,000 steps around the ML parameter estimates by using the Metropolis-Hastings algorithm (39). The confidence intervals estimated by this method are underestimates because free recombination is assumed. Graphical analysis showed that 4,000 steps was sufficient to estimate the confidence intervals.
Data. We have applied our method to mitochondrial data from several species. To compile the data, we considered each of the data sets given in the compilations of Nachman (26), Rand and Kann (40), and Gerber et al. (27). If several data sets shared sequences in common, we randomly selected a data set so that data sets were independent. To these data sets we added a data set of complete human mitochondrial sequences with chimpanzee used as the outgroup (41). For each of these data sets, we took a single sequence from each of the two species being considered and calculated the numbers of synonymous and nonsynonymous substitutions by using the fcodon model of Goldman and Yang (42) as implemented in paml (43). We excluded any data set in which there were more than two synonymous substitutions per site (full details of all data sets analyzed can be found in Table 5, which is published as supporting information on the PNAS web site, www.pnas.org). This left us with 18 of a total of 26 data sets. We used the polymorphism counts given by Nachman (26), Rand and Kann (40), and Gerber et al. (27), unless they combined polymorphism counts from different species, in which case we selected the species with the greatest number of sequences and calculated the number of polymorphisms by using dnasp (44). To estimate the proportion of sites that are nonsynonymous and synonymous, we used the estimates from the Goldman-Yang method; the Goldman-Yang method estimates of the proportion of sites as the proportion of mutations that are nonsynonymous and synonymous, and are therefore appropriate for our application (42). The data are summarized in Table 1.
Table 1. The 18 data sets analyzed.
| Data set | Polymorphism species | Outgroup species | Gene | n | L | ρn | Dn | Ds | Pn | Ps | NI |
|---|---|---|---|---|---|---|---|---|---|---|---|
| AL | Ambystoma laterale | Ambystoma jeffersonianum | cytb | 10 | 306 | 0.71 | 3 | 90 | 1 | 4 | 7.5 |
| BM | Brachyramphus marmoratus | Brachyramphus brevirostris | cytb | 14 | 1,041 | 0.75 | 1 | 118 | 1 | 13 | 9.1 |
| DM | Drosophila melanogaster | Drosophila simulans | nd5 | 59 | 1,515 | 0.90 | 19 | 157 | 11 | 17 | 5.4 |
| DP | Drosophila pseudoobscura | Drosophila miranda | nd5 | 22 | 1,399 | 0.87 | 9 | 174 | 2 | 19 | 2.0 |
| FC | Fringilla coelebs | Fringilla teydea | cytb, atp6, nd5 | 15 | 1,283 | 0.83 | 11 | 96 | 13 | 63 | 1.8 |
| GA | Grus antigone | Grus rubicunda | cytb | 9 | 1,143 | 0.78 | 3 | 41 | 7 | 10 | 9.6 |
| GC | Gila cypha | Gila elegans | Nd2 | 18 | 758 | 0.6 | 17 | 69 | 1 | 5 | 0.8 |
| GM | Gadus morhua | Gadus ogac | cytb | 41 | 300 | 0.66 | 0 | 20 | 3 | 22 | >1 |
| HS | Homo sapiens | Pan troglodytes | All | 53 | 11,259 | 0.68 | 186 | 1,765 | 91 | 320 | 2.7 |
| IB | Isothrix bistriata | Isothrix pagurus | cytb | 10 | 798 | 0.71 | 15 | 150 | 15 | 103 | 1.5 |
| MA | Microtus arvalis | Microtus rossiaemeridionalis | cytb | 10 | 1,143 | 0.72 | 12 | 80 | 13 | 20 | 4.3 |
| MD | Mus domesticus | Mus spretus | nd3 | 56 | 342 | 0.67 | 3 | 57 | 11 | 13 | 16 |
| MH | Mesomys hispidus | Mesomys stimulax | cytb | 29 | 798 | 0.69 | 7 | 120 | 30 | 118 | 4.4 |
| PI | Passerella iliaca | Melospiza melodia | cytb | 19 | 431 | 0.78 | 12 | 186 | 5 | 10 | 7.8 |
| PL | Phyllobates lugubris | Dendrobates pumilio | cytb | 8 | 292 | 0.71 | 7 | 156 | 11 | 59 | 4.2 |
| PT | Pomatostomus temporalis | Pomatostomus isidori | cytb | 35 | 282 | 0.72 | 9 | 118 | 0 | 17 | 0.0 |
| SA | Sciurus aberti | Sciurus niger | cytb | 20 | 1,140 | 0.68 | 26 | 487 | 12 | 38 | 5.9 |
| UA | Ursus arctos | Helarctos malayanus | cytb | 166 | 1,140 | 0.64 | 23 | 167 | 11 | 44 | 1.8 |
n is the number of sequences in the first species listed, L is the length of the sequence, and NI is the neutrality index. Dn and Pn are numbers of nonsynonymous substitutions and polymorphisms, respectively; Ds and Ps are numbers of synonymous substitutions and polymorphisms, respectively.
Results
Although our method for estimating the distribution of fitness effects is seemingly quite general, it can in practice only be applied to data sets in which there are few strongly advantageous mutations. This is because advantageous mutations decouple polymorphism and substitution: if the advantageous mutations are under directional selection, they contribute little to polymorphism, and if they are under balancing selection, they contribute little to divergence. We have therefore applied the method to data sets in which the data appear to be dominated by deleterious mutations, namely, data sets in which an MK test shows an excess of amino acid polymorphism (Table 1). Such a pattern is most readily interpreted as being caused by the segregation of slightly deleterious mutations in a gene that has undergone little adaptive substitution.
It has previously been reported that many mitochondrial DNA data sets show an excess of amino acid polymorphism in an MK test. We compiled data from 18 pairs of species, which are summarized in Table 1. As in previous analyses, we find that the vast majority of data sets show an excess of amino acid polymorphism (16 of 18, P < 0.01); this is also true if we analyze those data sets that were excluded because their level of synonymous substitution was too high (8 of 8 data sets P < 0.01; see Table 5). The proportion of data sets showing an excess of amino acid polymorphism is somewhat higher than others have found, because we have corrected for multiple substitutions.
To begin our analysis, we fit a simple model in which we assumed that all mutations were equally deleterious (model 1). Estimates of the average strength of selection are given in Table 2. Our estimates are slightly different to those given by Nachman (26) because he did not correct the divergence for multiple hits. Interestingly, the fit of the model is often poor and can be rejected in a goodness-of-fit test in 12 of the 18 data sets. However, it should be noted that the goodness-of-fit test is only approximate because Pn, Ps, Dn, and Ds are not multinomially distributed as assumed under the test (see above).
Table 2. Parameter estimation and goodness of fit test for models 1 and 1a.
|
Model 1
|
Model 1a
|
|||
|---|---|---|---|---|
| Species | S | G test | |S| | G test |
| AL | −6.2 | NS | 7.0 | NS |
| BM | −8.8 | ** | 9.5 | ** |
| DM | −6.2 | ** | 7.0 | ** |
| DP | −7.0 | ** | 7.8 | ** |
| FC | −6.2 | ** | 6.9 | ** |
| GA | −5.8 | NS | 6.6 | NS |
| GC | −3.0 | NS | 3.9 | NS |
| GM | −120 | NS | 120 | NS |
| HS | −4.6 | ** | 4.9 | ** |
| IB | −5.6 | ** | 6.3 | ** |
| MA | −4.4 | NS | 5.3 | NS |
| MD | −5.4 | NS | 6.2 | NS |
| MH | −6.5 | ** | 7.2 | ** |
| PI | −5.8 | * | 6.6 | * |
| PL | −6.5 | ** | 7.2 | ** |
| PT | −5.3 | ** | 6.2 | ** |
| SA | −5.5 | ** | 6.3 | ** |
| UA | −4.1 | ** | 4.9 | ** |
See Table 1 for species abbreviations. NS, not significant. *, P < 0.05. **, P < 0.01.
The poor fit of the model could be because we have assumed that all mutations are deleterious, because it seems likely that if some mutations are slightly deleterious, then other mutations will be slightly advantageous. However, the fit of model 1a is no better than model 1 (Table 2).
A more likely reason for the poor fit of model 1 is that there is variation in the strength of selection between mutations, with some mutations being very deleterious, whilst others are only mildly deleterious or neutral. We therefore fit a model in which all mutations were assumed to be deleterious, but in which the strength of selection was assumed to be gamma distributed (model 2). The model fits the data perfectly in all but two data sets, but this is not surprising because we have four parameters for the four observations (Table 3). The model does not fit the data from Pomatostomus (PT) and Gila (GC) because these data sets do not show an excess of amino acid polymorphism; the best fitting model appears to be one in which the α is infinitely large and β is infinitely small.
Table 3. Parameter estimation under models 2 and 2a.
|
Model 2
|
Model 2a
|
|||||
|---|---|---|---|---|---|---|
| Species | α | β | s̄ | α | β | s̄ |
| AL | 1.1 × 10⁻² | 1.1 | −100 | 1.7 × 10⁻² | 1.3 | 76 |
| BM | 9.2 × 10⁻⁴ | 0.91 | −990 | 1.4 × 10⁻³ | 1.0 | 710 |
| DM | 3.5 × 10⁻⁴ | 0.58 | −1,700 | 5.8 × 10⁻⁴ | 0.67 | 1200 |
| DP | 3.7 × 10⁻⁷ | 0.34 | −920,000 | 3.3 × 10⁻⁶ | 0.42 | 130,000 |
| FC | 3.7 × 10⁻⁶ | 0.31 | −84,000 | 2.5 × 10⁻⁵ | 0.39 | 16,000 |
| GA | 6.3 × 10⁻² | 1.6 | −25 | 1.0 × 10⁻¹ | 2.2 | 22 |
| GC | ∞ | 1/∞ | - | ∞ | 1/∞ | - |
| GM | 3.3 × 10⁻² | 4.7 | −140 | 3.8 × 10⁻² | 5.3 | 140 |
| HS | 2.7 × 10⁻⁴ | 0.39 | −1,400 | 5.7 × 10⁻⁴ | 0.47 | 820 |
| IB | 4.5 × 10⁻⁷ | 0.23 | −510,000 | 8.7 × 10⁻⁶ | 0.30 | 34,000 |
| MA | 3.7 × 10⁻² | 1.0 | −27 | 6.8 × 10⁻² | 1.4 | 21 |
| MD | 1.5 × 10⁻¹ | 2.2 | −15 | 2.4 × 10⁻¹ | 3.3 | 14 |
| MH | 1.6 × 10⁻³ | 0.62 | −390 | 2.8 × 10⁻³ | 0.74 | 260 |
| PI | 1.1 × 10⁻² | 0.99 | −90 | 1.6 × 10⁻² | 1.2 | 75 |
| PL | 3.0 × 10⁻³ | 0.75 | −250 | 5.5 × 10⁻³ | 0.93 | 170 |
| PT | ∞ | 1/∞ | - | ∞ | 1/∞ | - |
| SA | 7.8 × 10⁻³ | 0.85 | −110 | 1.3 × 10⁻² | 1.1 | 85 |
| UA | 2.8 × 10⁻⁶ | 0.21 | −75,000 | 5.3 × 10⁻⁶ | 0.23 | 43,000 |
See Table 1 for species abbreviations.
The shape of the gamma distribution, as measured by the parameter β, is quite consistent across data sets: the value lies between 0 and 4.7, with the majority of data sets being between 0.2 and 1.0; the mean of β is 0.93 (SE = 0.26). In contrast to the shape, the location of the distribution, as measured by either α or the mean strength of selection, varies by several orders of magnitude between data sets: e.g., S̄ varies from -15 to -920,000. The values of α and β tend to be very similar under model 2a, when some of the mutations are allowed to be slightly advantageous (Table 3). For all data sets α and β are greater than under model 2, with average strength of selection being somewhat lower, as we would expect given that some of the mutations are advantageous.
Unfortunately, because we have corrected the number of substitutions for multiple hits, and because there is little or no recombination in mitochondrial DNA, we cannot estimate confidence intervals for the parameters or test whether is significant variation in α or β (or S̄) between data sets. However, we can estimate the minimum confidence interval by assuming that Dn, Ds, Pn, and Ps are poisson distributed, i.e., we assume that there is free recombination in our data sets and we have not corrected for multiple hits. If we do this, we find the confidence intervals for β to be generally quite small, and those for α and S̄ to be very large. For example, for model 2 in humans β = 0.39 with confidence intervals of 0.36 and 0.50, α = 0.00027 (0.00015, 0.0012), and S̄ = -1,400 (-420, -2,400), and in Drosophila melanogaster β = 0.58 (0.48, 2.0), α = 0.00035 (0.000097, 0.081), and S̄ = -1,700 (-25, -5,000).
Discussion
We have developed a method to estimate the distribution of fitness effects from a combination of polymorphism and divergence data. The method can be applied to any data set in which one category of mutations are neutral and the other category are either weakly advantageous, neutral or deleterious. The method cannot be applied to data sets in which there many are strongly advantageous mutations. We have applied our method to a range of mitochondrial data sets in which the ratio of nonsynonymous to synonymous changes is greater for polymorphism than substitution. This pattern appears to be remarkably consistent across mitochondrial data sets and is consistent with a low rate of adaptive amino acid substitution and the segregation of slightly deleterious mutations.
We have shown that many data sets do not appear to fit simple models in which all mutations are equally deleterious, or in which the absolute strength of selection is the same for all mutations, but some mutations are advantageous and some are deleterious. This is perhaps not surprising, because there is ample evidence from studies of mutations with measurable phenotypic effects that mutations vary considerably in their effects on fitness (45).
A model in which the strength of selection varies according to a gamma distribution fits all but two of the data sets perfectly, the data sets that do not fit the model perfectly are those that do not show an excess of amino acid polymorphism. The shape of the gamma distribution varies relatively little between data sets; β varies between 0 and 4.7 for model 2, and between 0 and 5.3 for model 2a. The mean shape parameters are 0.93 (0.26) and 1.2 (0.3), respectively, where the numbers in parentheses are standard errors. These results contrast strongly with those of Nielsen and Yang (33), who estimated the distribution of fitness effects by considering the variation in the rate of substitution between sites in primate mitochondrial DNA. They found that a gamma distribution with a shape parameter of 3.22 (or a normal distribution) fit the data significantly better than an exponential distribution, the best fitting gamma distribution was one in which a substantial fraction of the mutations had S values between -5 and -0.1. In contrast, the distributions we have estimated have relatively few mutations in the range -5 < S < -0.1; for example, if we consider the distribution we have estimated from humans, just 7% of the mutations lie in the range -5 < S <-0.1, whereas this fraction is 98% in the gamma distribution estimated by Nielsen and Yang (33) (and about half of this when they include a fraction of strongly deleterious mutations). The reason for the difference between their results and ours is not obvious, both methods make many assumptions and use rather different data. Possibly the most conspicuous difference between their method and ours, besides the use of polymorphism data, is their assumption that the strength of selection on new mutations is constant through time at a particular codon. In contrast, we make the assumption that just the distribution of S across sites is constant through time. More work will be needed to resolve the differences between the results from these two methods.
Gamma distributions with the shapes we have estimated from mitochondrial DNA have the interesting property that the average probability of fixation is proportional to a function of the inverse of the effective population size [f ≈ (1/Ne)β] (3, 4, 46). These distributions therefore have the potential to make the molecular clock more robust if species with high mutation rates tend to have large effective population sizes. We might expect population size and mutation rate to be correlated, because species with large effective population sizes tend to have short generation times (46), and there is some evidence that species with short generation times have high mutation rates (10-12).
However, if the distribution of fitness effects is exponential (i.e., β = 1), as our data suggest, then the ratio of the nonsynonymous to the synonymous substitution rate, hereafter the dn/ds ratio, is expected be proportional to the inverse of the effective population size, and this is not seen for the limited data we have. We are assuming here, as we do in our method to infer the distribution of fitness effects, that synonymous mutations are neutral and that nonsynonymous mutations are deleterious; dn/ds therefore provides an estimate of f, the proportion of mutations that are effectively neutral, or equivalently, the average probability of fixation relative to that of neutral mutations. The effective population size of Mus domesticus appears to be ≈10-fold greater than that of hominids both for nuclear (19) and mitochondrial genes (unpublished results). However, the dn/ds ratio is ≈2-fold higher in human-chimpanzee than mouse-rat for nuclear genes (19), and also 2-fold higher in human-chimpanzee than M. domesticus-Mus spretus for mitochondrial genes (see Table 1). So, given the difference in effective population size and the mean estimate of β, we would expect a 10-fold difference in the dn/ds ratio; this is not observed, the difference is only 2-fold. However, one might argue that data sets that do not reject model 1 are uniformative about the distribution of fitness effects and therefore should be ignored. If we ignore those data sets, then the mean value of β = 0.52 (0.09); under such a distribution, we would predict that the dn/ds ratio should be ≈3-fold higher in hominids than rodents, which is more consistent with what is observed.
We have made a number of assumptions in developing our method. First, we have assumed that there are few strongly advantageous mutations. Advantageous mutations potentially have two effects, a direct effect and an indirect effect secondary effect. If there are some strongly advantageous mutations, then a proportion of the nonsynonymous substitutions or nonsynonymous polymorphisms are a consequence of adaptive evolution. To investigate the consequences of adaptive substitution and polymorphism, we reanalyzed the human data set, assuming that 25, 50, and 75% of the substitutions were a consequence of adaptive substitution; to do this, we reduced Dn by 25, 50, and 75%, respectively. Likewise, to investigate the effect of balancing selection on some amino acid mutations, we reduced Pn by 25, 50, and 75%. The results are presented in Table 4. Interestingly adaptive substitution has relatively little effect on the estimates of β. The effect of balanced polymorphism is a little more marked, particularly on α, but even here the basic nature of the distribution is not greatly affected.
Table 4. Parameter estimation under model 2a assuming a proportion of substitutions or polymorphisms are adaptive.
|
Proportion of adaptive substitution
|
Proportion of balanced polymorphism
|
|||||||
|---|---|---|---|---|---|---|---|---|
| Data set | 0 | 0.25 | 0.5 | 0.75 | 0.25 | 0.5 | 0.75 | |
| HS | α | 5.7 × 10⁻⁴ | 1.3 × 10⁻³ | 2.7 × 10⁻³ | 6.0 × 10⁻³ | 6.6 × 10⁻⁵ | 2.8 × 10⁻¹³ | ∞ |
| HS | β | 0.47 | 0.58 | 0.75 | 1.0 | 0.35 | 0.11 | 1/∞ |
See Table 1 for data set details.
Advantageous mutations will also have indirect effects either by the process of genetic hitchhiking (6), in the case of adaptive substitutions, or by leading to the effective subdivision of the population, in the case of a balanced polymorphism. We have also assumed that the population size is stationary, that sampling was random, that synonymous mutations are neutral, and that there is free recombination. The direct effect of assuming free recombination, when there is in fact little or no recombination, would be to lead to an underestimate of the variance associated with our estimates. The indirect effect of assuming free recombination is to ignore the effects of genetic hitchhiking (6), background selection (5), and weak Hill-Robertson interference (37). The fact that the shape parameter estimate is fairly constant across data sets, which come from diverse taxa, suggests that this result is robust to these complications.
It is, at first sight, puzzling why the estimate of the shape parameter is consistent across data sets and robust to assumptions about the level of advantageous mutation. However, the results are perhaps not surprising given two facts: (i) there is an excess of amino acid polymorphism in almost all mitochondrial DNA data sets, and (ii) there is variation in the strength of selection on amino acid polymorphisms. Between them, these two facts constrain the shape parameter: the shape parameter cannot be too small or there would be very few slightly deleterious mutations; when β < 0.1, almost all mutations are either strongly deleterious or neutral. However, the shape parameter cannot be too large, because we know there is variation in the strength of selection acting on deleterious mutations (45).
We have assumed that the distribution of fitness effects is gamma distributed because this is a flexible monotonic distribution. However, other distributions would fit the data; for example, a model in which a proportion of mutations are slightly deleterious, and the remaining mutations are strongly deleterious fits the data, as does a model in which the strongly deleterious class is replaced by a neutral class (although, of course, the proportion of slightly deleterious mutations and the strength of selection acting on them would differ substantially between the two models). In fact, many distributions may fit the data; it is therefore be best to regard our analysis as demonstrating that a gamma distribution is consistent with the mitochondrial DNA data.
Supplementary Material
Acknowledgments
We thank Sebastien Gourbiere, Nicolas Bierne, Peter Keightley, and two anonymous referees for helpful comments. G.P. is supported by a Federation of European Biochemical Societies long-term fellowship. A.E.W. is supported by the Royal Society and the Biotechnology and Biological Sciences Research Council.
This paper was submitted directly (Track II) to the PNAS office.
Abbreviation: MK, McDonald-Kreitman.
References
- 1.Gillespie, J. H. (1991) The Causes of Molecular Evolution (Oxford Univ. Press, Oxford).
- 2.Kimura, M. (1983) The Neutral Theory of Molecular Evolution (Cambridge Univ. Press, Cambridge, U.K.).
- 3.Kimura, M. (1979) Proc. Natl. Acad. Sci. USA 76, 3440-3444. [DOI] [PMC free article] [PubMed] [Google Scholar]
- 4.Ohta, T. (1977) in Molecular Evolution and Polymorphism, ed. Kimura, M. (Nat. Inst. of Genetics, Mishima, Japan), pp. 148-167.
- 5.Charlesworth, B., Morgan, M. T. & Charlesworth, D. (1993) Genetics 134, 1289-1303. [DOI] [PMC free article] [PubMed] [Google Scholar]
- 6.Maynard Smith, J. & Haigh, J. (1974) Genet. Res. 23, 23-35. [PubMed] [Google Scholar]
- 7.Ohta, T. (1992) Annu. Rev. Ecol. Syst. 23, 263-286. [Google Scholar]
- 8.Wilson, A. C., Carlson, S. S. & White, T. J. (1977) Annu. Rev. Biochem. 46, 573-639. [DOI] [PubMed] [Google Scholar]
- 9.Zuckerkandl, E. & Pauling, L. (1965) in Evolving Genes and Proteins, eds. Bryson, V. & Vogel, H. J. (Academic, New York), pp. 97-166. [DOI] [PubMed]
- 10.Mooers, A. O. & Harvey, P. H. (1994) Mol. Phyl. Evol. 3, 344-350. [DOI] [PubMed] [Google Scholar]
- 11.Bromham, L., Rambaut, A. & Harvey, P. H. (1996) J. Mol. Evol. 43, 610-621. [DOI] [PubMed] [Google Scholar]
- 12.Li, W.-H., Tanimura, M. & Sharp, P. M. (1987) J. Mol. Evol. 25, 330-342. [DOI] [PubMed] [Google Scholar]
- 13.Ohta, T. & Kimura, M. (1971) J. Mol. Evol. 1, 18-25. [DOI] [PubMed] [Google Scholar]
- 14.Keightley, P. D. (1996) Genetics 144, 1993-1999. [DOI] [PMC free article] [PubMed] [Google Scholar]
- 15.Keightley, P. D. & Caballero, A. (1997) Proc. Natl. Acad. Sci. USA 94, 3823-3827. [DOI] [PMC free article] [PubMed] [Google Scholar]
- 16.Orr, H. A. (2003) Genetics 163, 1519-1526. [DOI] [PMC free article] [PubMed] [Google Scholar]
- 17.Gillespie, J. H. (1983) Theor. Popul. Biol. 23, 202-215. [DOI] [PubMed] [Google Scholar]
- 18.Imhof, M. & Schlotterer, C. (2001) Proc. Natl. Acad. Sci. USA 98, 1113-1117. [DOI] [PMC free article] [PubMed] [Google Scholar]
- 19.Eyre-Walker, A., Keightley, P. D., Smith, N. G. C. & Gaffney, D. (2002) Mol. Biol. Evol. 19, 2142-2149. [DOI] [PubMed] [Google Scholar]
- 20.Ohta, T. (1995) J. Mol. Evol. 40, 56-63. [DOI] [PubMed] [Google Scholar]
- 21.Akashi, H. (1996) Genetics 144, 1297-1307. [DOI] [PMC free article] [PubMed] [Google Scholar]
- 22.Johnson, K. P. & Seger, J. (2001) Mol. Biol. Evol. 18, 874-881. [DOI] [PubMed] [Google Scholar]
- 23.Akashi, H. (1999) Genetics 151, 221-238. [DOI] [PMC free article] [PubMed] [Google Scholar]
- 24.Fay, J., Wycoff, G. J. & Wu, C.-I. (2002) Nature 415, 1024-1026. [DOI] [PubMed] [Google Scholar]
- 25.Cargill, M., Altshuler, D., Ireland, J., Sklar, P., Ardlie, K., Patil, N., Lane, C. R., Lim, E. P., Kalyanaraman, N., Nemesh, J., et al. (1999) Nat. Genet. 22, 231-238. [DOI] [PubMed] [Google Scholar]
- 26.Nachman, M. W. (1998) Genetica 102, 61-69. [PubMed] [Google Scholar]
- 27.Gerber, A. S., Loggins, R., Kumar, S. & Dowling, T. (2001) Annu. Rev. Genet. 35, 539-566. [DOI] [PubMed] [Google Scholar]
- 28.Weinreich, D. M. & Rand, D. M. (2000) Genetics 156, 385-399. [DOI] [PMC free article] [PubMed] [Google Scholar]
- 29.McDonald, J. H. & Kreitman, M. (1991) Nature 351, 652-654. [DOI] [PubMed] [Google Scholar]
- 30.Fay, J., Wycoff, G. J. & Wu, C.-I. (2001) Genetics 158, 1227-1234. [DOI] [PMC free article] [PubMed] [Google Scholar]
- 31.Bustamante, C. D., Nielsen, R., Sawyer, S. A., Olsen, K. M., Purugganan, M. D. & Hartl, D. L. (2002) Nature 416, 531-534. [DOI] [PubMed] [Google Scholar]
- 32.Smith, N. G. C. & Eyre-Walker, A. (2002) Nature 415, 1022-1024. [DOI] [PubMed] [Google Scholar]
- 33.Nielsen, R. & Yang, Z. (2003) Mol. Biol. Evol. 20, 1231-1239. [DOI] [PubMed] [Google Scholar]
- 34.Watterson, G. A. (1975) Theor. Popul. Biol. 7, 256-276. [DOI] [PubMed] [Google Scholar]
- 35.Wright, S. (1938) Proc. Natl. Acad. Sci. USA 24, 253-259. [DOI] [PMC free article] [PubMed] [Google Scholar]
- 36.Sawyer, S. A. & Hartl, D. L. (1992) Genetics 132, 1161-1176. [DOI] [PMC free article] [PubMed] [Google Scholar]
- 37.Li, W.-H. (1987) J. Mol. Evol. 24, 337-345. [DOI] [PubMed] [Google Scholar]
- 38.Bulmer, M. (1991) Genetics 129, 897-907. [DOI] [PMC free article] [PubMed] [Google Scholar]
- 39.Metropolis, N., Rosenbluth, A., Rosenbluth, M., Teller, A. & Teller, E. (1954) J. Chem. Phys. 21, 1087-1095. [Google Scholar]
- 40.Rand, D. M. & Kann, L. M. (1998) Genetica 102/103, 393-407. [PubMed] [Google Scholar]
- 41.Ingman, M., Kaessman, H., Paabo, S. & Gyllensten, U. (2000) Nature 408, 708-713. [DOI] [PubMed] [Google Scholar]
- 42.Goldman, N. & Yang, Z. (1994) Mol. Biol. Evol. 11, 725-736. [DOI] [PubMed] [Google Scholar]
- 43.Yang, Z. (1997) Comput. Appl. Biosci. 13, 555-556. [DOI] [PubMed] [Google Scholar]
- 44.Rozas, J. & Rozas, R. (1999) Bioinformatics 15, 174-175. [DOI] [PubMed] [Google Scholar]
- 45.Mackay, T. F. (2001) Nat. Rev. Genet. 2, 11-20. [DOI] [PubMed] [Google Scholar]
- 46.Chao, L. & Carr, D. E. (1993) Evolution (Lawrence, Kans.) 47, 688-690. [DOI] [PubMed] [Google Scholar]
Associated Data
This section collects any data citations, data availability statements, or supplementary materials included in this article.