

Short abstract
The full extent to which gene expression in cancer cells is modulated by extrinsic factors remains to be determined. Global gene-expression profiles of tumors produced from two cancer cell lines transplanted subcutaneously into immunodeficient mice were determined, based on analysis of expression of human genes, and compared with expression profiles of the cell lines grown in culture.
Abstract
Background
Tumor cells cultured in vitro are widely used to investigate the molecular biology of cancers and to evaluate responses to drugs and other agents. The full extent to which gene expression in cancer cells is modulated by extrinsic factors and by the microenvironment in which the cancer cells reside remains to be determined. Two cancer cell lines (A549 lung adenocarcinoma and U118 glioblastoma) were transplanted subcutaneously into immunodeficient mice to form tumors. Global gene-expression profiles of the tumors were determined, based on analysis of expression of human genes, and compared with expression profiles of the cell lines grown in culture.
Results
A bioinformatics approach associated genes that showed changes in their expression levels with functional classes as defined by either the GO gene annotations or MeSH terms in the literature. The classes of genes expressed at higher levels in cells grown in vitro indicated increased cell division and metabolism, reflecting the more favorable environment for cell proliferation. In contrast, in vivo tumor growth resulted in upregulation of a significant number of genes involved in the extracellular matrix (ECM), cell adhesion, cytokine and metalloendopeptidase activity, and neovascularization. When placed in comparable tissue environments, the U118 cells and the A549 cells expressed different sets of ECM and cell adhesion-related genes, suggesting different mechanisms of extracellular interaction at work in the different cancers.
Conclusions
Studies of this type allow us to examine the specific contribution of cancer cells to gene expression patterns within an in vivo tumor mixed with non-cancerous tissue.
Background
Since the 'seed and soil' hypothesis of Paget in the 19th century [1], it has been understood that the microenvironment, or 'soil,' surrounding the tumor 'seed' plays a critical part in its development. However, investigations into the molecular biology of cancers are often carried out on cells grown in vitro in culture, where the environment is unlike that of the in vivo tissue environment in which cancers naturally develop. The effects of these environmental differences on cancer cells may account, in part, for the fact that only a small percentage of anticancer drugs that are found to effectively kill cells in vitro are successful in subsequent animal and human studies. In this study, we explored the changes that occur at the transcriptome level as cells grown in vitro are transplanted into an in vivo environment, where they develop as a tumor. The in vivo environment represented here is that of the subcutaneous intrascapular region of the nude mouse. Two different cell lines were studied: A549, derived from human lung adenocarcinoma, and U118, derived from human brain glioblastoma. Our study examined the differences in global gene expression between A549 mouse xenograft tumors and A549 cell cultures and between U118 xenograft tumors (grown in the same location as the A549 tumors) and U118 cultures. We looked for in vivo versus in vitro differences that were common to the two cell lines, and for differences that were found in one cell line but not the other.
In modeling mechanisms of cancer development, global gene-expression profiling of human-derived cells grown as tumors in mice has some distinct advantages over profiling of tumors obtained from patients. Whereas a great deal of genetic variability exists among different tumors from different patients, lesser genetic heterogeneity would be expected in xenografts of cancer cells originally derived from a single patient. Furthermore, patient-derived tumors are composed of both cancer and non-cancer cells, making it difficult to precisely ascertain gene-expression patterns specifically attributable to cancer cells. For example, in many cancer microarray studies, the actual percentage of cancer cells in a profiled sample may be as low as 30-40% [2]. Even when using techniques such as laser capture microdissection, which can improve tumor purity [3], the relative contribution of cancer cells and non-cancer cells to the overall gene-expression profile remains uncertain. In contrast, profiling human genes expressed in a mouse xenograft using a human microarray chip might uncover genes specifically expressed in human cancer cells in xenograft tumors comprised of a mixture of human- and mouse-derived cells [4].
The data obtained in a microarray experiment can be overwhelming, and the challenge is to understand, on a global systems level, the biology behind the differences in expression observed in hundreds of genes. In this study, we have searched for 'significantly enriched' classes of genes among all differentially expressed genes. These are classes or functional categories of genes that appear overrepresented in the set of differentially expressed genes. As a result, valuable clues could emerge as to the dominant biological features or processes that might underlie the coordinate expression of these genes. Such clues could be especially convincing if it can be shown that the enriched classes are unlikely to represent a chance occurrence. Gene classes can be defined by common gene annotations or concepts from the biomedical literature.
Results
Global differences in gene expression between xenograft tumors and cell cultures
A549 and U118 cells were each transplanted subcutaneously into the intrascapular region of immunodeficient mice, within which sizable tumors developed after 21 days. Global mRNA expression profiles from these tumors, using Affymetrix HuGeneFL chips, were compared with profiles obtained from the cell lines as grown in culture. Between the A549 xenograft tumors and the A549 cell cultures, 357 genes (375 probe sets) differed significantly at p < 0.01 with a fold change greater than two either way (134 genes being higher in tumors and 223 genes being higher in culture), a number much greater than the 24 to be expected by chance, as determined by permutation testing. Between the U118 xenograft tumors and cell cultures, 368 genes (387 probe sets) differed significantly (112 genes being higher in tumors and 256 genes being higher in culture), with 29 expected false positives due to chance. Table 1 shows the genes with highest expression in tumors compared with cultures, for each of the cell lines.
Table 1.
Top 30 genes showing higher expression in xenograft tumors over cultures for each cell line ranked by fold change
| Probe set | Gene | Gene product description |
| Higher in U118 tumors over cultures (p < 0.01, fold change > 5) | ||
| V00594_s_at | MT2A | Metallothionein 2a |
| M33552_at | LSP1 | Lymphocyte-specific protein 1 |
| U41518_at | AQP1 | Aquaporin 1 (channel-forming integral protein, 28 kD) |
| Z24680_at | GARP | Glycoprotein A repetitions predominant |
| J04599_at | BGN | Biglycan |
| J03278_at | PDGFRB | Platelet-derived growth factor receptor, beta polypeptide |
| M11718_at | COL5A2 | Collagen, type V, alpha 2 |
| L08096_s_at | TNFSF7 | Tumor necrosis factor (ligand) superfamily, member 7 |
| D87002_cds2_at | POM121L1 | Similar to rat integral membrane glycoprotein POM121 |
| HG2994-HT4850_s_at | ELN | Elastin (supravalvular aortic stenosis, Williams-Beuren syndrome) |
| Z74615_at | COL1A1 | Collagen, type I, alpha 1 |
| M57399_at | PTN | Pleiotrophin (heparin binding growth factor 8, neurite growth-promoting factor 1) |
| L07807_s_at | DNM1 | Dynamin 1 |
| Z74616_s_at | COL1A2 | Collagen, type I, alpha 2 |
| L38486_at | MFAP4 | Microfibrillar-associated protein 4 |
| X14885_rna1_s_at | TGFB3 | Transforming growth factor, beta 3 |
| U24488_s_at | TNXB | Tenascin XB |
| D86479_at | AEBP1 | AE-binding protein 1 |
| M80563_at | S100A4 | S100 calcium-binding protein A4 |
| M18533_at | DMD | Dystrophin (muscular dystrophy, Duchenne and Becker types |
| HG945-HT945_s_at | ZNF9 | Zinc finger protein 9 (a cellular retroviral nucleic acid binding protein) |
| M93221_at | MRC1 | Mannose receptor, C type 1 |
| D12485_at | ENPP1 | Ectonucleotide pyrophosphatase/phosphodiesterase 1 |
| HG1078-HT1078_at | FLJ10254 | Hypothetical protein FLJ10254 |
| HG2810-HT2921_at | HOXA10 | Homeo box A10 |
| M24351_cds3_s_at | PTHLH | Parathyroid hormone-like hormone |
| D13666_s_at | OSF-2 | Osteoblast specific factor 2 (fasciclin I-like) |
| Z37976_at | LTBP2 | Latent transforming growth factor beta binding protein 2 |
| M35878_at | IGFBP3 | Insulin-like growth factor binding protein 3 |
| X04412_at | GSN | Gelsolin (amyloidosis, Finnish type) |
| Higher in A549 tumors over cultures (p < 0.01, fold change > 10) | ||
| Z19574_rna1_at | KRT17 | Keratin 17 |
| M29540_at | CEACAM5 | Carcinoembryonic antigen-related cell adhesion molecule 5 |
| M35252_at | TM4SF3 | Transmembrane 4 superfamily member 3 |
| HG371-HT26388_s_at | MUC1 | Mucin 1, transmembrane |
| X52003_at | TFF1 | Trefoil factor 1 (breast cancer, estrogen-inducible sequence expressed in) |
| U40434_at | MSLN | Mesothelin |
| Z48314_s_at | MUC5AC | Mucin 5, subtypes A and C, tracheobronchial/gastric |
| M57730_at | EFNA1 | Ephrin-A1 |
| L24203_at | TRIM29 | Tripartite motif-containing 29 |
| U17760_rna1_at | LAMB3 | Laminin, beta 3 (nicein (125 kD), kalinin (140 kD), BM600 (125 kD)) |
| U04313_at | SERPINB5 | Serine (or cysteine) proteinase inhibitor, clade B (ovalbumin), member 5 |
| J05068_at | TCN1 | Transcobalamin I (vitamin B12 binding protein, R binder family) |
| AB006781_s_at | LGALS4 | Lectin, galactoside-binding, soluble, 4 (galectin 4) |
| K01396_at | SERPINA1 | Serine (or cysteine) proteinase inhibitor, clade A), member 1 |
| M27436_s_at | F3 | Coagulation factor III (thromboplastin, tissue factor) |
| V01512_rna1_at | FOS | v-Fos FBJ murine osteosarcoma viral oncogene homolog |
| M18728_at | CEACAM6 | Carcinoembryonic antigen-related cell adhesion molecule 6 |
| HG2981-HT3127_s_at | CD44 | CD44 antigen (homing function and Indian blood group system) |
| U37283_at | MAGP2 | Microfibril-associated glycoprotein-2 |
| U78551_at | MUC5B | Mucin 5, subtype B, tracheobronchial |
| S77410_at | AGTR1 | Angiotensin receptor 1 |
| J04469_at | CKMT1 | Creatine kinase, mitochondrial 1 (ubiquitous) |
| S73591_at | TXNIP | Thioredoxin interacting protein |
| Y00318_at | IF | I factor (complement) |
| M35878_at | IGFBP3 | Insulin-like growth factor binding protein 3 |
| M34309_at | ERBB3 | v-Erb-b2 avian erythroblastic leukemia viral oncogene homolog 3 |
| M95787_at | TAGLN | Transgelin |
| L34155_at | LAMA3 | Laminin, alpha 3 (nicein (150 kD), kalinin (165 kD), BM600 (150 kD), epilegrin) |
| U65932_at | ECM1 | Extracellular matrix protein 1 |
| D87953_at | NDRG1 | N-Myc downstream regulated |
Genes in bold were found upregulated in xenograft tumors over cultures for both cell lines with p < 0.05 in each. For A549, underlined genes were also found upregulated in lung tumors over A549 cultures with p < 0.05. For U118, underlined genes were also found upregulated in brain tumors over U118 cultures with p < 0.05.
From histological analysis the amount of mouse tissue in a xenograft tumor was estimated between 10 and 20%. To determine the extent of hybridization with the human HuGeneFL chip that might be attributable to mouse RNA, a sample of mouse lung tissue was also profiled. Whereas the total amount of hybridization measured in the xenograft tumor profiles was comparable to that of the culture profiles with equal amounts of RNA, the total hybridization measured in the mouse control profile was found to be about one-fifth that of a xenograft profile, with the same amount of RNA. As the control profile was from a sample of 100% mouse tissue, the contribution of mouse genes to differences observed in gene expression between cell cultures and tumors was considered to be minimal. From a comparison of the individual probe-set intensities of the mouse lung profile with those of the culture profiles, and assuming a 20% contribution of mouse tissue to the human xenograft sample, we estimate that in only about 20 out of the 7,069 probe sets on the HuGeneFL chip (a number on the level of measurement noise in a microarray experiment) would the amount of hybridization from mouse tissue alone have been high enough to account for greater than twofold changes between cell cultures and tumors. In contrast, nearly 800 probe sets showed a greater than twofold increase on average from A549 culture profiles to A549 xenograft tumor profiles. It can therefore be concluded that, in all but a handful of genes, the numerous significant changes observed in gene expression in the xenograft tumors are due to the cancerous (human) cells and not the surrounding (mouse) host tissue.
Principal components were extracted from the cell culture and xenograft expression data using all 7,069 probe sets considered in the analysis. The first principal component captures the greatest fraction of the overall variance in gene expression; the second captures the greatest fraction of variance subject to being independent of the first, and so on. From the first two principal components, a pair of coordinates was determined for each xenograft and cell culture profile to construct a two-dimensional view that reflects the relative locations of the profiles in the higher-dimensional space. On the same two-dimensional view, we plotted one dataset of 86 profiles from lung adenocarcinomas and another dataset of 45 profiles from glioblastomas and astrocytomas, generated from previous global gene-expression studies [5,6]. Figure 1 shows this principal components analysis (PCA) plot of the gene-expression profiles from cell cultures, xenografts, and human lung and brain tumors. Although none of the human tumor profiles was used to define the principal components coordinate space, lung tumor profiles appear well separated on the plot from brain tumor profiles. A549 profiles (both xenograft and culture) are grouped with lung tumors rather than brain tumors, and U118 profiles, with brain tumors rather than lung tumors. Of the 134 genes found expressed more highly in A549 xenograft tumors over A549 cultures (p < 0.01, fold change > 2), 70 were also higher in stage I adenocarcinomas over A549 cultures (p < 0.05). Of the 112 genes upregulated in U118 xenograft tumors over cultures, 50 were also higher in high-grade glioblastomas over U118 cultures (p < 0.05).
Figure 1.
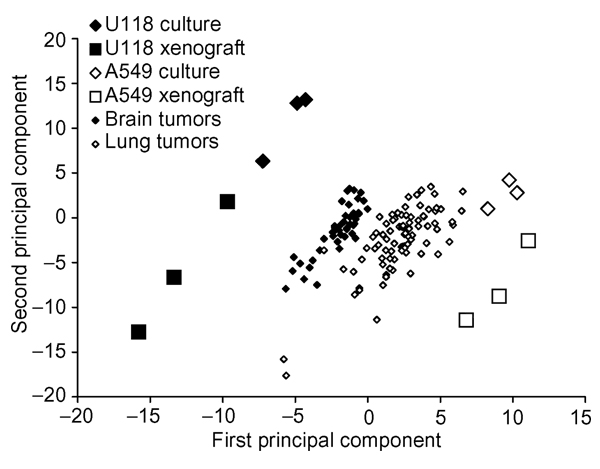
Principal components analysis (PCA) plot of global gene-expression profiles from cell cultures, xenografts, and human lung and brain tumors. Principal components were extracted from the cell culture and xenograft expression data (but not the lung and brain tumor data) using all 7,029 HuGeneFL probe sets. The first two principal components are shown.
Overrepresentation of genes involved in cell division and metabolism among genes upregulated in cancer cells in culture relative to xenografts
Searches were made for significantly enriched gene classes, as defined by Gene Ontology (GO) annotation or Medical Subject Heading Index (MeSH) term association (see Materials and methods), for both the set of 223 genes upregulated in the A549 cell cultures over A549 tumors and the set of 256 genes upregulated in the U118 cell cultures over the U118 tumors (p < 0.01, fold change > 2). In each case, the p-values for the most enriched classes appeared highly significant compared to what would be expected, based on simulation results, in a randomly selected set of the same number of genes. For example, for the A549 set of 223 genes, 35 enriched LocusLink annotation terms were found that had a p-value less than 1.9E-03, where one term with a p-value less than 1.9E-03 would be expected in a given set of 223 randomly selected genes. Out of 100 simulation tests, no single test had more than eight terms with a p-value less than 1.9E-03. Table 2 shows the top gene classes found in both the A549 set and the U118 set with p-values less than 0.05. There are far more gene classes common to both gene sets with p < 0.05 in each than would be expected in two randomly selected gene sets of 223 and 256 (for example, for the MeSH term classes, 37 were found to be significantly enriched in the actual data, whereas about two would be expected to occur by chance, see Table 2).
Table 2.
Significantly enriched classes arising both in genes higher in A549 cell cultures over tumors and in genes higher in U118 cell cultures over tumors (p < 0.05 in both sets)
| Category | Term | Gene count in A549 set of 223 | Gene count in U118 set of 256 | Gene count in entire set of 5,682 | p-value A549 set | p-value U118 set |
| GO term annotation (0.95 terms expected, found 46) | ||||||
| Biological process | Alcohol metabolism | 10 | 15 | 110 | 1.07E-02 | 1.06E-04 |
| Biological process | Aromatic compound metabolism | 7 | 6 | 23 | 1.87E-05 | 4.16E-04 |
| Biological process | Biosynthesis | 31 | 27 | 330 | 3.88E-06 | 1.69E-03 |
| Biological process | Cell cycle | 31 | 33 | 327 | 3.20E-06 | 8.11E-06 |
| Biological process | Cell proliferation | 36 | 39 | 535 | 7.98E-04 | 1.53E-03 |
| Biological process | Cytokinesis | 8 | 6 | 39 | 1.06E-04 | 7.36E-03 |
| Biological process | DNA metabolism | 16 | 12 | 120 | 1.52E-05 | 7.46E-03 |
| Biological process | DNA replication | 13 | 10 | 81 | 1.30E-05 | 3.22E-03 |
| Biological process | G1/S transition of mitotic cell cycle | 5 | 7 | 39 | 1.73E-02 | 1.55E-03 |
| Biological process | Metabolism | 108 | 134 | 2278 | 6.12E-03 | 3.34E-05 |
| Biological process | Mitotic cell cycle | 9 | 10 | 54 | 2.14E-04 | 1.20E-04 |
| Biological process | Nucleotide biosynthesis | 10 | 5 | 31 | 1.52E-07 | 1.16E-02 |
| Biological process | Regulation of CDK activity | 5 | 6 | 23 | 1.68E-03 | 4.16E-04 |
| Biological process | Tricarboxylic acid cycle | 3 | 5 | 12 | 1.01E-02 | 1.09E-04 |
| Molecular function | ATP binding activity | 29 | 33 | 425 | 2.18E-03 | 1.28E-03 |
| Molecular function | Cyclin-dependent protein kinase activity | 6 | 8 | 25 | 3.23E-04 | 8.44E-06 |
| Molecular function | Enzyme activity | 90 | 109 | 1466 | 8.76E-07 | 1.70E-09 |
| Molecular function | Ligase activity | 14 | 11 | 72 | 5.40E-07 | 3.28E-04 |
| Molecular function | Lyase activity | 8 | 8 | 75 | 8.69E-03 | 1.88E-02 |
| Molecular function | Nucleotide binding activity | 40 | 42 | 564 | 1.28E-04 | 6.40E-04 |
| MeSH term association (2.2 terms expected, found 37) | ||||||
| Anatomy | Intracellular membranes | 21 | 30 | 344 | 2.79E-02 | 3.20E-04 |
| Anatomy | Mitochondria | 38 | 52 | 607 | 2.17E-03 | 2.46E-06 |
| Biological sciences | Active transport, Cell nucleus | 23 | 23 | 329 | 4.68E-03 | 2.26E-02 |
| Biological sciences | Cell cycle | 62 | 66 | 980 | 4.19E-05 | 2.82E-04 |
| Biological sciences | DNA replication | 30 | 33 | 440 | 1.84E-03 | 2.28E-03 |
| Biological sciences | Genes, lethal | 17 | 16 | 211 | 3.61E-03 | 2.78E-02 |
| Biological sciences | Mitosis | 28 | 37 | 484 | 2.30E-02 | 8.57E-04 |
| Biological sciences | Mutagenesis | 52 | 55 | 940 | 4.84E-03 | 2.07E-02 |
| Biological sciences | Oxidative stress | 30 | 36 | 454 | 2.98E-03 | 5.13E-04 |
| Biological sciences | S phase | 21 | 22 | 272 | 2.12E-03 | 5.18E-03 |
| Chemicals and drugs | Acetyl coenzyme A | 4 | 4 | 24 | 1.32E-02 | 2.10E-02 |
| Chemicals and drugs | Adenosinetriphosphatase | 30 | 36 | 416 | 7.50E-04 | 9.02E-05 |
| Chemicals and drugs | Antineoplastic agents | 49 | 55 | 897 | 8.09E-03 | 8.39E-03 |
| Chemicals and drugs | Cyclin B | 10 | 15 | 101 | 5.96E-03 | 3.87E-05 |
| Chemicals and drugs | Cyclin-dependent kinases | 21 | 30 | 336 | 2.22E-02 | 2.12E-04 |
| Chemicals and drugs | Cysteine endopeptidases | 26 | 29 | 418 | 1.21E-02 | 1.22E-02 |
| Chemicals and drugs | Multienzyme complexes | 35 | 35 | 512 | 7.14E-04 | 7.58E-03 |
| Chemicals and drugs | Phosphoglucomutase | 5 | 6 | 30 | 5.68E-03 | 1.88E-03 |
| Chemicals and drugs | RNA nucleotidyltransferases | 5 | 5 | 33 | 8.60E-03 | 1.51E-02 |
| Diseases | Carcinoma in situ | 6 | 7 | 55 | 1.99E-02 | 1.11E-02 |
Taken together, the significantly enriched classes found for both the A549 and the U118 genes in cell culture compared with tumors are highly indicative of processes of cell division and metabolism, with significant MeSH term classes for the two gene sets including 'Cell cycle' (62 genes for A549, 66 genes for U118), 'DNA replication' (30,33), 'Mitosis' (28,37), 'Mitochondria' (38,52), and 'Cyclin-dependent kinases' (21,30); and significant GO terms including 'Cell proliferation' (36,39), 'Metabolism' (108,134), 'Cytokinesis' (8,6), 'Tricarboxylic acid cycle' (3,5), and 'G1/S transition' (5,7). A search for enriched gene classes was also made for 157 genes that were expressed more highly (p < 0.05, fold change > 2) in both A549 and U118 cell cultures over tumors, and the significant classes found were the same, or of the same nature, as the classes listed in Table 2. For the entire set of enriched classes for genes upregulated in cell cultures over the xenograft tumors, including which genes belong to which classes, see Additional data files and [7].
Overrepresentation of genes involved in cell adhesion, the extracellular matrix, and vascularization among genes upregulated in cancer cells in xenografts relative to cultures
As with the genes expressed at higher levels in culture compared to xenografts, searches were made for significantly enriched GO and MeSH term classes for the set of 134 genes with significantly higher expression (p < 0.01, fold change > 2) in the A549 tumors over the A549 cell cultures and the set of 112 genes upregulated in the U118 tumors over the U118 cell cultures. Again, in each case, the p-values for the most enriched classes found were quite significant over what would be expected by chance. For example, for the A549 set of 134 genes, 36 enriched MeSH terms were found that had a p-value less than 7E-04, where one term would be expected to have p less than 7E-04 in a set of 134 randomly selected genes; out of 100 simulation tests, no single test had more than six terms with a p-value less than 7E-04. Table 3 shows the top gene classes found in both the A549 set and the U118 set with p-values less than 0.05.
Table 3.
Significantly enriched classes arising both in genes upregulated in A549 xenograft tumors over cell lines and in genes upregulated in U118 tumors over cell cultures (p < 0.05 in both sets)
| Category | Term | Gene count in A549 set of 134 | Gene count in U118 set of 112 | Gene count in entire set of 5,682 | p-value A549 set | p-value U118 set |
| GO term annotation (0.58 terms expected, found 2) | ||||||
| Biological process | Cell adhesion | 14 | 9 | 233 | 0.001092 | 0.039587 |
| Molecular function | Metal ion binding activity | 16 | 16 | 411 | 0.031462 | 0.006317 |
| MeSH term association (2.2 terms expected, found 42) | ||||||
| Anatomy | Basement membrane | 9 | 5 | 96 | 3.94E-04 | 4.04E-02 |
| Anatomy | Endothelium, vascular | 29 | 26 | 829 | 1.67E-02 | 9.33E-03 |
| Anatomy | Epithelium | 22 | 15 | 451 | 7.63E-04 | 3.04E-02 |
| Anatomy | Fibroblasts | 40 | 35 | 1215 | 1.25E-02 | 8.92E-03 |
| Anatomy | Microfilaments | 7 | 6 | 124 | 2.66E-02 | 3.51E-02 |
| Anatomy | Stem cells | 23 | 20 | 665 | 3.69E-02 | 3.42E-02 |
| Biological sciences | Cell adhesion | 26 | 21 | 697 | 1.09E-02 | 2.96E-02 |
| Biological sciences | Cell differentiation | 53 | 46 | 1780 | 2.53E-02 | 1.76E-02 |
| Biological sciences | Cell movement | 29 | 23 | 792 | 9.13E-03 | 3.36E-02 |
| Biological sciences | Gene expression regulation, neoplastic | 54 | 37 | 1301 | 3.92E-06 | 8.56E-03 |
| Biological sciences | Neutrophil infiltration | 3 | 3 | 34 | 4.51E-02 | 2.86E-02 |
| Chemicals and drugs | Collagen | 28 | 33 | 516 | 1.89E-05 | 4.25E-10 |
| Chemicals and drugs | Complementarity determining regions | 4 | 4 | 32 | 6.37E-03 | 3.36E-03 |
| Chemicals and drugs | Cytokines | 28 | 26 | 808 | 2.10E-02 | 6.70E-03 |
| Chemicals and drugs | DNA, neoplasm | 27 | 22 | 705 | 6.70E-03 | 1.81E-02 |
| Chemicals and drugs | Extracellular matrix proteins | 15 | 16 | 217 | 1.59E-04 | 4.32E-06 |
| Chemicals and drugs | Growth substances | 14 | 16 | 365 | 4.77E-02 | 1.95E-03 |
| Chemicals and drugs | Heparitin sulfate | 4 | 4 | 54 | 3.77E-02 | 2.12E-02 |
| Chemicals and drugs | Laminin | 13 | 8 | 184 | 3.60E-04 | 2.82E-02 |
| Chemicals and drugs | Lymphokines | 16 | 14 | 349 | 7.60E-03 | 8.22E-03 |
| Chemicals and drugs | Metalloendopeptidases | 11 | 12 | 241 | 2.63E-02 | 2.62E-03 |
| Chemicals and drugs | Osteonectin | 3 | 5 | 35 | 4.85E-02 | 5.51E-04 |
| Chemicals and drugs | Proteoglycans | 11 | 15 | 255 | 3.75E-02 | 1.25E-04 |
| Chemicals and drugs | Transcription factor, Sp1 | 11 | 10 | 250 | 3.32E-02 | 2.49E-02 |
| Diseases | Astrocytoma | 7 | 6 | 129 | 3.21E-02 | 4.13E-02 |
| Diseases | Melanoma | 18 | 13 | 362 | 1.94E-03 | 2.50E-02 |
| Diseases | Neovascularization, pathologic | 13 | 9 | 223 | 2.16E-03 | 3.11E-02 |
| Diseases | Precancerous conditions | 11 | 8 | 137 | 3.50E-04 | 5.38E-03 |
| Diseases | Pulmonary fibrosis | 5 | 5 | 46 | 4.27E-03 | 1.96E-03 |
| Diseases | Scleroderma, systemic | 4 | 6 | 58 | 4.71E-02 | 9.02E-04 |
Taken together, the significantly enriched gene classes for A549 and U118 genes that were upregulated in tumors compared to cell culture are highly indicative of processes involving cell adhesion and the extracellular matrix (ECM). Significant MeSH term classes for the two gene sets included 'Cell adhesion' (26 genes for A549, 21 genes for U118), 'Extracellular matrix proteins' (15,16), 'Cytokines' (28,26), 'Collagen' (28,33), 'Fibroblasts' (40,35), 'Metalloendopeptidases' (11,12), 'Growth Substances' (14,16), 'Proteoglycans' (11,15), and 'Transcription factor Sp1' (11,10). Sp1 is important for the basal expression of various collagens, and blocking Sp1 broadly inhibits expression of ECM genes [8]. Terms such as 'Pathologic neovascularization' (13,9) and 'Vascular endothelium' (29,26) can refer to processes of angiogenesis, the generation of new blood vessels from preexisting vessels for the delivery of nutrients to tumors. Other disease-related terms include 'Precancerous conditions' (11,8), 'Pulmonary fibrosis' (5,5; a condition involving chronic inflammation and progressive fibrosis of the pulmonary alveolar walls), and 'Systemic scleroderma' (4,6; characterized by hardening of affected tissues). Also of interest is the significant term 'Stem cells' (23,20), as similar signaling pathways are thought to regulate self-renewal in stem cells and cancer cells, and as tumors may include stem cells [9]. The entire set of enriched classes found for genes expressed more strongly in the xenografts over the cell cultures, including which genes belong to which classes, is available as additional data files and from [7].
Upregulation of genes specific to cell-line lineage in xenografts
While several gene classes were found in common between the 112 genes upregulated in U118 tumors and the 134 genes upregulated in A549 tumors over cultures (p < 0.01, fold change > 2), only 10 upregulated genes were shared between the two gene sets. At a significance level of 0.05, 26 genes were shared between the 301 genes upregulated in U118 tumors and the 229 genes upregulated in A549 tumors over cultures, whereas 12 would be expected if the two gene sets were independent of each other. By comparison, 46 genes (over four times the 10 expected by chance) were common to the 223 genes upregulated in A549 cultures and the 256 genes upregulated in U118 cultures over tumors (p < 0.01, fold change > 2). Whereas processes of cell division and metabolism may be more in common from one cancer to the next, processes of cell adhesion and ECM interaction are likely to be very different between different cell types. These observations gave rise to the hypothesis that, when placed in comparable tissue environments, cancer cells from different lineages may express different cell adhesion and ECM-related genes.
To test our hypothesis that A549 cells and U118 cells each express a restricted set of ECM-related genes in tumors, we built a classifier for distinguishing between A549 and U118 cell-culture profiles. We used as the training dataset the A549 and U118 tumor profiles with the expression values for the 30 genes that had both an association in the literature with the MeSH term 'Extracellular matrix proteins' and were significantly upregulated (p < 0.01, fold change > 2) either in A549 xenograft tumors over cultures or in U118 tumors over cultures. We then tested the classifier on the six profiles from A549 and U118 cell cultures. The classifier distinguished perfectly between A549 and U118 profiles, which indicates that the expression pattern of ECM-related genes upregulated in the A549 tumors is more similar to the expression pattern of the same genes in the A549 cell cultures than it is to the expression of these genes in the U118 cell cultures, and vice versa. We built three other similar classifiers: one used the expression values of the 47 genes that are significantly higher in either A549 or U118 tumors and had an association with the MeSH term 'Cell adhesion'; the second used the values for 95 genes associated with 'Cell differentiation'; and the third used the expression values of all 236 genes higher in A549 or U118 tumors with p less than 0.01 and fold change greater than two. All three classifiers correctly distinguished between A549 and U118 cell cultures. Figure 2 shows a cluster diagram of the expression signatures of the 47 cell adhesion-related genes across all profiles, showing most of the genes as appearing more highly expressed in either the A549 tumors or the U118 tumors, but not in both.
Figure 2.
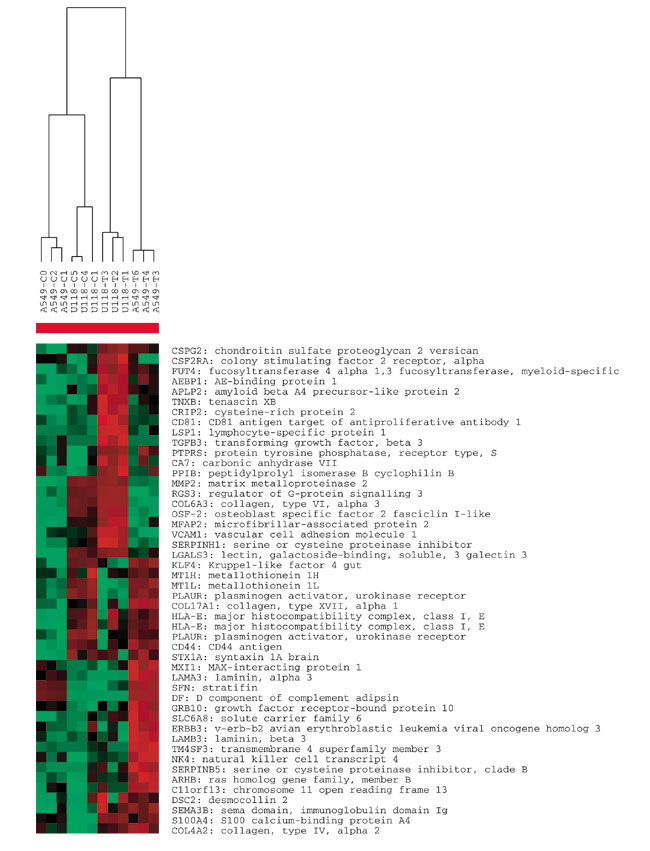
Hierarchical clustering of the set of genes that have an association in the literature with the MeSH term 'Cell Adhesion' (that is, appeared in the abstract of at least one article indexed under 'Cell Adhesion'), and were significantly higher (p < 0.01, fold change > 2) either in A549 xenograft tumors over A549 cell cultures or in U118 tumors over cultures. Intensity values were transformed to standard deviations from the average across all twelve profiles. C, culture; T, tumor.
Discussion
Cells grown in culture have unlimited access to nutrients under conditions most favorable for growth and proliferation and little exposure to extrinsic factors such as cytokines that modulate growth and differentiation. In contrast, cells in a tumor growing in a host tissue environment face conditions with more limited nutrients and oxygen and are subjected to or benefit from a wide variety of host factors. The ability of cancer cells to proliferate within a tissue depends on their response to adhesive and growth factor cues within the ECM [10], and self-sufficiency in growth signals is one of the hallmarks of cancer [11]. To stimulate their own growth and proliferation in tissue, tumor cells can overproduce and release their own growth factors or obtain them from the matrix as they are released by matrix metalloproteinases [12]. The endothelial vasculature grows into the tumor and provides nutrients and oxygen [13]. This model is illustrated by the experimental results presented here, as both A549 (lung) and U118 (brain) cell lines are observed to upregulate one set of genetic programs related to cell growth and proliferation when in culture and another set related to cell adhesion, the extracellular matrix, growth substances, and neovascularization when developing as an in vivo tumor.
In terms of new biological insight into cancer development, our findings suggest that cancer cells of different origins interact in different ways with the same extracellular environment to survive and proliferate as tumors. These lineage-specific genetic programs for cell adhesion and ECM interaction, although less active in cell culture, are not lost, but may be reactivated when cells are transplanted back into an in vivo environment, even if the new environment is different from the tissue of origin of the cancer. This conclusion is based on the significant representation of genes associated with cell adhesion and the ECM in both the A549 and the U118 xenograft tumors. However, the genes in each case represent two very distinct sets, the set in the U118 tumors being more similar in their expression pattern to that of the U118 cell cultures than to the A549 cultures, and vice versa.
Although tumors are known to express high levels of genes involved in cell adhesion and the ECM, as we observed in the xenografts, assessment of the specific contribution of cancer cells to the increased expression may be difficult. In the case of human tumor xenografts in a mouse host, however, it can be determined conclusively that expression of cell adhesion and ECM genes is upregulated in the cancerous cells in the tumor tissue. This conclusion is based on the following two observations. First, profiling mouse tissue alone using probe sets designed for human genes gives poor hybridization, to the extent that the contribution from mouse genes would not have been enough to account for the differences in gene expression observed. Second, different cell adhesion and ECM-related genes are upregulated in tumors of different cell types (A549 versus U118); if the upregulation were due to a common mouse source, then the same genes should have appeared upregulated in both cell types, given that the cells were grown in the same site.
The findings presented here, suggesting that different ECM signaling pathways are active in different cancers, could have important clinical implications, as knowledge of the specific pathways dysregulated in a particular cancer may be valuable for devising effective therapy that targets those pathways. As candidates for further investigation, we have identified genes that appear upregulated in certain cancers in vivo compared to in vitro and that belong to distinct functional classes related to tumor progression. Also of interest are genes that are upregulated in both the cancers, including IGFBP3 (insulin-like growth factor binding protein 3), which, interestingly, is thought to have proapoptotic activities [14], and GSN (gelsolin), which has a role in cellular motility and acts as both a regulator and effector of apoptosis [15]. Further xenograft studies of the type presented here could examine the responses of the host tissue to the tumor (using a mouse microarray chip), as well as temporal changes in gene expression within the developing tumor.
Materials and methods
Cell lines and tumors
Both the A549 lung adenocarcinoma cell line and the U118 brain glioblastoma cell line were cultured at 37°C in a 6% CO2-humidified incubator in DMEM supplemented with 10% fetal calf serum, 100 U/ml penicillin and 100 U/ml streptomycin. The cells were passaged weekly upon reaching confluence. We produced tumors in immunodeficient SCID C.B-17 mice by inoculating 5 × 10⁶ cells (either A549 or U118) subcutaneously per mouse in the intrascapular region. Tumors greater than 5 mm in diameter (range = 5-7 mm) were observed within 21 days in all the mice inoculated. The tumors were harvested under sterile conditions and trimmed of adipose and connective tissue. Total RNA was prepared from tumor tissue.
Gene-expression profiling
Three A549 xenograft tumors obtained from different mice, three U118 tumors from different mice, three A549 cell-culture samples, and three U118 culture samples were each profiled using HuGeneFL microarray chips (Affymetrix, Santa Clara, CA), which consist of 7,069 probe sets, each representing an mRNA transcript. To assess the amount of hybridization with the HuGeneFL chip (designed for human mRNAs) that could be attributable to mouse mRNA in a xenograft tumor sample, a sample of mouse lung tissue was also profiled. Preparation of mRNA, hybridization of the arrays, and computation of probe-set intensities were as previously described [5,16,17]. The exogenous probe set controls on the HuGeneFL chip (probe sets that give constant hybridization from sample to sample) were used to determine scaling factors for comparing the mouse lung profile with the xenograft and culture profiles. For each probe set, we computed the fold changes for human cell-line cultures (U118 and A549) with 20% mouse lung compared to the pure cell line, using the expression (0.8 × [human] + 0.2 × [mouse])/[human]. This assessed the potential impact of mouse tissue on differences observed between xenograft tumor and cell-culture profiles.
As criteria for determining significant differences in mean gene mRNA expression levels between groups of samples, we used both a p-value less than 0.01 using the two-sample t-test and a fold change greater than two either way. Probe-set intensities less than 50 were set to 50. Permutation testing was used to assess the number of genes that could be considered significant for any arbitrary separation of the profiles into two groups. Hierarchical clustering, using the Eisen software [18,19], was applied using the average linkage method as an aid to visualizing gene-expression patterns of interest. Global views of the variation in gene expression among cell specimens were obtained using PCA [17].
Significantly enriched classes within gene sets
For a given set of genes showing significant differences in expression between comparison groups, a search was made within the set for 'significantly enriched' functional classes of genes, as described previously [20]. For the entire set of genes profiled on the HuGeneFL chip, each gene was grouped into one or more classes as defined by one of the following criteria: a common Gene Ontology (GO) annotation term, where on the order of 1,000 terms were considered [21]; and a common MeSH literature term [22] association as defined below. GO term gene assignments related to categories of 'biological process' or 'molecular function' were obtained from LocusLink [23,24] and the GO term hierarchy was obtained from the Gene Ontology Consortium [25]. For each GO term assigned to a given gene in LocusLink, we also assigned all hierarchical parent terms of the term to the gene.
For each gene profiled in the study, the summaries of the 50 most recent articles that mention the gene by any one of its common aliases in the article abstract were downloaded from the web, using the Entrez utilities (described at [26]). An association was then made between the gene and any MeSH index terms included within those summaries. To reduce search time and spurious or uninteresting results, before searching for common MeSH term associations we first reviewed the MeSH terms downloaded for the entire set of genes profiled. We removed from further consideration any MeSH term that appeared to have no relevance to our study (for example, MeSH terms describing experimental protocols or the healthcare system). MeSH terms that were associated with fewer than 20 genes were also discarded, leaving some 4,000 MeSH terms that were considered in the analysis. Similarly, GO gene classes that applied to less than four of the genes under study were not considered.
For a given set of k significant genes, two separate searches were made for enriched GO term classes and MeSH term classes. For a given gene class common to n genes within the k set, where the class applied to a total of A genes out of the entire set of G unique genes under study, the probability, p, for the term occurring n or more times within a set of k genes randomly selected from the chip was calculated using the one-sided Fisher's exact test. As multiple gene classes were tested for our set of genes of interest, the true significance of a low p-value for an enriched class was estimated using 100 separate Monte Carlo simulation tests. For each test k genes were first randomly selected from the set of G genes, and p-values for the classes occurring within the k set of genes were then calculated. For a p-value for a given class found in the original k set of genes, we calculated the number of classes that could be expected to have a p-value as low or lower in a set of k randomly selected genes, based on the simulation results. For each class found to be represented in two given sets, one with k genes and the other with l genes, with p-values less than 0.05 in both cases, we calculated on the basis of simulation results the number of classes expected to be found in both a random k-gene set and a random l-gene set with p-values less than 0.05 in both. In this case, we carried out 100 simulation tests, in each of which one set of k genes and another set of l genes were each randomly selected from the entire set of G genes under study. For each gene class that was found to be represented in both random gene sets, p-values for enrichment were calculated for each of the two sets.
Classification of cell-line lineage based on gene expression
In order to determine whether the lineage, A549 or U118, of a given cell population could be predicted on the basis of its gene-expression profile, we built a classifier using a training set of profiles with a set of genes of interest to be used as markers. To classify a test sample as either A549 or U118, we computed the correlation coefficient between the expression values of the markers in the test sample profile and the same genes on each of the profiles in the training set (using log-transformed values). The class identity of the majority of the top five training profiles having the greatest correlation with the test profile was then assigned to that profile. This strategy is known in the classification literature as "five-nearest neighbors with majority voting" [16].
Additional data files
The following files are available: expression datasets of the cell culture and xenograft profiles as a tab-delimited text file (Additional data file 1); a spreadsheet file including extra data, such as the scale-normalized means prior to quantile normalization, p-values from the 'present' test, a sheet of data from 60 control probe-sets on the Affymetrix chips, and data from the mouse lung tissue control profile (Additional data file 2); the search results for significantly enriched classes for GO annotation (Additional data file 3) and for MeSH term literature associations (Additional data file 4) for genes found to significantly differ at p < 0.01, fold change > 2 between tumors and cell cultures for a given cell line; the values used in the classifications of cell culture lineage using xenograft tumor profiles, together with the classification results, which correctly predicted the lineage of all six cell culture profiles, as an Excel spreadsheet (Additional data file 5). The software for finding significantly enriched classes within gene sets is available from the authors' website [7].
Supplementary Material
Expression datasets of the cell culture and xenograft profiles
The scale-normalized means prior to quantile normalization, p-values from the 'present' test, a sheet of data from 60 control probe-sets on the Affymetrix chips, and data from the mouse lung tissue control profile
The search results for significantly enriched classes for GO annotation for genes found to significantly differ between tumors and cell cultures for a given cell line
The search results for significantly enriched classes for MeSH term literature associations for genes found to significantly differ between tumors and cell cultures for a given cell line
The values used in the classifications of cell culture lineage using xenograft tumor profiles, together with the classification results, which correctly predicted the lineage of all six cell culture profiles
Acknowledgments
Acknowledgements
Supported in part by grant MEDC-238 from the Michigan Life Sciences Corridor.
References
- Paget S. The distribution of secondary growths in cancer of the breast. Cancer Metastasis Rev. 1989;8:98–101. [PubMed] [Google Scholar]
- Bhattacharjee A, Richards WG, Staunton J, Li C, Monti S, Vasa P, Ladd C, Beheshti J, Bueno R, Gillette M, et al. Classification of human lung carcinomas by mRNA expression profiling reveals distinct adenocarcinoma subclasses. Proc Natl Acad Sci USA. 2001;98:13790–13795. doi: 10.1073/pnas.191502998. [DOI] [PMC free article] [PubMed] [Google Scholar]
- Rubin MA. Use of laser capture microdissection, cDNA microarrays, and tissue microarrays in advancing our understanding of prostate cancer. J Pathol. 2001;195:80–86. doi: 10.1002/path.892. [DOI] [PubMed] [Google Scholar]
- Clark EA, Golub TR, Lander ES, Hynes RO. Genomic analysis of metastasis reveals an essential role for RhoC. Nature. 2000;406:532–535. doi: 10.1038/35020106. [DOI] [PubMed] [Google Scholar]
- Beer DG, Kardia SL, Huang CC, Giordano TJ, Levin AM, Misek DE, Lin L, Chen G, Gharib TG, Thomas DG, et al. Gene-expression profiles predict survival of patients with lung adenocarcinoma. Nat Med. 2002;8:816–824. doi: 10.1038/nm733. [DOI] [PubMed] [Google Scholar]
- Rickman DS, Bobek MP, Misek DE, Kuick R, Blaivas M, Kurnit DM, Taylor J, Hanash SM. Distinctive molecular profiles of high-grade and low-grade gliomas based on oligonucleotide microarray analysis. Cancer Res. 2001;61:6885–6891. [PubMed] [Google Scholar]
- Web supplement to "Profiling of pathway-specific changes in gene expression following growth of human cancer cell lines transplanted into mice". http://dot.ped.med.umich.edu:2000/pub/xeno/xeno.htm [DOI] [PMC free article] [PubMed]
- Verrecchia F, Rossert J, Mauviel A. Blocking sp1 transcription factor broadly inhibits extracellular matrix gene expression in vitro and in vivo: implications for the treatment of tissue fibrosis. J Invest Dermatol. 2001;116:755–763. doi: 10.1046/j.1523-1747.2001.01326.x. [DOI] [PubMed] [Google Scholar]
- Reya T, Morrison SJ, Clarke MF, Weissman IL. Stem cells, cancer, and cancer stem cells. Nature. 2001;414:105–111. doi: 10.1038/35102167. [DOI] [PubMed] [Google Scholar]
- Wang F, Weaver VM, Petersen OW, Larabell CA, Dedhar S, Briand P, Lupu R, Bissell MJ. Reciprocal interactions between beta1-integrin and epidermal growth factor receptor in three-dimensional basement membrane breast cultures: a different perspective in epithelial biology. Proc Natl Acad Sci USA. 1998;95:14821–14826. doi: 10.1073/pnas.95.25.14821. [DOI] [PMC free article] [PubMed] [Google Scholar]
- Hanahan D, Weinberg RA. The hallmarks of cancer. Cell. 2000;100:57–70. doi: 10.1016/s0092-8674(00)81683-9. [DOI] [PubMed] [Google Scholar]
- Egeblad M, Werb Z. New functions for the matrix metalloproteinases in cancer progression. Nat Rev Cancer. 2002;2:161–174. doi: 10.1038/nrc745. [DOI] [PubMed] [Google Scholar]
- Bissell MJ, Radisky D. Putting tumours in context. Nat Rev Cancer. 2001;1:46–54. doi: 10.1038/35094059. [DOI] [PMC free article] [PubMed] [Google Scholar]
- Furstenberger G, Senn HJ. Insulin-like growth factors and cancer. Lancet Oncol. 2002;3:298–302. doi: 10.1016/s1470-2045(02)00731-3. [DOI] [PubMed] [Google Scholar]
- Kwiatkowski DJ. Functions of gelsolin: motility, signaling, apoptosis, cancer. Curr Opin Cell Biol. 1999;11:103–108. doi: 10.1016/s0955-0674(99)80012-x. [DOI] [PubMed] [Google Scholar]
- Giordano TJ, Shedden KA, Schwartz DR, Kuick R, Taylor JM, Lee N, Misek DE, Greenson JK, Kardia SL, Beer DG, et al. Organ-specific molecular classification of primary lung, colon, and ovarian adenocarcinomas using gene expression profiles. Am J Pathol. 2001;159:1231–1238. doi: 10.1016/S0002-9440(10)62509-6. [DOI] [PMC free article] [PubMed] [Google Scholar]
- Schwartz DR, Kardia SL, Shedden KA, Kuick R, Michailidis G, Taylor JM, Misek DE, Wu R, Zhai Y, Darrah DM, et al. Gene expression in ovarian cancer reflects both morphology and biological behavior, distinguishing clear cell from other poor-prognosis ovarian carcinomas. Cancer Res. 2002;62:4722–4729. [PubMed] [Google Scholar]
- Eisen MB, Spellman PT, Brown PO, Botstein D. Cluster analysis and display of genome-wide expression patterns. Proc Natl Acad Sci USA. 1998;95:14863–14868. doi: 10.1073/pnas.95.25.14863. [DOI] [PMC free article] [PubMed] [Google Scholar]
- The Eisen lab http://rana.lbl.gov
- Creighton C, Beer D, Hanash S. Gene expression patterns define pathways correlated with loss of differentiation in lung adenocarcinomas. FEBS Lett. 2003;540:167–170. doi: 10.1016/s0014-5793(03)00259-x. [DOI] [PubMed] [Google Scholar]
- Ashburner M, Ball CA, Blake JA, Botstein D, Butler H, Cherry JM, Davis AP, Dolinski K, Dwight SS, Eppig JT, et al. Gene ontology: tool for the unification of biology. The Gene Ontology Consortium. Nat Genet. 2000;25:25–29. doi: 10.1038/75556. [DOI] [PMC free article] [PubMed] [Google Scholar]
- Masys DR, Welsh JB, Lynn Fink J, Gribskov M, Klacansky I, Corbeil J. Use of keyword hierarchies to interpret gene expression patterns. Bioinformatics. 2001;17:319–326. doi: 10.1093/bioinformatics/17.4.319. [DOI] [PubMed] [Google Scholar]
- Pruitt KD, Maglott DR. RefSeq and LocusLink: NCBI gene-centered resources. Nucleic Acids Res. 2001;29:137–140. doi: 10.1093/nar/29.1.137. [DOI] [PMC free article] [PubMed] [Google Scholar]
- LocusLink ftp download ftp://ftp.ncbi.nih.gov/refseq/LocusLink
- Gene Ontology Consortium http://www.geneontology.org
- Entrez Programming Utilities http://www.ncbi.nlm.nih.gov/entrez/query/static/eutils_help.html
Associated Data
This section collects any data citations, data availability statements, or supplementary materials included in this article.
Supplementary Materials
Expression datasets of the cell culture and xenograft profiles
The scale-normalized means prior to quantile normalization, p-values from the 'present' test, a sheet of data from 60 control probe-sets on the Affymetrix chips, and data from the mouse lung tissue control profile
The search results for significantly enriched classes for GO annotation for genes found to significantly differ between tumors and cell cultures for a given cell line
The search results for significantly enriched classes for MeSH term literature associations for genes found to significantly differ between tumors and cell cultures for a given cell line
The values used in the classifications of cell culture lineage using xenograft tumor profiles, together with the classification results, which correctly predicted the lineage of all six cell culture profiles