

Abstract
Objective
Optical coherence tomography (OCT) has been shown to be a valuable tool in glaucoma assessment. We investigated a new ultrahigh-resolution OCT (UHR-OCT) imaging system in glaucoma patients and compared the findings with those obtained by conventional-resolution OCT.
Design
Retrospective comparative case series.
Participants
A normal subject and 4 glaucoma patients representing various stages of glaucomatous damage.
Testing
All participants were scanned with StratusOCT (axial resolution of ~10 μm) and UHR-OCT (axial resolution of ~3 μm) at the same visit.
Main Outcome Measure
Comparison of OCT findings detected with StratusOCT and UHR-OCT.
Results
Ultrahigh-resolution OCT provides a detailed cross-sectional view of the scanned retinal area that allows differentiation between retinal layers. These UHR images were markedly better than those obtained by the conventional-resolution OCT.
Conclusions
Ultrahigh-resolution OCT provides high-resolution images of the ocular posterior segment, which improves the ability to detect retinal abnormalities due to glaucoma.
Histologic studies have shown that glaucomatous damage is confined to the retinal ganglion cell layer (GCL) and nerve fiber layer (NFL).1,2 In vivo detection of these changes is the goal of clinical examination of the posterior ocular segment and glaucoma imaging modalities. Currently available modalities allow the detection of glaucomatous changes either in the optic nerve head (ONH) or by measuring the thickness of the retina in the macula or the NFL in the peripapillary region. These capabilities are limited by technological constraints (i.e., the axial resolution of the images), preventing the detection of distinctive intraretinal layers. More accurate imaging and quantification of the GCL and NFL might improve glaucoma detection by focusing on the tissue layers that are most prone to glaucoma damage.
Optical coherence tomography (OCT) is the optical equivalent of ultrasonography, which provides in vivo tissue sampling with axial resolution of the current commercially available unit in the range of ~10 μm.3 In a collaborative work between Massachusetts Institute of Technology and New England Eye Center, Tufts University School of Medicine, we have developed a new ophthalmologic ultrahigh-resolution OCT system (UHR-OCT) with an in vivo axial resolution of ~3 μm.4,5 This enhanced resolution enables the visualization and detection of numerous retinal layers, including the GCL.
The purpose of this pilot study is to compare scans obtained by the commercially available conventional-resolution OCT device with UHR-OCT in glaucoma patients to assess the additional information gained by the higher resolution of UHR-OCT.
Materials and Methods
Eyes of glaucoma patients were scanned at the same visit by the commercially available StratusOCT (Carl Zeiss Meditec Inc., Dublin, CA) and the UHR-OCT device at the New England Eye Center, Tufts–New England Medical Center, Tufts University School of Medicine, Boston, Massachusetts. All imaging was conducted after the installation of 1% tropicamide and 2.5% phenylephrine for pupil dilation. Representative samples of a normal subject and various stages of glaucomatous damage were chosen retrospectively for this comparative imaging study.
The study was approved by the institutional review boards and ethics committees of Massachusetts Institute of Technology and New England Medical Center, and all participants gave their written consent to participate in the study. The study followed the Health Insurance Portability and Accountability Act of 1996 regulations and principles of the Declaration of Helsinki.
Instrumentation
Optical Coherence Tomography
Optical coherence tomography uses low-coherence interferometry to image intraocular structures cross-sectionally.3,6 Optical coherence tomography is analogous to ultrasound B-mode imaging, except that it uses light rather than sound. Cross-sectional images of tissue microstructure are obtained by measuring the echo time delay and magnitude of light backscattered from internal tissue microstructure. Optical coherence tomography has been shown to obtain accurate and reproducible NFL and retinal thickness measurements.7–9 Detailed descriptions of OCT have been previously published.3,6,10
Optical coherence tomography enables cross-sectional imaging of the macula and peripapillary and ONH regions. The peripapillary scan is a circular scan with a diameter of 3.4 mm centered on the ONH. The macula and ONH scans are composed of 6 linear scans in a spoke pattern separated by 30° intervals. Both conventional and UHR-OCT devices used in this study employed standard registration algorithms to correct for axial motions of the subject.
Ultrahigh-Resolution Optical Coherence Tomography
The UHR-OCT system in this study utilizes a femtosecond titanium: sapphire laser that generates a ~125-nm bandwidth centered at 815 nm as the imaging light source.5 This broadband light source yields an axial image resolution of ~3 μm in the eye, a factor of 3 to 4 times finer than conventional OCT systems. The UHR-OCT prototype imaging system is based on a slit-lamp biomicroscope with an integrated charged-coupled device camera to provide a video image of the fundus. The scanning pattern and registration of the OCT beam on the fundus can be visualized by the operator in real time. The UHR-OCT images are generated by scanning 1.5 mm in the axial depth direction and 6 mm in the transverse direction. The UHR-OCT image had ~3-μm axial and 15- to 20-μm transverse resolution in tissue and consisted of 3000 axial and 600 transverse pixels (A scans). The pixel spacing was 0.5 μm per pixel in the axial direction and 10 μm per pixel in the transverse direction. The current scanning rate of the UHR-OCT system is 140 A-scans per second, or approximately 4 seconds per image. Ultrahigh-resolution OCT imaging was performed with 750 μW of incident power, which is the same incident power as the commercial StratusOCT system and is within the safe retinal exposure limits established by the American National Standards Institute.11
Standard-Resolution Optical Coherence Tomography
The StratusOCT image was generated by scanning 2 mm in the axial depth direction and 6 mm in the transverse direction. The StratusOCT utilized a superluminescent diode laser with a ~25-nm bandwidth centered at 820 nm as the imaging light source. The OCT images had ~10-μm axial and 20-μm transverse resolution in tissue and consisted of 1024 axial pixels and 512 transverse pixels (A scans). The pixel spacing was 2 μm per pixel in the axial direction and 12 μm per pixel in the transverse direction. The scanning rate of the StratusOCT system is 400 A-scans per second, or approximately 1.3 seconds per 512-A-scan image. The standard StratusOCT imaging protocol was followed on both standard OCT and UHR-OCT to make a direct comparison of the resulting images.
Results
A normal subject and 4 glaucoma patients, representing the spectrum of various glaucomatous stages of damage, were selected for this study.
Case 1: Normal Subject
A 40-year-old white healthy man with normal right eye examination results and normal perimetry was scanned by UHR-OCT and StratusOCT (Fig 1). These scans were used as a reference for observing glaucoma patients. Macular scanning with both StratusOCT and UHR-OCT was conducted in a temporal superior to nasal inferior orientation (Fig 1AI, BI). Distinctive retinal layers could be detected by UHR-OCT: nuclear retinal layers (GCL and outer and inner nuclear layers) have low optical backscattering, whereas the NFL and the plexiform retinal layers have high backscattering.12 The posterior red band in the OCT image is composed of 3 lines: the central one corresponding to the retinal pigment epithelium (RPE); the upper, to the junction between the inner and outer segments of the photoreceptors; and the lower, to the choriocapillaris. The oblique orientation of the scan causes the asymmetry in NFL thickness because this layer is thinner in the temporal aspect of the macula (left side of the scan) and thicker at the maculopapillary bundle (right side).
Figure 1.
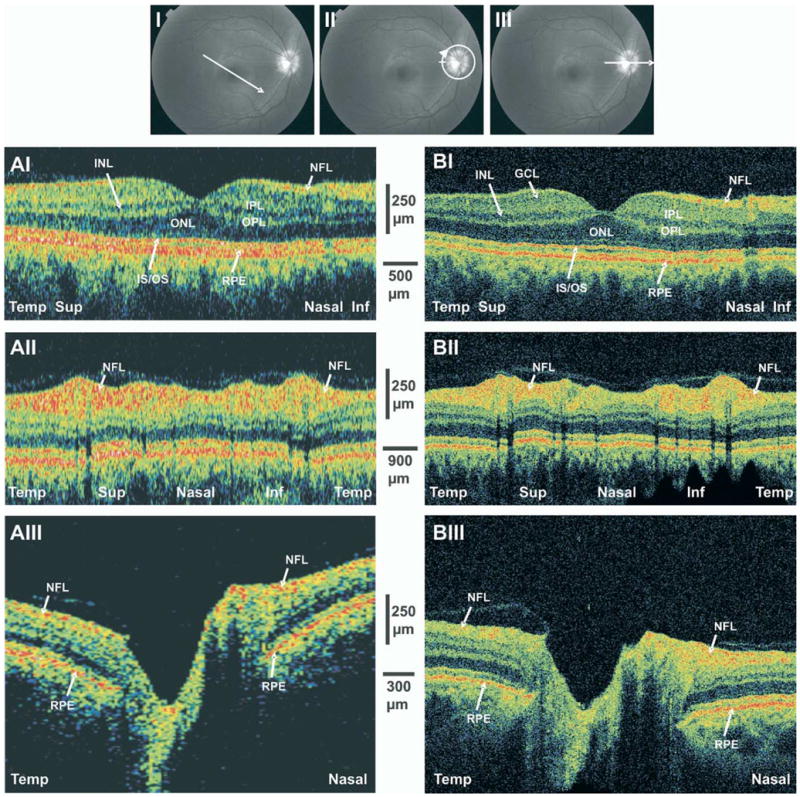
StratusOCT (A) and ultrahigh-resolution optical coherence tomography (B) scans of a normal subject. I, Macular linear scans, whose orientations are depicted in the upper image. II, Peripapillary circular scans. III, Optic nerve head (ONH) linear scans. Inf = inferior; INL = internal nuclear layer; IS/OS = inner segment/outer segment; NFL = nerve fiber layer; ONL = outer nuclear layer; OPL = outer plexiform layer; RPE = retinal pigment epithelium; Sup = superior; Temp = temporal.
Circumpapillary OCT images were aligned by temporal, superior, nasal, inferior, and temporal quadrants from the left to the right side of the image (Fig 1 AII, BII). The most prominent feature in the normal peripapillary retina is the wide anterior red band representing the NFL. This band is typically thicker in the superior and inferior regions and thinner in the temporal and nasal regions, giving the characteristic double-hump NFL configuration. Detailed observation reveals that the superior and inferior humps include a localized central thinning in the vertical poles of the optic disc. Black vertical streaks are due to a shadowing effect of blood vessels (Fig 1).
Optic nerve head scans were performed in the horizontal temporal to nasal orientation (Fig AIII, BIII). The ONH is clearly detectable as the opening in the RPE layer. The disc has a shallow cup with mild slopes. The NFL is thickened in the nasal aspect of the ONH when compared with the temporal aspect. The attachment of the posterior hyaloid membrane to the temporal margin of the ONH is evident on both standard and UHR-OCT images.
Case 2: Early Glaucoma
A 53-year-old white woman with normal-tension glaucoma in her left eye was treated medically with latanoprost and brinzolamide and 2 sessions of selective laser trabeculoplasty. On examination, the visual acuity (VA) was 20/20, and the intraocular pressure (IOP) was 13 mmHg. Pachymetry of the cornea was 541 μm, and the anterior chamber was normal, with an open angle. Mild opacification of the lens and moderate cupping of the ONH with a temporal superior rim notch were noted (Fig 2A). Visual field examination revealed an inferior nasal defect (Fig 2A).
Figure 2.
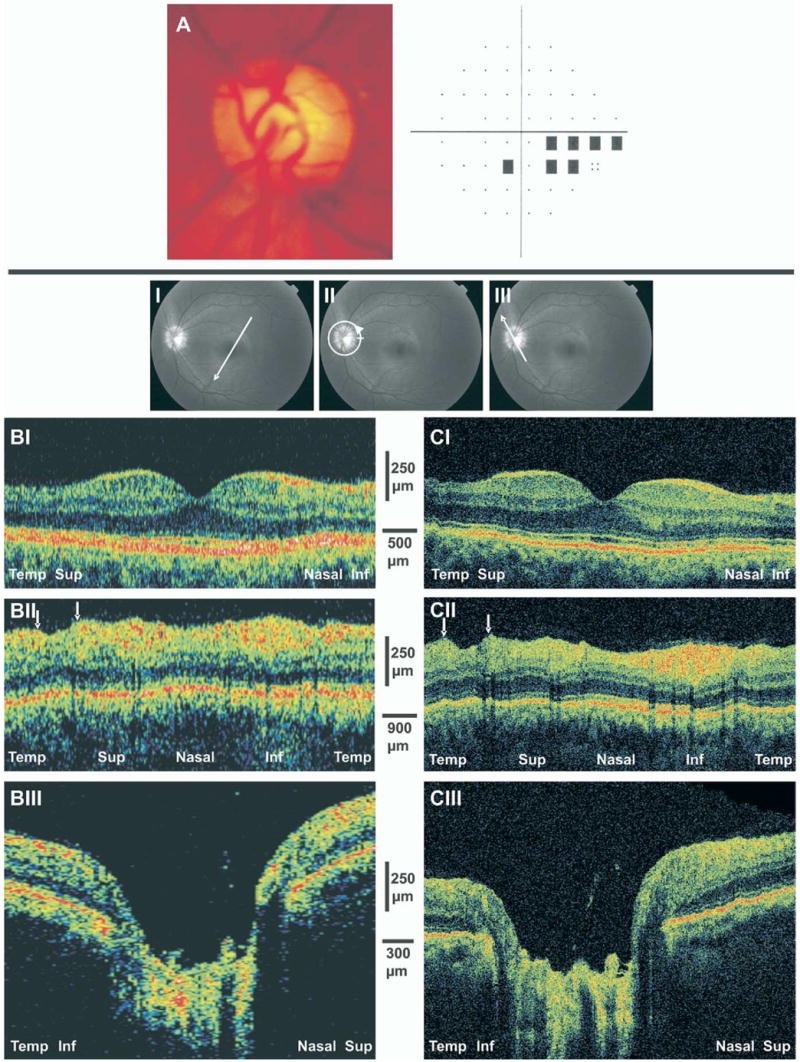
A, Optic disc photograph of early glaucomatous damage demonstrating moderate cupping and superior temporal neuroretinal rim thinning. A visual field defect is presented in the inferior nasal region. B, StratusOCT scans. C, Ultrahigh-resolution optical coherence tomography images. I, Thinning of the nerve fiber layer (NFL) and ganglion cell layer is evident in the temporal superior macular scans. II, Arrows highlight focal NFL defects in the peripapillary scans. III, Shallow cupping is evident in the optic nerve head scans. Inf = inferior; Sup = superior; Temp = temporal.
Optical coherence tomography scans of the macula were conducted in the temporal superior to nasal inferior orientation (Fig 2BI, CI). Marked thinning of the NFL and GCL was noted mainly in the periphery of the temporal aspect of the macula corresponding with the inferior nasal defect in the perimetry. Thinning of NFL and GCL was observed also in the periphery of the nasal aspect of the macula.
Circumpapillary scanning demonstrated NFL thinning in the superior region with a localized punched-out defect corresponding to the ONH rim notch and the inferior nasal VF defect (Fig 2BII, CII).
Optic nerve head scans were obtained in the temporal inferior to nasal superior orientation (Fig 2BIII, CIII). The thickness of the NFL is diminished on both sides of the ONH, with a large and deep cup with steep slopes. Large blood vessels are noted at the bottom of the optic disc cup.
Case 3: Moderate Glaucoma
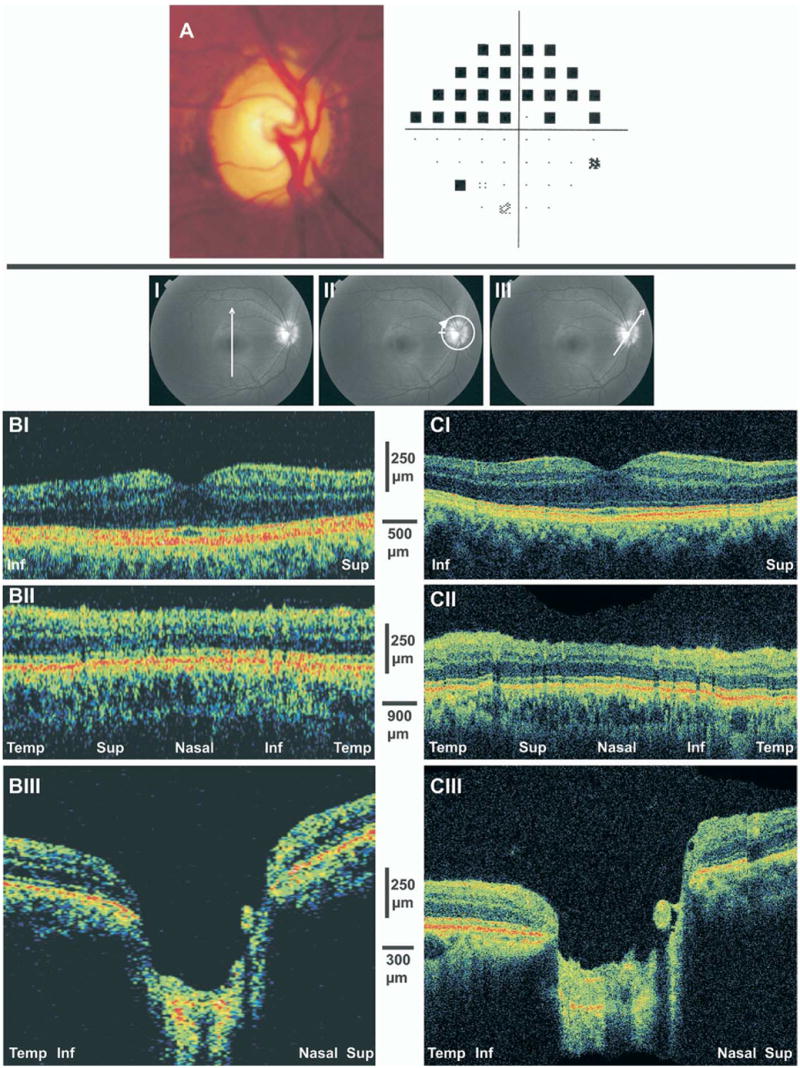
A 41-year-old Asian man with newly diagnosed primary open-angle glaucoma (OAG) in the right eye was treated with latano-prost. On examination, VA was 20/25 and IOP was 22 mmHg. Corneal thickness was 552 μm. The anterior chamber was unremarkable, except for mild deposition of pigment in the angle. The posterior segment reveals asymmetric cupping, with a large cup in the right eye and neuroretinal rim notch in the temporal inferior segment (Fig 3A). Visual field testing showed superior and inferior arcuate defects, more pronounced in the superior hemifield (Fig 3A).
Figure 3.

A, Optic disc photograph of moderate glaucomatous damage demonstrating moderate cupping and inferior temporal neuroretinal rim thinning. Superior and inferior arcuate defects are shown in the visual field test. B, StratusOCT scans. C, Ultrahigh-resolution optical coherence tomography images. Marked thinning of the nerve fiber layer (NFL) and ganglion cell layer is evident in both sides of the fovea, most noticeably in the inferior region (I). II, The NFL is attenuated throughout the peripapillary scans. III, Large and deep optic nerve cupping is evident in the optic nerve head scans. Inf = inferior; Sup = superior; Temp = temporal.
Macular scans were obtained in the temporal inferior to nasal superior orientation (Fig 3BI, CI). Thinning of the NFL and GCL was noted throughout the macular scan, most noticeably in the inferior sector.
A peripapillary scan showed thinning of the NFL in all sectors (Fig 3BII, CII). The signal obtained from the RPE is evenly distributed along the scan; therefore, the diminished signal from the upper layers of the retina reflects true tissue atrophy due to the glaucomatous process.
Scanning of the ONH was obtained in the horizontal temporal to nasal orientation (Fig 3BIII, CIII). Severe attenuation of the NFL is observed on both sides of the ONH. A large, deep, steep disc cup is noted, with the major blood vessel trunk at the bottom of the cup.
Case 4: Severe Glaucoma
A 43-year-old white man with juvenile OAG in his right eye had a trabeculectomy and was treated with brimonidine, dorzolamide, timolol, and travoprost. Visual acuity was 20/25, and IOP was 18 mmHg. On examination of the anterior segment, pachymetry of the cornea was 547 μm, a flat superior bleb was noted, and the angle was open. The posterior segment was found to have marked ONH cupping with marked attenuation of the rim in the temporal inferior quadrant (Fig 4A). Visual field examination showed a dense superior hemifield defect (Fig 4A).
Figure 4.
A, Optic disc photograph of advance glaucomatous damage demonstrating large cupping and inferior temporal neuroretinal rim thinning with superior hemifield visual field loss. B, StratusOCT scans. C, Ultrahigh-resolution optical coherence tomography. Marked thinning of the nerve fiber layer and ganglion cell layer is evident in both sides of the fovea, most noticeably in the inferior region (I) as well as in the peripapillary scans (II). III, Optic nerve head scans showed deep cupping with elimination of the neuroretinal rim. Inf = inferior; Sup = superior; Temp = temporal.
Macular scans were obtained in the vertical inferior to superior orientation (Fig 4BI, CI). At this orientation, similar retinal patterns were expected on both sides of the scan. Marked thinning was observed in both superior and inferior regions, most noticeably in the periphery of the inferior region corresponding with the superior VF defect. The glaucomatous damage in the superior retina, as observed by OCT, was not detected by perimetry at the time of testing.
Nerve fiber layer thickness was diminished throughout the peripapillary region (Fig 4BII, CII). This finding was fully appreciated when compared with the scan of the normal subject (Fig 1AII, BII), taking into account that both subjects are from the same age range.
Scanning of the ONH was obtained in the temporal inferior to nasal superior orientation (Fig 4BIII, CIII). The scans are remarkable for attenuation of the NFL and deep and large optic disc cupping. No neuroretinal rim was noted in the temporal aspect of the disc.
Case 5: Localized Glaucomatous Damage
A 64-year-old white woman with normal-tension glaucoma in the left eye was treated with selective laser trabeculoplasty and medically with brinzolamide and bimatoprost. Visual acuity was 20/20, and IOP was 12 mmHg. Pachimetry of the left cornea was 540 μm, and the angle was open. Posterior segment examination revealed a near total excavation of the ONH and a wedge-shaped NFL defect in the temporal inferior sector (Fig 5A). Visual field analysis showed a reproducible early superior paracentral defect (Fig 5A).
Figure 5.

A, Red-free fundus photograph of a temporal inferior nerve fiber layer (NFL) defect. The visual field shows an early superior paracentral defect. B, StratusOCT scans. C, Ultrahigh-resolution optical coherence tomography (OCT) images. Scanning through the NFL defect shows marked thinning surrounded by a normal-thickness NFL. Arrows depict the extent of NFL thinning in the OCT images.
Linear scans were obtained with StratusOCT and UHR-OCT through the clinically detected NFL defect (Fig 5B, C). The alignment of the scans is presented in Figure 5A. A clearly visible thinning of the NFL was noted, surrounded by near normal thickness of this layer.
Discussion
This study presents the investigation of UHR-OCT imaging in glaucoma patients. Using a new state-of-the-art UHR-OCT device (~3 μm axial image resolution), we were able to discern retinal layers with a high degree of precision, specifically discriminating areas of glaucoma damage and discerning the differences between regions that were damaged and those that were not. Furthermore, we were able to apply our UHR-OCT findings to standard-resolution StratusOCT images and extract additional information from the StratusOCT images that we were unable to appreciate before UHR-OCT imaging. We could evaluate finer details on the StratusOCT with the additional direction provided by the UHR-OCT images.
The improved visualization provided by UHR-OCT allowed the recognition of intraretinal structures as well as minute glaucomatous structural changes that could not be detected by other ocular imaging modalities or previous versions of OCT. Because glaucomatous damage is confined to the NFL and GCL, the enhanced visualization might provide an important tool to detect these changes. The ability to visualize the layers that are specifically prone to glaucomatous damage improves the ability to detect the damage by focusing only on the measurements from those layers that are directly involved in the pathologic glaucomatous process. These outer layers might be damaged due to other pathologies and thus induce total retinal thickness changes that do not reflect the glaucomatous damage. This property of the UHR-OCT might be particularly valuable for the longitudinal evaluation of glaucoma patients. Further investigation and construction of software allowing for automatic segmentation of intraretinal layers may provide quantitative measurements of these layers and further enhance clinical use.
The optical properties of a normal retina enable the recognition of retinal layers in the UHR-OCT scans that are similar to those obtained in histologic sections (Fig 1B). With the aid of UHR-OCT, most of these features can be detected in the standard-resolution StratusOCT scan (Fig 1A). However, the ability to differentiate between layers and identify minute features is clearly enhanced by the UHR-OCT scans.
Figure 2 (B, C) demonstrates an example in which the UHR-OCT showed a localized NFL defect in the circumpapillary scan that was much less obvious in the standard-resolution StratusOCT scan. This example highlights the advantage that UHR-OCT provides in improving the visualization of small abnormalities. With the additional knowledge gained from the UHR-OCT, one can more easily identify the area of abnormality in the corresponding standard-resolution StratusOCT image (Fig 2BII).
Defining the extent of the intraretinal (axial) glaucomatous damage can be challenging when using StratusOCT (Fig 3BII, inferior region; Fig 5B). Ultrahigh-resolution OCT showed a definitive attenuation of the NFL indicative of advanced tissue destruction (Fig 3CII, inferior region; Fig 5C).
Numerous studies have shown that structural changes precede functional damage.13–22 Figure 4 demonstrates a case in which, in addition to the damage that corresponds to the VF damage, further structural damage could be detected with both standard and UHR-OCT, which was not yet apparent in VF testing.
Previous studies have shown the advantages of UHR-OCT in detecting retinal pathologies.23,24 The enhanced resolution offered by UHR-OCT with the specific recognition of the NFL and GCL should improve the capabilities to detect glaucomatous damage. Moreover, these features have the potential of allowing the recognition of glaucomatous damage in the presence of other ocular pathologies that involve other retinal layers.
This pilot study demonstrates the utility of UHR-OCT in depicting the precise areas of damage in glaucoma. Further studies are warranted to determine the reproducibility of the device and the capability to distinguish between normal subjects and glaucoma patients.
In summary, UHR-OCT provides high-resolution images of the ocular posterior segment with enhanced visualization of intraretinal structures. The enhanced capabilities of the UHR-OCT system when compared with standard-resolution OCT promises to improve the detection of glaucomatous retinal abnormalities.
Acknowledgments
Supported in part by the National Institutes of Health, Bethesda, Maryland (contract nos.: RO1-EY11289-16, R01-EY13178, P30-EY13078); National Science Foundation, Arlington, Virginia (grant no.: ECS-0119452); Air Force Office of Scientific Research, Arlington, Virginia (contract no.: F49620-98-1-0139); Medical Free Electron Laser Program, Washington, DC (grant nos.: F49620-01-1-0186, FWF P14218-PSY, FWF Y159-PAT, CRAF-1999-70549); Massachusetts Lions Eye Research Fund Inc., Abington, Massachusetts; Research to Prevent Blindness, New York, New York; and Carl Zeiss Meditec, Dublin, California.
Footnotes
Presented in part at: Association of Research in Vision and Ophthalmology annual meeting, April, 2003; Ft. Lauderdale, Florida.
References
- 1.Quigley HA, Addicks EM, Green WR. Optic nerve damage in human glaucoma. III. Quantitative correlation of nerve fiber loss and visual field defect in glaucoma, ischemic neuropathy, papilledema, and toxic neuropathy. Arch Ophthalmol. 1982;100:135–46. doi: 10.1001/archopht.1982.01030030137016. [DOI] [PubMed] [Google Scholar]
- 2.Harwerth RS, Carter-Dawson L, Shen F, et al. Ganglion cell losses underlying visual field defects from experimental glaucoma. Invest Ophthalmol Vis Sci. 1999;40:2242–50. [PubMed] [Google Scholar]
- 3.Huang D, Swanson EA, Lin CP, et al. Optical coherence tomography. Science. 1991;254:1178–81. doi: 10.1126/science.1957169. [DOI] [PMC free article] [PubMed] [Google Scholar]
- 4.Drexler W, Morgner U, Ghanta RK, et al. Ultrahigh-resolution ophthalmic optical coherence tomography. Nat Med. 2001;7:502–7. doi: 10.1038/86589. [DOI] [PMC free article] [PubMed] [Google Scholar]
- 5.Drexler W, Morgner U, Kartner FX, et al. In vivo ultrahigh-resolution optical coherence tomography. Opt Lett. 1999;24:1221–3. doi: 10.1364/ol.24.001221. [DOI] [PubMed] [Google Scholar]
- 6.Hee MR, Izatt JA, Swanson EA, et al. Optical coherence tomography of the human retina. Arch Ophthalmol. 1995;113:325–32. doi: 10.1001/archopht.1995.01100030081025. [DOI] [PubMed] [Google Scholar]
- 7.Schuman JS, Pedut-Kloizman T, Hertzmark E, et al. Reproducibility of nerve fiber layer thickness measurements using optical coherence tomography. Ophthalmology. 1996;103:1889–98. doi: 10.1016/s0161-6420(96)30410-7. [DOI] [PMC free article] [PubMed] [Google Scholar]
- 8.Blumenthal EZ, Williams JM, Weinreb RN, et al. Reproducibility of nerve fiber layer thickness measurements by use of optical coherence tomography. Ophthalmology. 2000;107:2278–82. doi: 10.1016/s0161-6420(00)00341-9. [DOI] [PubMed] [Google Scholar]
- 9.Massin P, Vicaut E, Haouchine B, et al. Reproducibility of retinal mapping using optical coherence tomography. Arch Ophthalmol. 2001;119:1135–42. doi: 10.1001/archopht.119.8.1135. [DOI] [PubMed] [Google Scholar]
- 10.Pedut-Kloizman T, Pakter HM, Schuman JS, et al. Ophthalmic diagnosis using optical coherence tomography. Ophthalmol Clin North Am. 1998;11:465–86. [Google Scholar]
- 11.American National Standard. ANSI Z136.1-1993. New York: American National Standards Institute; 1993. Safe Use of Lasers. [Google Scholar]
- 12.Toth CA, Narayan DG, Boppart SA, et al. A comparison of retinal morphology viewed by optical coherence tomography and by light microscopy. Arch Ophthalmol. 1997;115:1425–8. doi: 10.1001/archopht.1997.01100160595012. [DOI] [PubMed] [Google Scholar]
- 13.Sommer A, Pollack I, Maumenee AE. Optic disc parameters and onset of glaucomatous field loss. I. Methods and progressive changes in disc morphology. Arch Ophthalmol. 1979;97:1444–8. doi: 10.1001/archopht.1979.01020020106002. [DOI] [PubMed] [Google Scholar]
- 14.Pederson JE, Anderson DR. The mode of progressive disc cupping in ocular hypertension and glaucoma. Arch Ophthalmol. 1980;98:490–5. doi: 10.1001/archopht.1980.01020030486010. [DOI] [PubMed] [Google Scholar]
- 15.Sommer A, Quigley HA, Robin AL. Evaluation of nerve fiber layer assessment. Arch Ophthalmol. 1984;102:1766–71. doi: 10.1001/archopht.1984.01040031430017. [DOI] [PubMed] [Google Scholar]
- 16.Sommer A, Katz J, Quigley HA, et al. Clinically detectable nerve fiber atrophy precedes the onset of glaucomatous field loss. Arch Ophthalmol. 1991;109:77–83. doi: 10.1001/archopht.1991.01080010079037. [DOI] [PubMed] [Google Scholar]
- 17.Quigley HA, Katz J, Derick RJ, et al. An evaluation of optic disc and nerve fiber layer examinations in monitoring progression of early glaucoma damage. Ophthalmology. 1992;99:19–28. doi: 10.1016/s0161-6420(92)32018-4. [DOI] [PubMed] [Google Scholar]
- 18.Zeyen TG, Caprioli J. Progression of disc and field damage in early glaucoma. Arch Ophthalmol. 1993;111:62–5. doi: 10.1001/archopht.1993.01090010066028. [DOI] [PubMed] [Google Scholar]
- 19.Quigley HA, Enger C, Katz J, et al. Risk factors for the development of glaucomatous visual field loss in ocular hypertension. Arch Ophthalmol. 1994;112:644–9. doi: 10.1001/archopht.1994.01090170088028. [DOI] [PubMed] [Google Scholar]
- 20.Sommer A, Miller NR, Pollack I. The nerve fiber layer in the diagnosis of glaucoma. Arch Ophthalmol. 1997;95:2149–56. doi: 10.1001/archopht.1977.04450120055003. [DOI] [PubMed] [Google Scholar]
- 21.Chauhan BC, McCormick TA, Nicolela MT, LeBlanc RP. Optic disc and visual field changes in a prospective longitudinal study of patients with glaucoma: comparison of scanning laser tomography with conventional perimetry and optic disc photography. Arch Ophthalmol. 2001;119:1492–9. doi: 10.1001/archopht.119.10.1492. [DOI] [PubMed] [Google Scholar]
- 22.Kass MA, Heuer DK, Higginbotham EJ, et al. Ocular Hypertension Treatment Study Group. The Ocular Hypertension Treatment Study: a randomized trial determines that topical ocular hypotensive medication delays or prevents the onset of primary open-angle glaucoma. Arch Ophthalmol. 2002;120:701–13. doi: 10.1001/archopht.120.6.701. discussion 829–30. [DOI] [PubMed] [Google Scholar]
- 23.Drexler W, Sattmann H, Hermann B, et al. Enhanced visualization of macular pathology with the use of ultrahigh-resolution optical coherence tomography. Arch Ophthalmol. 2003;121:695–706. doi: 10.1001/archopht.121.5.695. [DOI] [PubMed] [Google Scholar]
- 24.Ko TH, Fujimoto JG, Duker JS, et al. Comparison of ultra-high- and standard-resolution optical coherence tomography for imaging macular hole pathology and repair. Ophthalmology. 2004;111:2033–43. doi: 10.1016/j.ophtha.2004.05.021. [DOI] [PMC free article] [PubMed] [Google Scholar]