Abstract
Gaucher disease is an autosomal recessive lysosomal storage disorder caused by mutations in the glucocerebrosidase gene. Missense mutations result in reduced enzyme activity that may be due to misfolding, raising the possibility of small-molecule chaperone correction of the defect. Screening large compound libraries by quantitative high-throughput screening (qHTS) provides comprehensive information on the potency, efficacy, and structure–activity relationships (SAR) of active compounds directly from the primary screen, facilitating identification of leads for medicinal chemistry optimization. We used qHTS to rapidly identify three structural series of potent, selective, nonsugar glucocerebrosidase inhibitors. The three structural classes had excellent potencies and efficacies and, importantly, high selectivity against closely related hydrolases. Preliminary SAR data were used to select compounds with high activity in both enzyme and cell-based assays. Compounds from two of these structural series increased N370S mutant glucocerebrosidase activity by 40–90% in patient cell lines and enhanced lysosomal colocalization, indicating chaperone activity. These small molecules have potential as leads for chaperone therapy for Gaucher disease, and this paradigm promises to accelerate the development of leads for other rare genetic disorders.
Keywords: probe identification, structure–activity relationship, small-molecule inhibitor, chaperone therapy
Glucocerebrosidase (GC) (EC 3.2.1.45) is the lysosomal enzyme deficient in Gaucher disease (Online Mendelian Inheritance in Man 230800). After initial synthesis and folding in the endoplasmic reticulum (ER), GC is trafficked to the lysosome, where it attains its functional tertiary structure (1). In Gaucher disease, most of the >200 mutations identified are missense alterations that may result in misfolding, decreased stability, and/or mistrafficking of this lysosomal protein (2). Enzyme replacement therapy is currently used to treat the systemic manifestations of Gaucher disease, which include hepatosplenomegaly, anemia, bone lesions, and thrombocytopenia (3, 4), but is costly and does not cross the blood–brain barrier (5). Other treatment strategies for Gaucher disease under investigation include substrate reduction therapy, gene therapy, and chemical chaperone therapy (6–9).
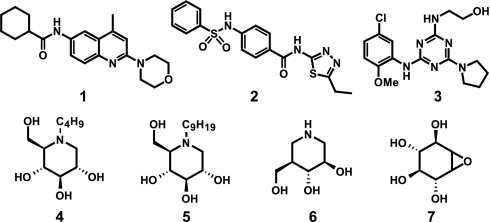
“Chemical chaperones” are small molecules that bind to misfolded proteins and assist their correct refolding and/or maturation. Chemical chaperone activity has been demonstrated using small-molecule antagonists of the V2 vasopressin receptor (10) and the other G protein-coupled receptors (11, 12). This approach has been proposed for a number of lysosomal storage disorders, including Gaucher, Sandhoff, Fabry, and Tay-Sachs diseases (13, 14). The hypothesized mechanism of action for these compounds is competitive binding to the active site of the mutant enzyme, facilitating proper folding and trafficking to the lysosome, where endogenous substrate displaces the chaperone and enzyme activity is restored (8, 13, 15). Most GC chaperones studied to date are enzyme inhibitors in the structural class of iminosugars or similar analogs of the natural substrate, glucosylceramide (16–25). Iminosugars have been shown to increase the cellular activity of the N370S mutant form of GC, as well as of wild-type enzyme (15, 26). However, iminosugar derivatives are nonspecific and have relatively short half-lives in cells (16). Thus, nonsugar small-molecule GC chaperones are needed both as research tools and as starting points for the development of new therapies for Gaucher disease. Herein, we report the identification of three classes of nonsugar GC inhibitors represented by N-(4-methyl-2-morpholinoquinolin-6-yl)cyclohexanecarboxamide [1], N-(5-ethyl-1,3,4-thiadiazol-2-yl)-4-(phenylsulfonamido) benzamide [2], and 2-(4-(5-chloro-2-methoxyphenylamino)-6-(pyrrolidin-1-yl)-1,3,5-triazin-2-ylamino)ethanol [3] (Fig. 1). These compounds have potencies and efficacies that compare favorably to iminosugars N-butyl-deoxynojirimycin (butyl-DNJ) [4], N-nonyl-deoxynojirimycin (nonyl-DNJ) [5], isofagomine [6], and conduritol-β-epoxide [7] (Fig. 1) and represent the first nonsugar based classes of small-molecule GC inhibitors.
Fig. 1.
Structures of N-(4-methyl-2-morpholinoquinolin-6-yl)cyclohexanecarboxamide [1], N-(5-ethyl-1,3,4-thiadiazol-2-yl)-4-(phenylsulfonamido)benzamide [2] and 2-(4-(5-chloro-2-methoxyphenylamino)-6-(pyrrolidin-1-yl)-1,3,5-triazin-2-ylamino)ethanol [3] and known sugar-based GC inhibitors butyl-DNJ [4], nonyl-DNJ [5] and isofagomine [6], and conduritol β-epoxide [7].
Small-molecule probes are powerful tools for studying biological systems, including protein function, cell signaling pathways, and disease models. The actions of small-molecule probes on their target proteins are usually rapid, dose-dependent and reversible and can provide insights into new therapeutic strategies (27, 28). Because the number of currently available chemical probes is limited relative to the number of protein targets identified, more efficient paradigms are required to generate probes for research and leads for therapeutic medicinal chemistry optimization. We previously published a technical description of a novel screening method, qHTS (29), that bypasses repeated selection and confirmation of active compounds and decreases false positives and negatives. Here we have used the qHTS approach to rapidly identify lead compounds with therapeutic potential for a specific target, glucocerebrosidase.
Results
Primary Screen.
Although the ultimate goal of this work was to identify novel chemical chaperones for mutant GC in cells, the primary screen was performed using purified WT GC enzyme to permit facile screening of a large compound collection. Inhibition or activation of GC was used as an indicator of GC binding. Active compounds identified in the primary screen and commercially available analogs were then tested in cell-based secondary assays using patient fibroblasts expressing mutant GC to identify chaperone activity.
The primary qHTS was performed on a library of 59,815 structurally diverse compounds in 7–15 concentrations using a GC enzyme assay adapted for the fluorogenic substrate resorufin β-d-glucopyranoside. A detailed report of the assay will be published separately. The signal-to-basal ratio was 4-fold, and the Z′ (30) averaged 0.58 for the entire screen; all screening data can be found in PubChem (AIDs: 348 and 360). A concentration series of conduritol-β-epoxide [7] (Fig. 1), a known GC inhibitor, was included as a positive control on each assay plate; its IC50 was 16.7 ± 1.2 μM (mean ± SD) across all 369 plates. qHTS provides concentration responses and AC50 values, defined as the half-maximal activity concentration (either inhibitory or activating) (29), for all compounds screened. Compounds with AC50 values <10 μM were selected from the primary screen, yielding a total of 255 active compounds (0.31%), of which 27 had an AC50 of <1 μM. The most potent compound identified was an inhibitor with an IC50 of 69 nM [see supporting information (SI) Fig. 5 and SI Text].
Hierarchical Structural Analysis and SAR Expansion.
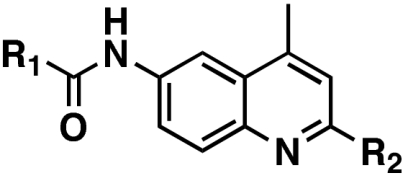
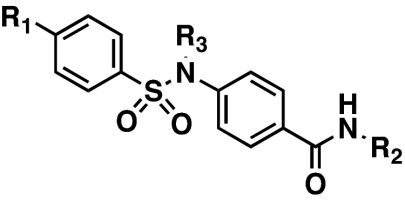
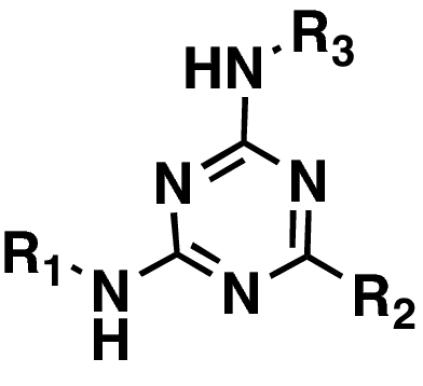
The qHTS method allows for an exceptionally in-depth analysis of the primary screen results and provides detailed information regarding both potency and efficacy before any confirmatory assays. Hierarchical clustering of all 255 active compounds using Leadscope (31) yielded 42 clusters and 52 singletons. Structure–activity relationships (SARs) were established by defining maximal common substructures (MCS) for each cluster. All compounds within each cluster that shared the MCS were subsequently retrieved. From these subsets, three classes of inhibitors, with core structures of an aminoquinoline, sulfonamide, and triazine, were chosen for advanced study (exemplified by 1, 2, and 3, Fig. 1). These initial active compound classes were chosen based on their potency, efficacy, SAR range, and synthetic tractability. Consideration was also given to Lipinski compliance, optimization potential, and relationship to other known pharmacophores and privileged structures. SARs identified in the qHTS were rapidly expanded by obtaining commercially available analogs in each series. Chemical structures, activity data, and concentration response curves for all three series are in Table 1 and SI Fig. 6.
Table 1.
Pharmacological characteristics of 1, 2, and 3 and selected analogs
AC50 values were determined for compounds in the primary screen. IC50 values were determined for independent powder samples of primary screen actives and additional analogs. NA, not applicable; ND, not determined.
The primary screen identified a collection of 2,6-substituted-4-methylquinolines (the aminoquinoline series) that contained 10 active compounds, with potencies from 0.063 to 6.80 μM, and 19 inactive compounds. The most potent and efficacious derivative in this class was 4-methyl-N-(4-methyl-2-morpholinoquinolin-6-yl)cyclohexanecarboxamide (8, NCGC00045406), with an IC50 of 63 nM (Table 1). Preliminary SAR studies indicated that the 2-morpholino substituent and the cyclohexanecarboxamide function at the 6 position of the quinoline ring are important for potency. Our initial expansion of the aminoquinoline series identified several additional active derivatives, including the closely related N-(4-methyl-2-morpholinoquinolin-6-yl)cyclohexanecarboxamide (1, NCGC00092410), with an IC50 of 31 nM, the lowest for this compound class.
The sulfonamide series comprised a set of N-aryl-4-(arylsulfonamido)benzamide compounds that favored heterocyclic benzamides and mono- or unsubstituted phenylsulfonamides (Table 1). Several compounds with excellent potencies were identified in the primary screen, including N-(5-methylisoxazol-3-yl)-4-(phenylsulfonamido)benzamide (10, NCGC00058635), with an IC50 of 168 nM, and N-(5-ethyl-1,3,4-thiadiazol-2-yl)-4-(phenylsulfonamido)benzamide (2, NCGC00060210), which had the best potency of the series at 103 nM. In this series of compounds, it was apparent that a sulfonamide rather than an amide amplifies the IC50s (data not shown). The sulfonamide proton (or the lack of any alkyl substituent in replacement) also may be a critical feature, as the analogous N-alkylsulfonamido versions of 2, 10, and 23 (12, 13, and 24, respectively) all suffered losses in the apparent IC50 values (Table 1). The expansion of SAR surrounding the 5-ethyl-1,3,4-thiadiazol-2-amide moiety is still unexplored.
The final compound set considered was a series of 2-(4,6-substituted-1,3,5-triazin-2-ylamino)ethanol analogs (the triazine series) (Table 1). From this limited compound set, only 2-(4-(5-chloro-2-methoxyphenylamino)-6-(pyrrolidin-1-yl)-1,3,5-triazin-2-ylamino)ethanol (3, NCGC00029010) was noted to possess a submicromolar IC50 value (SI Fig. 6). Investigations to further expand this class of compounds are currently underway.
Mode of Inhibition and Selectivity of GC Inhibitors.
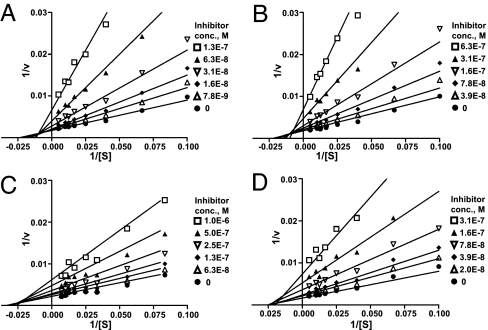
The mode of inhibition by compounds 1, 2, and 3 and by the iminosugar 5 (nonyl-DNJ), were determined kinetically by measuring the GC activity at various substrate concentrations (10–150 μM) in the absence and presence of increasing concentrations of the inhibitors. All three inhibitors exhibited linear mixed inhibition, with an increase in Km and decrease in Vmax values with increasing inhibitor concentrations (Fig. 2 A–C). The iminosugar 5 showed pure noncompetitive inhibition, with a decrease in Vmax, but no effect on Km (Fig. 2D).
Fig. 2.
Lineweaver–Burk plots of the enzyme kinetics of GC inhibitors. Each inhibitor was tested in triplicate in two independent assays at the concentrations shown in the legend box of each graph, with (●) indicating the absence of inhibitor. (A–C) Compounds 1 (NCGC00092410), 2 (NCGC00060210), and 3 (NCGC00029010) showed an increase in Km and a decrease in Vmax, indicating linear mixed inhibition. (D) Compound 5 (nonyl-DNJ) only increased Vmax without a change in Km, indicating noncompetitive inhibition.
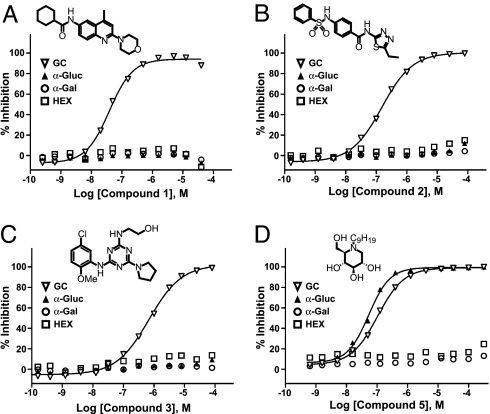
To determine selectivity for glucocerebrosidase (acid β-glucosidase), the inhibitory activity of 1, 2, 3, and 5 against the related enzymes α-glucosidase (EC.3.2.1.20), α-galactosidase (EC.3.2.1.22), and β-hexosaminidase [β-N-acetylglucosaminidase, HEX (EC.3.2.1.52)] was determined. These three enzymes are all lipid hydrolases that share the same metabolic pathway as GC. Compounds 1, 2, and 3 showed no activity against the related hydrolases at concentrations up to 77 μM (Fig. 3 A–C), demonstrating high selectivity for GC. In contrast, the iminosugar 5 inhibited both GC and α-glucosidase, with IC50 values of 0.103 and 0.050 μM, respectively (Fig. 3D).
Fig. 3.
Selectivity of inhibitors with related hydrolases. Inhibitors were tested on GC, α-glucosidase (α-Gluc), α-galactosidase (α-Gal), and β-N-acetylglucosaminidase (HEX). Data represent the results of three independent experiments performed with three replicates per sample. (A) Compound 1, an aminoquinoline derivative. (B) Compound 2, a sulfonamide derivative. (C) Compound 3, a triazine derivative. (D) Nonyl-DNJ (compound 5), an iminosugar.
Enhancement of GC Activity in Gaucher Fibroblasts.
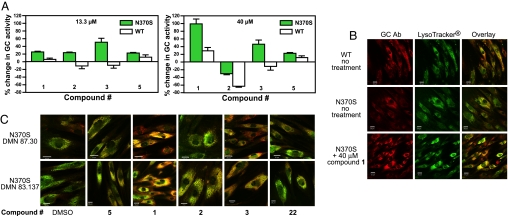
qHTS performed on the purified enzyme efficiently identified three series of selective nonsugar GC inhibitors. To test for chaperone activity, GC activity was measured in fibroblasts from controls and N370S homozygotes after treatment with the inhibitors. The N370S mutation is the most common Gaucher allele, and trafficking of the mutant protein and its response to iminosugar inhibitors have been well studied (15, 26, 32, 33). A pulse–chase assay, modified from a method developed by Kelly and coworkers (15, 20, 25), was used to assess chaperone activity. WT and mutant fibroblasts were incubated for 2 days with 1, 2, or 3 in a range of concentrations from 55 nM to 40 μM, followed by washing and incubation in inhibitor-free medium for 3 h, then measurement of GC activity in the absence of compound. Treatment with 40 μM 1 or 3 resulted in a 40–90% increase of GC activity in the N370S mutant cells, whereas activity was either inhibited [2 and 3] or increased <30% [1] from baseline in WT fibroblasts (Fig. 4A). Compound 2 showed a small increase in enzyme activity in mutant cells at 13.3 μM but inhibition at 40 μM. None of the compounds enhanced GC activity at concentrations <13.3 μM. The iminosugar GC inhibitor, 5 (nonyl-DNJ), exhibited a 20% increase of GC activity in the mutant cells at both concentrations, similar to previous reports (15). In contrast, 21, a weak aminoquinoline inhibitor (Ki = 0.975 μM), and 22, an inactive aminoquinoline, did not increase GC activity in either cell line (data not shown). The observation that 1, 2, and 3 are all potent and selective inhibitors of the purified GC enzyme and also increase GC activity in cells demonstrates their potential as GC chaperones.
Fig. 4.
Effects of GC inhibitors on enzyme activity and trafficking in fibroblasts from patients with Gaucher disease (genotype N370S/N370S) and from control subjects (WT). (A) Percentage change in GC activity. Fibroblast lines DMN 87.30 (N370S) and GM5659 (WT) treated with compounds at either 13.3 or 40 μM were assayed for GC activity, as described in Methods. Data represent three independent experiments performed with three replicates per sample. Error bars are SEM. (B) Dual labeling with polyclonal GC antibody (GC Ab, red) and a lysosomal marker (LysoTracker, green) in untreated WT (GM 3348) and N370S (DMN 87.30) fibroblasts and in the N370S line treated with 40 μM compound 1. Overlay images demonstrating colocalization (yellow) of GC Ab with the lysosomal marker indicate potential improvement in GC trafficking. (C) Immunofluorescence staining of two N370S mutant fibroblast lines, DMN 83.137 and DMN 87.30, grown with 40 μM compounds. Cells were costained with GC Ab and LysoTracker as in B. Overlay images are shown for cells treated with DMSO (control), 5 (nonyl-DNJ), active compounds 1, 2, and 3, and 22, an inactive compound. Although there is some lysosomal colocalization in both cell lines, compound 1 and, to a lesser extent, compound 3, which significantly increased GC activity in the cell-based assay, show increased yellow fluorescence, demonstrating an increase of GC in the lysosomal compartment.
Increase in Lysosomal Localization of GC in Gaucher Fibroblasts.
If 1, 2, and 3 possess chaperone activity, they should enhance trafficking of GC in mutant fibroblasts and demonstrate an increase in GC localization to the lysosome. The effects of these three compounds, the iminosugar 5, and the inactive compound 22 on localization of GC were studied in N370S mutant fibroblasts, using a polyclonal antibody to GC and the lysosomal marker LysoTracker DND-99. In WT fibroblasts, GC colocalized with the lysosomal marker (visualized as yellow in Fig. 4B), whereas very little colocalization was seen in untreated N370S mutant cells. In contrast, treatment of two different N370S mutant fibroblast lines with 40 μM 1, and, to a lesser extent, 3 and 5, resulted in a substantial increase in localization of GC protein in the lysosomes. Mutant cells treated with 40 μM 2 or 22, or DMSO alone, showed limited lysosomal colocalization (Fig. 4C). Taken together, the increase in lysosomal localization and in GC activity upon treatment with 1 and 3 strongly suggest that these compounds act as chaperones to normalize trafficking of mutant glucocerebrosidase in cells.
Discussion
Despite clinical improvements achieved by enzyme replacement therapies in patients with lysosomal storage disorders, the need for new and inexpensive therapeutic approaches for these diseases persists (8, 9, 34, 35). Chemical chaperone therapy is an attractive approach because of its potential for simple oral administration, penetration of the blood–brain barrier, and low cost. In this approach, the chaperone compound binds reversibly to the mutant enzyme, stabilizing its structure and restoring proper trafficking to the lysosome, and then dissociates, allowing the enzyme to metabolize the accumulated substrate. Current efforts to develop small molecule chaperone therapies for Gaucher disease have focused primarily on iminosugar GC substrate analogs (17–22). However, these molecules can inhibit other glycolipid and glycoprotein processing enzymes and many have fairly low potency and brief half-lives (14, 16, 26). Here we report the identification of multiple structural series of nonsugar GC chaperones that may obviate these potential limitations and serve as research probes for elucidating the pathophysiology of lysosomal disorders.
Advances in robotic instrumentation, assay technologies, and compound libraries have greatly improved the feasibility, flexibility, and throughput of HTS (36, 37). However, traditional HTS, performed at a single-compound concentration, remains relatively inefficient because of false-negative and -positive rates of up to 70% (29, 38). This necessitates time-consuming selection and retesting of individual compounds to confirm their activity and characterize their pharmacology. Derivation of SARs from primary screen data is limited and difficult. The qHTS method was developed to address these limitations and to provide more reliable and comprehensive data sets that could accelerate the development of probes for chemical genomics and leads for drug development (29). In this paper, we demonstrate that qHTS does, in fact, accelerate the identification of chemical probes by allowing reliable assignment of the activity and pharmacology of every compound screened, clustering into SAR series, and rapid triage of compound series for follow-up.
qHTS of ≈60,000 compounds with diverse structures and high chemical purity led to the rapid identification of the first nonsugar structural series of GC inhibitors. The qHTS data allowed definition of positive and negative SAR, enabled targeted followup testing of small numbers of analogs, and identified compounds with the desired probe characteristics. Further optimization of these probes into medicinal leads using rational chemical synthesis can now begin, far sooner than would have been possible had traditional HTS been used for the primary screen.
The newly identified GC inhibitors 1, 2, and 3 are potent compounds that differ in structure, mode of inhibition and selectivity from known sugar-analog inhibitors and appear to act as GC chaperones, increasing the activity and lysosomal localization of glucocerebrosidase in mutant cell lines. The GC probes identified here will be valuable research tools for the study of the pathogenesis of Gaucher disease and the mechanisms of chemical chaperones. Equally important, the three independent structural series of GC probes, all of which are medicinally attractive and highly amenable to chemical modification, can now be optimized further to improve potency, membrane permeability, bioavailability and blood–brain barrier penetration. Cocrystallization of the compounds with GC is currently in progress and will facilitate this optimization. Such optimized compounds would be new therapeutic candidates for the small-molecule treatment of Gaucher disease. Finally, the qHTS-based lead development paradigm demonstrated here promises to accelerate the development of both new probes to understand the genome and new therapies for patients afflicted with genetic diseases.
Methods
qHTS and SAR Analysis.
A library of 59,815 structurally diverse compounds was serially diluted 1:5 in DMSO to yield seven concentrations and formatted into 1,536-well plates. Dilutions of the GC inhibitor, conduritol-β-epoxide [7], were run on each plate as an internal control. The screen was performed with a fully automated robotic screening system (Kalypsys, San Diego, CA) as described (29), using a fluorogenic enzyme assay. Fluorescence intensity was measured with a ViewLux CCD-imaging plate reader (PerkinElmer, Boston, MA). The final concentrations of compounds in the 3 μl assay volume ranged from 0.005 to 77 μM. Primary screen data were analyzed with GeneData Screener (GeneData, Basel, Switzerland), and structural clustering of active compounds was performed using Leadscope Hosted Client (Leadscope, Columbus, OH). Dry powder samples of active compounds from the primary screen and additional analogs were purchased from commercial sources, dissolved in DMSO, and assayed to extend the SAR analysis. Details of chemical sources and qHTS analysis are given in SI Text.
GC Enzyme Assay.
Recombinant GC (Cerezyme; Genzyme, Cambridge, MA) was used for all screening, specificity, and kinetic studies. Two microvolume GC enzyme assays were developed using two different fluorogenic substrates. The primary screen used the substrate resorufin β-d-glucopyranoside (Km = 28 μM) in an assay buffer composed of 50 mM citric acid, KH2PO4 (pH 5.9), 10 mM sodium taurocholate, and 0.01% Tween 20. GC in assay buffer was added to a 1,536-well black plate at 2 μl per well, followed by the addition of 23 nl of compound in DMSO with a pin-tool station (Kalypsys). After 5 min at RT (≈21°C), 1 μl per well of substrate was added and incubated for 20 min at room temperature. Fluorescence intensity was measured at an excitation of 570 (±10) nm and an emission of 610 (±10) nm. The final concentrations of enzyme and substrate were 1.9 nM and 30 μM, respectively. The second assay used the same assay conditions and the substrate 4-methylumbelliferyl-β-d-glucopyranoside (Km = 862 μM). Addition of an equal volume of stop solution, 1 M Gly/1 M NaOH, pH 10, raised the pH for optimal fluorescence intensity. Plates were read at an excitation of 360 (±10) nm and an emission of 440 (±10) nm. Comparison of activity in the two assays, at different wavelengths, eliminated false positives because of autofluorescence of the compound being tested.
Enzyme Kinetic Assay.
The substrate resorufin β-d-glucopyranoside was diluted to eight concentrations, ranging from 10 to 150 μM. Seven concentrations of inhibitors (between 0.5- and 5-fold of IC50 value) and a DMSO control were added to the enzyme solution. The final enzyme concentration was 1.9 nM to give a linear reaction over 10 min. Enzyme kinetics were measured by the addition of 1 μl of substrate to a 1,536-well assay plate, followed by 2 μl of enzyme solution (with or without inhibitor) using a Cybi-Well pipettor (Cybio, Woburn, MA). The increase in product fluorescence was measured at 1 min intervals for 10 min in the ViewLux. The rate of product formation was calculated by converting the fluorescence units to picomoles of product per minute using a standard curve of the free fluorophore, resorufin.
Enzyme Selectivity Assays.
Three additional hydrolases and their substrates, α-glucosidase from rice and 4-methylumbelliferyl α-d-glucopyranoside (4MU-α-Glc), α-galactosidase from green coffee beans and 4-methylumbelliferyl α-d-galactopyranoside (4MU-α-Gal), and β-N-acetylglucosaminidase from human (HEX) and 4-methylumbelliferyl N-acetyl-β-d-glucosaminide (4MU-β-GSM) were obtained from Sigma-Aldrich. The enzyme assay methods were similar to those previously reported (39–41) with modification for the miniaturization into 1,536-well plates. The buffer for all three enzyme assays consisted of 50 mM citric acid, KH2PO4 (pH 4.5), 10 mM sodium taurocholate, and 0.01% Tween 20. The final enzyme concentrations for α-glucosidase, α-galactosidase, and β-N-acetylglucosaminidase were 8, 1, and 8 nM, respectively. The substrate concentrations were similar to the Km values for these related enzymes, at 0.16, 0.4, and 0.2 mM, respectively.
Cell Culture.
Primary skin fibroblast lines were collected under a National Institutes of Health Institute Review Board approved clinical protocol from patients with Gaucher disease, DMN 87.30 and DMN 83.137 (genotype N370S/N370S), and control individuals GM 3348 and GM 5659 (Coriell Cell Repositories, Camden, NJ). Cells were cultured in DMEM/10% FBS/2 mM Glu/1% Pen-Strep at 37°C in 5% CO2.
Cell-Based Assay of GC Activity.
The cell-based assay was similar to that described by Sawkar et al. (26) with modifications. Cells were seeded in 384-well assay plates at a density of 3,000 cells per well in 50-μl medium. Compounds were serially diluted 1:3 in DMSO to give seven concentrations ranging from 10 mM to 13.7 μM. After culturing for 1 day, 0.2 μl of compound in DMSO was added to each well, yielding final concentrations of 40 μM to 54.9 nM, and the cells were grown an additional 2–3 days. The cells were washed three times with 50 μl of Hanks' buffered saline solution (HBSS) using an ELx405 automated cell washer (BioTek, Winooski, VT), then incubated in 50 μl of HBSS for 3 h at 37°C to eliminate the inhibitors. After removing the HBSS, 25 μl of assay mixture (4 mM 4-methylumbelliferyl β-d-gluco-pyranoside in PBS/0.2 M acetic acid, pH 4.2, 1:1) was added. Plates were incubated at 37°C for 40 min followed by addition of 25 μl of stop solution (1 M Gly/1 M NaOH, pH 10). Product fluorescence was measured at an excitation of 360 nm and an emission of 440 nm. Enzyme activity in cells treated with DMSO was used as a baseline, and results were calculated as the percent change in enzyme activity in cells treated with the inhibitors.
Immunofluorescence Staining and Confocal Microscopy.
Fibroblast cell lines from patients and controls were grown on glass coverslips in 12-well plates to 60% confluency. The mutant cells were treated with 40 μM inhibitor compounds in DMSO for 60–72 h. Cells were then incubated with LysoTracker DND-99 (Molecular Probes, Eugene, OR) according to the manufacturer's instructions and fixed with 2% formaldehyde for 20 min. After serial washings and permeabilization with 0.1% saponin, rabbit polyclonal antiglucocerebrosidase antibody (R386, 1:400) was applied for 1 h, followed by secondary antibody conjugated to Cy5 (1:500; Jackson ImmunoResearch, West Grove, PA). Immunofluorescence detection was performed on an LSM 510 META NLO scanning confocal microscope (Zeiss, Heidelberg, Germany). Details of image collection and processing are given in SI Text.
Supplementary Material
Acknowledgments
We thank S. Michael and C. Klumpp for assistance with the automated screening, Adam Yasgar for compound management, and Stephen M. Wincovitch for help with confocal microscopy. We also thank Craig Thomas and Ron Johnson for helpful suggestions and critical reading of the manuscript. This research was supported by the Molecular Libraries Initiative of the National Institutes of Health Roadmap for Medical Research and the Intramural Research Program of the National Human Genome Research Institute, National Institutes of Health.
Abbreviations
- qHTS
quantitative high-throughput screening
- SAR
structure–activity relationship
- GC
glucocerebrosidase
- nonyl-DNJ
N-nonyl-deoxynojirimycin
- ER
endoplasmic reticulum
- AC50
half-maximal activity concentration.
Footnotes
The authors declare no conflict of interest.
Data deposition: The screening data in this paper have been deposited in the PubChem database (Assay IDs 348 and 360).
This article contains supporting information online at www.pnas.org/cgi/content/full/0705637104/DC1.
References
- 1.Zhao H, Grabowski GA. Cell Mol Life Sci. 2002;59:694–707. doi: 10.1007/s00018-002-8458-y. [DOI] [PMC free article] [PubMed] [Google Scholar]
- 2.Hruska KS, LaMarca ME, Sidransky E. In: Gaucher Disease. Futerman AH, Zimran A, editors. Boca Raton, FL: CRC Press; 2006. pp. 13–48. [Google Scholar]
- 3.Barton NW, Brady RO, Dambrosia JM, Dibisceglie AM, Doppelt SH, Hill SC, Mankin HJ, Murray GJ, Parker RI, Argoff CE, et al. N Engl J Med. 1991;324:1464–1470. doi: 10.1056/NEJM199105233242104. [DOI] [PubMed] [Google Scholar]
- 4.Weinreb NJ, Charrow J, Andersson HC, Kaplan P, Kolodny EH, Mistry P, Pastores G, Rosenbloom BE, Scott CR, Wappner RS, et al. Am J Med. 2002;113:112–119. doi: 10.1016/s0002-9343(02)01150-6. [DOI] [PubMed] [Google Scholar]
- 5.Altarescu G, Hill S, Wiggs E, Jeffries N, Kreps C, Parker CC, Brady RO, Barton NW, Schiffmann R. J Pediatr. 2001;138:539–547. doi: 10.1067/mpd.2001.112171. [DOI] [PubMed] [Google Scholar]
- 6.Cabrera-Salazar MA, Novelli E, Barranger JA. Curr Opin Mol Ther. 2002;4:349–358. [PubMed] [Google Scholar]
- 7.Cox TM. Acta Paediatr Suppl. 2005;94:69–75. doi: 10.1111/j.1651-2227.2005.tb02116.x. discussion, 57. [DOI] [PubMed] [Google Scholar]
- 8.Sawkar AR, D'Haeze W, Kelly JW. Cell Mol Life Sci. 2006;63:1179–1192. doi: 10.1007/s00018-005-5437-0. [DOI] [PMC free article] [PubMed] [Google Scholar]
- 9.Sidransky E, LaMarca ME, Ginns EI. Mol Genet Metab. 2007;90:122–125. doi: 10.1016/j.ymgme.2006.09.007. [DOI] [PubMed] [Google Scholar]
- 10.Morello JP, Salahpour A, Laperriere A, Bernier V, Arthus MF, Lonergan M, Petaja-Repo U, Angers S, Morin D, Bichet DG, et al. J Clin Invest. 2000;105:887–895. doi: 10.1172/JCI8688. [DOI] [PMC free article] [PubMed] [Google Scholar]
- 11.Bernier V, Bichet DG, Bouvier M. Curr Opin Pharmacol. 2004;4:528–533. doi: 10.1016/j.coph.2004.08.001. [DOI] [PubMed] [Google Scholar]
- 12.Wiseman RL, Balch WE. Trends Mol Med. 2005;11:347–350. doi: 10.1016/j.molmed.2005.06.011. [DOI] [PubMed] [Google Scholar]
- 13.Fan JQ. Trends Pharmacol Sci. 2003;24:355–360. doi: 10.1016/S0165-6147(03)00158-5. [DOI] [PubMed] [Google Scholar]
- 14.Butters TD. Expert Opin Pharmacother. 2007;8:427–435. doi: 10.1517/14656566.8.4.427. [DOI] [PubMed] [Google Scholar]
- 15.Sawkar AR, Cheng WC, Beutler E, Wong CH, Balch WE, Kelly JW. Proc Natl Acad Sci USA. 2002;99:15428–15433. doi: 10.1073/pnas.192582899. [DOI] [PMC free article] [PubMed] [Google Scholar]
- 16.Butters TD, Dwek RA, Platt FM. Glycobiology. 2005;15:43R–52R. doi: 10.1093/glycob/cwi076. [DOI] [PubMed] [Google Scholar]
- 17.Zhu X, Sheth KA, Li S, Chang HH, Fan JQ. Angew Chem Int Ed Engl. 2005;44:7450–7453. doi: 10.1002/anie.200502662. [DOI] [PubMed] [Google Scholar]
- 18.Chang HH, Asano N, Ishii S, Ichikawa Y, Fan JQ. FEBS J. 2006;273:4082–4092. doi: 10.1111/j.1742-4658.2006.05410.x. [DOI] [PubMed] [Google Scholar]
- 19.Compain P, Martin OR, Boucheron C, Godin G, Yu L, Ikeda K, Asano N. ChemBioChem. 2006;7:1356–1359. doi: 10.1002/cbic.200600217. [DOI] [PubMed] [Google Scholar]
- 20.Sawkar AR, Schmitz M, Zimmer KP, Reczek D, Edmunds T, Balch WE, Kelly JW. ACS Chem Biol. 2006;1:235–251. doi: 10.1021/cb600187q. [DOI] [PubMed] [Google Scholar]
- 21.Steet RA, Chung S, Wustman B, Powe A, Do H, Kornfeld SA. Proc Natl Acad Sci USA. 2006;103:13813–13818. doi: 10.1073/pnas.0605928103. [DOI] [PMC free article] [PubMed] [Google Scholar]
- 22.Yu L, Ikeda K, Kato A, Adachi I, Godin G, Compain P, Martin O, Asano N. Bioorg Med Chem. 2006;14:7736–7744. doi: 10.1016/j.bmc.2006.08.003. [DOI] [PubMed] [Google Scholar]
- 23.Egido-Gabas M, Canals D, Casas J, Llebaria A, Delgado A. ChemMedChem. 2007;2:292–294. doi: 10.1002/cmdc.200700061. [DOI] [PubMed] [Google Scholar]
- 24.Lei K, Ninomiya H, Suzuki M, Inoue T, Sawa M, Iida M, Ida H, Eto Y, Ogawa S, Ohno K, et al. Biochim Biophys Acta. 2007;1772:587–596. doi: 10.1016/j.bbadis.2007.02.003. [DOI] [PubMed] [Google Scholar]
- 25.Yu Z, Sawkar AR, Whalen LJ, Wong CH, Kelly JW. J Med Chem. 2007;50:94–100. doi: 10.1021/jm060677i. [DOI] [PMC free article] [PubMed] [Google Scholar]
- 26.Sawkar AR, Adamski-Werner SL, Cheng WC, Wong CH, Beutler E, Zimmer KP, Kelly JW. Chem Biol. 2005;12:1235–1244. doi: 10.1016/j.chembiol.2005.09.007. [DOI] [PubMed] [Google Scholar]
- 27.Kozarich JW. Curr Opin Chem Biol. 2003;7:78–83. doi: 10.1016/s1367-5931(02)00013-3. [DOI] [PubMed] [Google Scholar]
- 28.Lipinski C, Hopkins A. Nature. 2004;432:855–861. doi: 10.1038/nature03193. [DOI] [PubMed] [Google Scholar]
- 29.Inglese J, Auld DS, Jadhav A, Johnson RL, Simeonov A, Yasgar A, Zheng W, Austin CP. Proc Natl Acad Sci USA. 2006;103:11473–11478. doi: 10.1073/pnas.0604348103. [DOI] [PMC free article] [PubMed] [Google Scholar]
- 30.Zhang JH, Chung TD, Oldenburg KR. J Biomol Screen. 1999;4:67–73. doi: 10.1177/108705719900400206. [DOI] [PubMed] [Google Scholar]
- 31.Blower PE, Jr, Cross KP, Fligner MA, Myatt GJ, Verducci JS, Yang C. Curr Drug Discov Technol. 2004;1:37–47. doi: 10.2174/1570163043484879. [DOI] [PubMed] [Google Scholar]
- 32.Schmitz M, Alfalah M, Aerts JM, Naim HY, Zimmer KP. Int J Biochem Cell Biol. 2005;37:2310–2320. doi: 10.1016/j.biocel.2005.05.008. [DOI] [PubMed] [Google Scholar]
- 33.Lieberman RL, Wustman BA, Huertas P, Powe AC, Jr, Pine CW, Khanna R, Schlossmacher MG, Ringe D, Petsko GA. Nat Chem Biol. 2007;3:101–107. doi: 10.1038/nchembio850. [DOI] [PubMed] [Google Scholar]
- 34.Pastores GM, Barnett NL. Exp Opin Emerg Drugs. 2005;10:891–902. doi: 10.1517/14728214.10.4.891. [DOI] [PubMed] [Google Scholar]
- 35.Beutler E. Mol Genet Metab. 2006;88:208–215. doi: 10.1016/j.ymgme.2006.01.010. [DOI] [PubMed] [Google Scholar]
- 36.Posner BA. Curr Opin Drug Discov Dev. 2005;8:487–494. [PubMed] [Google Scholar]
- 37.Carnero A. Clin Transl Oncol. 2006;8:482–490. doi: 10.1007/s12094-006-0048-2. [DOI] [PubMed] [Google Scholar]
- 38.Gribbon P, Sewing A. Drug Discov Today. 2005;10:17–22. doi: 10.1016/S1359-6446(04)03275-1. [DOI] [PubMed] [Google Scholar]
- 39.Reuser AJ, Koster JF, Hoogeveen A, Galjaard H. Am J Hum Genet. 1978;30:132–143. [PMC free article] [PubMed] [Google Scholar]
- 40.Mayes JS, Scheerer JB, Sifers RN, Donaldson ML. Clin Chim Acta. 1981;112:247–251. doi: 10.1016/0009-8981(81)90384-3. [DOI] [PubMed] [Google Scholar]
- 41.Kim EJ, Kang DO, Love DC, Hanover JA. Carbohydr Res. 2006;341:971–982. doi: 10.1016/j.carres.2006.03.004. [DOI] [PMC free article] [PubMed] [Google Scholar]
Associated Data
This section collects any data citations, data availability statements, or supplementary materials included in this article.


