

Abstract
DNA molecules containing inosine in place of guanosine and/or 2,6-diaminopurine in place of adenine have been synthesized and tested as substrates for binding of sequence-selective ligands, both small and large. Footprinting patterns reveal that the binding sites for AT- or GC-specific antibiotics (distamycin or mithramycin, respectively) are completely changed in the modified DNAs, as expected for direct sequence readout involving contact with the purine 2-amino group. However, we also find large changes in the binding of HMG-D, a member of the HMG-1 family of chromosomal proteins, pointing to an indirect influence of the exocyclic amino group on ligand binding via an effect on the deformability of the double helix. This interpretation is confirmed by the finding that deoxyuridine-containing poly- and oligonucleotides, which lack the exocyclic methyl group of thymidine in the major groove, interact 5–10 times more strongly with HMG-D than do their counterparts containing natural nucleotides.
Keywords: footprinting, DNA recognition, drug–DNA interaction, protein–DNA binding, purine 2-amino group
Sequence-specific binding to DNA depends upon the chemical complementarity between the ligand and the DNA bases (1) as well as on the sequence-dependent deformability of the DNA target site (2, 3). The relative contributions of these two factors can vary widely. In some cases, notably the positioning of the histone octamer on a particular sequence, the structural component is dominant (4, 5). By contrast, base-specific direct readout is the principal mode of recognition by most small drug molecules and also by certain proteins—e.g., the λ CI repressor. In many cases, however, the selective recognition of DNA involves both factors.
The interaction of most proteins with DNA occurs within the major groove. This not only offers greater accessibility than the minor groove but also displays a characteristic pattern of H-bond donors and acceptors that enables the four base pairs to be distinguished.
However, recently it has become apparent that the minor groove of the helix is not the preserve of small molecules but can serve as a receptor for several proteins (e.g., SRY, LEF-1, PurR, TBP, HMG-1, and IHF) (6, 7). The H-bond acceptors of all four base pairs (N3 of G and A and O2 of T and C) are disposed almost identically in the minor groove, implying that these acceptors can confer little sequence discrimination. However, the 2-amino group of guanine, which is the only H-bond donor directed into the minor groove, undoubtedly influences sequence readout. It is a direct target for the alkylating antibiotics mitomycin C (8) and anthramycin (9, 10) and is also directly contacted by proteins containing an HMG domain (11, 12).
To examine whether the purine 2-amino group can influence DNA recognition via indirect (analog) readout in addition to direct (digital) readout, we have varied the position of the cognate group in DNA. The strategy involves the use of the PCR to construct DNA molecules containing inosine in place of guanosine residues and/or 2,6-diaminopurine (DAP) in place of adenine residues (Fig. 1) (13, 14). By this means, we have examined the recognition of DNA by AT- and GC-specific minor groove binding drugs, distamycin and mithramycin, respectively, and also by a protein, HMG-D, that binds principally in the minor groove. HMG-D is one of the Drosophila melanogaster counterparts of the abundant chromosomal protein HMG-1 (15, 16) that not only bends DNA but binds selectively to DNA structures that are both bent and untwisted (17, 18). The results confirm that the purine 2-amino group directly influences sequence discrimination by distamycin and mithramycin. In addition we show that deletion, addition or relocation of the purine 2-amino group in the minor groove as well as deletion of the 5-methyl group of thymine from the major groove alter the affinity of DNA for HMG-D. In each case the changed affinity is attributable to an alteration in the deformability of the double helix. Together these results show that exocyclic groups can influence both direct and indirect recognition of DNA by a ligand.
Figure 1.
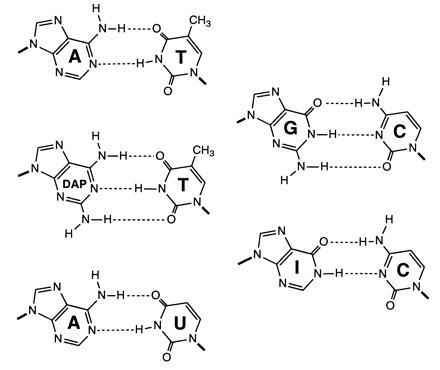
Structures of purine-pyrimidine base pairs.
MATERIALS AND METHODS
Preparation of DNA Fragments.
Molecules containing normal or modified bases (having inosine, DAP, or uracil in place of guanosine, adenine, or thymine, respectively) were synthesized by PCR using the primers 5′-AATTCCGGTTACCTTTAATC and 5′-TCGGGAACCCCCACCACGGG bearing a 5′-OH or 5′-NH2 terminal group so as to permit 5′ phosphorylation of one strand only. The template 160-bp tyrT(A93) fragment containing the Escherichia coli tyrT promoter (19) was cut out of plasmid pKMp27 (20) by digestion with restriction enzymes EcoRI and AvaI. This template bore a 5′-phosphate due to the action of EcoRI and thus only the newly synthesized DNA (with normal or modified nucleotides) could be labeled by the kinase. Twenty amplification cycles were performed, each cycle consisting of the following segments: (i) for normal, U-DNA, and DAP-DNA, 94°C for 1 min, 37°C for 2 min, and 72°C for 10 min; and (ii) for I-DNA and I+DAP-DNA, 84°C for 1 min, 30°C for 2 min, and 62°C for 10 min. The purified PCR products were 5′-end labeled with [γ-32P]ATP in the presence of T4 polynucleotide kinase and the labeled DNA was isolated by 6% PAGE.
DNase I Footprinting.
Experiments were performed essentially according to the original protocol (21). Digestion of the labeled DNA fragment dissolved in 10 mM Tris·HCl buffer (pH 7.0) containing 10 mM NaCl (6 μl) was initiated by the addition of 2 μl of a DNase I solution. The extent of digestion was limited to <30% of the starting material so as to minimize the incidence of multiple cuts in any strand. After 3 min, the reaction was stopped by freeze drying, samples were lyophilized, washed once with 50 μl of water, lyophilized again, and then resuspended in 4 μl of an 80% formamide solution containing tracking dyes. Samples were heated at 90°C for 4 min, chilled in ice for 4 min, and then applied to denaturing polyacrylamide gels in parallel with Maxam–Gilbert sequencing ladders.
Electrophoresis and Autoradiography.
DNA cleavage products were resolved by electrophoresis at 60 W using 0.3-mm-thick, 8% acrylamide/7 M urea gels in TBE buffer. Gels were soaked in 10% acetic acid for 15 min, transferred to Whatman 3MM paper and dried under vacuum at 80°C prior to analysis with a Molecular Dynamics 425E PhosphorImager. Base line-corrected scans were analyzed by integrating all band densities between two selected boundaries using imagequant version 3.3 or geltrak programs (22). The procedure of Dabrowiak and Goodisman (23) was used to construct footprinting plots of R vs. c, where c is the ligand concentration and R represents the relative band intensity given by the ratio Ic/Io; Ic is the intensity of the band at ligand concentration c and Io is the intensity of the same band in the control lane (24, 25). Each resolved band was assigned to a particular bond within the tyrT fragment by reference to sequencing markers.
Gel Retardation Analysis.
The HMG-D100 protein, overproduced in E. coli, was purified according to a standard procedure (17). It was stored at −20°C in 50 mM Hepes buffer (pH 7.5) containing 1 mM EDTA and 50% glycerol. PCR-generated 32P-5′-end-labeled tyrT(A93) DNA fragments were incubated with the protein for 30 min at 4°C in 10 μl of 20 mM Hepes (pH 7.5), 2 mM EDTA, 50 mM KCl, and 5% glycerol and then loaded directly on to a 6% polyacrylamide gel. After 90-min electrophoresis at 200 V in 0.5× TBE buffer, the gel was transferred to Whatman 3 MM paper, dried under heat and vacuum, apposed to a storage screen overnight at room temperature, and analyzed with the PhosphorImager as described above. Band intensities were measured using the imagequant software.
The duplex d(CGCAAAATATTGAAAAAACGC). d(GCGTTTTTTCAATATTTTGCG), and its analog containing dU instead of the underlined dT residues, were [32P] 5′-end labeled on one strand using T4 polynucleotide kinase. Then the duplexes (1 nM) were incubated with different concentrations of HMG-D100 for 15 min at room temperature in 20 mM Hepes (pH 7.5), 50 mM KCl, 2 mM MgCl2, and 100 μg/ml BSA. The samples were loaded directly onto 8% polyacrylamide gels and electrophoresed in 0.5 × TBE at 125 V for 30 min. The gels were dried and analyzed with the PhosphorImager.
RESULTS AND DISCUSSION
Direct Recognition of Normal and Modified DNA by Distamycin and Mithramycin.
Distamycin and mithramycin bind specifically to A+T- and G+C-rich DNA, respectively (26, 27, 28, 29). Distamycin fits in the narrow and deep minor groove of an (A·T)4 tract (30, 31, 32). Both the local geometry and the negative electrostatic potential in the minor groove favor the AT specificity of distamycin (33, 34). Conversely, mithramycin binds as a Mg2+-coordinated dimer within the wide and shallow minor groove of a (G·C)4 tract. The positioning of the two oligosaccharide chains of mithramycin in the minor groove determines its GC sequence specificity (35, 36). Notwithstanding their opposite preferences, sequence-specific recognition by distamycin and mithramycin is supposed to require direct (digital) reading of the primary sequence through a combination of close van der Waals contacts, hydrogen bonds, electrostatic attractions and hydrophobic interactions (37).
To determine the impact of A → DAP and/or G → I substitutions on the binding of these drugs to DNA we utilized quantitative DNase I footprinting (Fig. 2). With both ligands the footprinting patterns observed with modified DNA are significantly different from those obtained with normal DNA, attesting that the relocation of the 2-amino group exerts a powerful influence on the binding of the two antibiotics. For example, the strong footprint between positions 72 and 81 with normal DNA in the presence of mithramycin is weak or absent with the modified DNA species, and conversely the footprint around position 32 with I+DAP DNA corresponds to a region of enhanced DNase I cleavage with normal DNA. With distamycin, the strong footprints observed around positions 35, 64, and 90 with normal DNA are missing in DNA containing both I and DAP residues. By contrast, the region of enhanced DNase I cleavage centered on position 80 with normal DNA now corresponds to a footprint—i.e., a specific distamycin binding site with I+DAP DNA. The radically changed patterns of binding sites for both distamycin and mithramycin are emphasized in the differential cleavage plots in Fig. 3. For each antibiotic, the sites of binding (protection) and enhanced cutting are almost perfectly inverted in the doubly substituted polynucleotide. Mithramycin is displaced from its GC sites in natural DNA to pick up new sites in the DAP+T-rich sequences, whereas distamycin is displaced from its canonical AT sites to bind preferentially to the I+C-rich regions created in the modified nucleic acid. The results with the singly substituted DNA species confirm that the purine 2-amino group behaves as both a negative and positive effector for sequence-specific recognition of DNA by distamycin and mithramycin respectively. The AT-specific antibiotic fails to bind to synthetic DNA in which the minor groove is completely obstructed with the 2-amino group on every base pair, as happens with DAP–DNA, but binds nonspecifically to DNA lacking the exocyclic amino group completely (inosine DNA; data not shown). In the case of mithramycin, the replacement of A by DAP permits the antibiotic to contact both G+C- and DAP+T-rich sequences at many points along the target molecule so that a general attenuation of nuclease cleavage occurs, though residual stronger footprints at certain sites can still be discerned. Some are the canonical GC sites whereas others correspond to sites created by the incorporation of DAP. There is evidently a lot of subtle competition between natural and unnatural sites for the antibiotic. The consequence of completely removing the 2-amino group (inosine DNA) is to abolish binding of mithramycin altogether.
Figure 2.
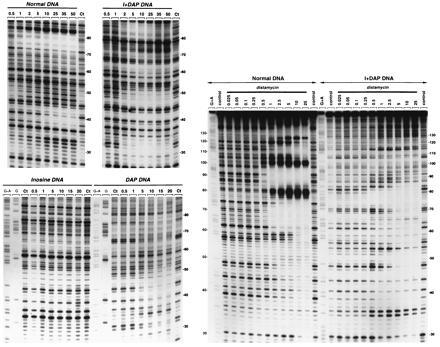
DNase I footprinting of mithramycin (Left) and distamycin (Right) on the Watson strand of tyrT(A93) DNA containing the four natural nucleotides (Normal DNA), inosine residues in place of guanosine (inosine DNA), DAP in place of adenine (DAP DNA) or inosine and DAP residues in place of guanosine and adenine respectively (I+DAP DNA). The products of DNase I digestion were identified by reference to the Maxam–Gilbert markers (lanes G and G+A), taking into account the difference in mobility of the fragments due to the presence or absence of a 3′-phosphate group. Control lanes (Ct) show the products resulting from limited DNase I digestion in the absence of ligand. The remaining lanes show the products of digestion in the presence of the indicated antibiotic concentrations (expressed as micromolar). Numbers at the side of the gels refer to the numbering scheme used in Fig. 3.
Figure 3.
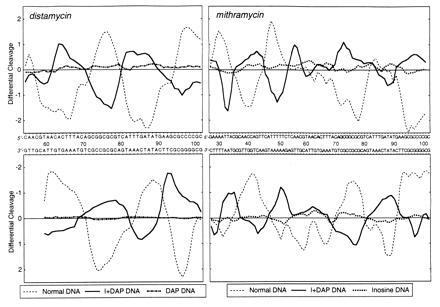
Differential cleavage plots comparing the susceptibility of tyrT(A93) DNA to cutting by DNase I in the presence of distamycin and mithramycin. (Upper) Cleavage of the Watson strand. (Lower) Complementary Crick strand. The ordinate scales for the two strands are inverted, so that deviation of points toward the lettered sequence (negative values) corresponds to a ligand-protected site and deviation away (positive values) represents enhanced cleavage. The values plotted compare the measured probabilities of cleavage expressed in logarithmic units and are smoothed by taking a three-bond running average. The plots drawn as continuous thick lines refer to the doubly substituted I+DAP DNA. Those indicated by dashed lines refer to normal DNA. The plots indicated by dotted and dash-dot lines refer to the G → I- and A → DAP-substituted DNA species, respectively. Note that the sequence printed corresponds to that of natural DNA, though in the modified DNAs adenine and/or guanosine residues are replaced by diaminopurine and/or inosine residues.
For quantitative comparison we measured the variation of band intensities as a function of antibiotic concentration for selected binding sites within the target 160-bp DNA. Examples are illustrated in Fig. 4. With mithramycin, the footprinting at the canonical G·C sites in natural DNA and at DAP·T sites in inosine plus DAP-substituted DNA occurs with half-maximal effect at concentrations (C50) about 1–2 μM and 2–4 μM, respectively, suggesting that the affinity of the drug for natural G·C-containing sites may be only slightly higher than its affinity for DAP·T-containing sites in the modified DNA. Likewise the enhanced cutting at A·T sites in normal DNA and at I·C sites in I+DAP DNA (Fig. 4) becomes evident at much the same concentrations. By contrast, the specific binding of distamycin to A·T sites in normal DNA appears significantly tighter than its binding to I·C sites in the I+DAP DNA. The inhibition of nuclease cleavage at IpC steps 75 and 96 in the I+DAP DNA is nowhere near as pronounced as the cleavage inhibition at the ApT step 87 and TpT step 66 in normal DNA. From the plots in Fig. 4 and several others, we can estimate that the affinity of distamycin for normal DNA is about three times higher than its affinity for I+DAP DNA.
Figure 4.
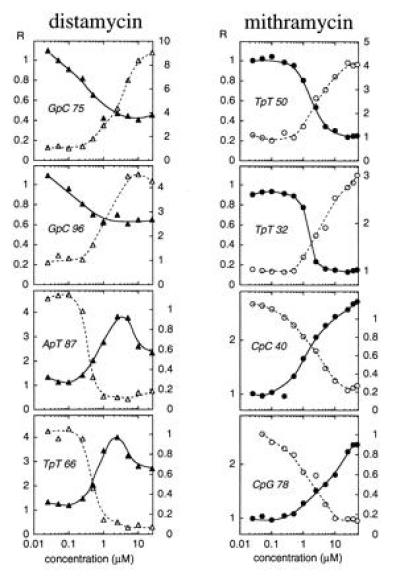
Footprinting plots for selected bonds in the normal tyrT(A93) fragment (open symbols) and its inosine plus DAP-substituted counterpart (filled symbols). The relative band intensity (R) is plotted against ligand concentration c on a logarithmic abscissa.
Indirect Recognition of Normal and Modified DNA by HMG-D.
HMG-D is a minor groove binding protein that bends DNA (17). Among the preferred targets for the protein are cis-platinated DNA (17) and interstrand S-S cross-linked DNA (18), both of which contain a highly localized bend toward the major groove. Cis-platinated DNA is also a preferred ligand for the sequence-specific HMG domains of SRY and LEF-1 (38) that induce a sharp bend toward the major groove in unmodified DNA (11, 12). Although HMG-D exhibits a small preference for the sequence TTG (17) its affinity for linear DNA appears to depend principally on the conformational flexibility rather than the base composition of the bound sequence. For example, the conformationally flexible copolymer poly d(AT) is an effective competitor of HMG-D binding to a natural DNA binding site whereas the conformationally rigid poly(dA·dT) is not (M. A. Searles and A.A.T., unpublished observations). HMG-D thus constitutes an ideal protein for investigating the effects of base substitutions on indirect recognition of DNA.
HMG-D contains a single HMG domain followed by a basic region and an acidic tail. In the experiments presented here, we used the HMG-D100 construct that corresponds to the first 100 amino acids; that is, the HMG domain plus the basic region but lacking the acidic tail. A simple electrophoretic mobility shift assay was employed to investigate its interaction with tyrT DNA fragments containing normal and modified bases. Different amounts of purified protein were incubated with a fixed amount of labeled tyrT DNA in a standard binding buffer and the mixture of free and protein-bound DNA was resolved on a nondenaturing polyacrylamide gel (Fig. 5). In agreement with previous studies (15, 17), we found that HMG-D forms multiple complexes with DNA. Up to five retarded bands can be discerned with natural DNA suggesting the presence of at least five binding sites within the 160-bp tyrT fragment. The various base substitutions clearly affect the capacity of the protein to interact with DNA. DAP-DNA, in which all purines bear an exocyclic 2-amino group, is a poor ligand for the protein since little shifted complex is formed. By contrast, HMG-D binds strongly to the inosine DNA as judged from the formation of protein–DNA complexes at concentrations as low as 5 nM. In comparison a concentration of at least 20–25 nM is required to detect complexes with normal DNA under the same conditions. With the doubly substituted DNA, the positive effect of the G → I substitution is counterbalanced by the negative effect of the A → DAP substitution. The binding of HMG-D to the I+DAP DNA is only slightly stronger than binding to normal DNA. The quantitative plots in Fig. 5C indicate that the DNA species rank in the order inosine ≫ I+DAP ≥ Normal ≫ DAP as regards their ability to bind HMG-D.
Figure 5.
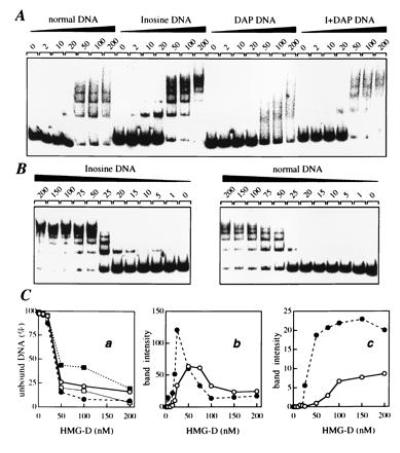
Gel retardation analysis of the interaction of HMG-D protein with normal and substituted tyrT(A93) DNA. (A) Mobility of the normal, inosine-, DAP-, and I+DAP-containing DNAs with various concentrations of HMG-D added (expressed as nM). (B) Study of the binding of HMG-D to normal and inosine-containing DNA in which the concentration of the protein was varied between 1 and 200 nM. (C) Binding to normal DNA (○), inosine-DNA (•), DAP DNA (▪) and I+DAP DNA (□). In Ca the fraction of unbound tyrT(A93) DNA is plotted as a function of HMG-D concentration; in Cb and Cc are shown the fraction of low and high molecular weight complexes formed, the former represented by the nucleoprotein band that migrated fastest in the gel and the latter by the sum of the bands corresponding to multimeric HMG-D/DNA complexes (more severely retarded bands). Data were compiled from quantitative analysis of three independent experiments.
Careful titration experiments were performed to compare the binding of HMG-D to normal and inosine-containing DNA (Fig. 5B). The observed ladder of bands characterizes the nonspecific interaction between the protein and its DNA target. The gels in Fig. 4B and the corresponding binding curves in Fig. 5C attest that the G → I substitution strongly promotes the interaction between HMG-D and the target sequence. Moreover, HMG-D forms polymeric complexes much more efficiently with inosine DNA than with normal DNA.
The substitution of DAP for A appears to reduce not only the initial affinity of HMG-D for the probe DNA but also the cooperativity of binding as judged by the comparative failure to form higher-order complexes on DAP–DNA (Fig. 5). The reduction in affinity could be a simple consequence of partial steric exclusion consequent on the presence of the additional 2-amino groups while the loss of cooperativity could be related both to this effect and to a reduction in the flexibility of DNA between bound HMG-D molecules.
We therefore tested the effect of removing the 5-methyl group of thymine from the major groove. This modification should not alter the geometry of any contact surface in the minor groove, and indeed has absolutely no effect on the binding of mithramycin or distamycin. Initially we observed that complete replacement of dT by dU in the tyrT fragment increased the affinity for HMG-D binding at multiple sites by about 10-fold (data not shown). To determine the effect of substitution more precisely we challenged HMG-D with a 21-bp oligonucleotide (17) in which just the four dT residues within the centrally placed single binding site, TATTG, were replaced by dU. This limited substitution increased the affinity for the protein by ≈five-fold (Fig. 6) showing that the principal effect of removal of the 5-methyl group must be confined to the preferred binding sequence. Further limitation of the substitutions to positions 3 and 4 only of the binding sequence, i.e., TATTG → TAUUG resulted in the same increase in affinity while a single substitution at the same TT step increased the affinity by two- to three-fold (data not shown). Conversely single substitutions at positions 1 and 2 had no effect on binding. We conclude that HMG-D binding is most sensitive to dT → dU substitution located at the TT dinucleotide step common to most known HMG domain binding sites (17).
Figure 6.
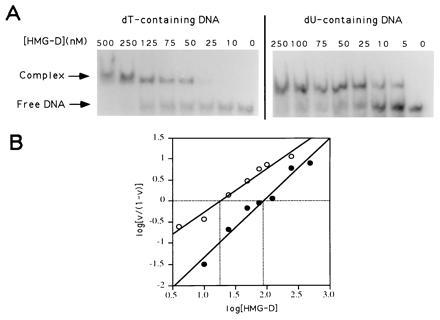
Electrophoretic mobility-shift assay of HMG-D binding to normal and dU-containing oligonucleotides. The autoradiograms (A) were used to construct binding plots (B) in which v is the bound fraction of DNA. The x intercept yields an affinity constant of 87 nM for dT-containing oligonucleotides (•) and 19 nM for dU-containing oligonucleotides (○).
CONCLUSION
The effects of substitutions that alter the presence and placement of the 2-amino group in the minor groove on the binding of the antibiotics distamycin and mithramycin can be simply explained in terms of changes in the geometry of the minor groove surface affecting the complementarity of the drug–DNA interface and hence direct recognition.
By contrast, it is striking that these same modifications have the same qualitative effect on HMG-D binding as they do on the binding of FIS, a DNA-bending protein that binds in the major groove (39). This parallel is consistent with the notion that the dominant influence of the nucleotide substitutions on the binding of these proteins is via an effect on DNA bendability. Indeed the G → I substitution, which would be expected to reduce sequence-specific recognition of TTG in the minor groove (7), significantly increases the affinity of HMG-D for DNA. A more compelling argument that exocyclic groups can affect the binding of the protein by altering DNA flexibility is provided by the observation that removal of the 5-methyl group of thymine from the major groove also results in enhanced HMG-D binding similar to that caused by removing the guanine 2-amino group from the minor groove. This effect of T → U substitution is observed both for cooperative binding and for binding to a single site. The HMG-domains of SRY and LEF-1 are structurally homologous to that of HMG-D (11) and do not contact the DNA bases within the major groove (11, 12). It is reasonable to assume that HMG-D binds to DNA in a similar manner to other HMG domains. If so the dT → dU substitution must affect HMG-D binding indirectly. The most likely explanation is that the effect is mediated by an enhancement of DNA flexibility. This could result from a weakening of the stacking interactions of A-U pairs with their neighbors arising from the loss of van der Waals contacts between the 5 methyl group of thymine and the C5 of the adjacent thymine in a TT step (40). Alternatively the bulk of the 5-methyl group could provide a steric barrier to the compression of the major groove consequent on the substantial bending induced by the HMG domain. The available evidence does not enable us to distinguish between these possibilities. However, we note that in the LEF-1–DNA complex the homologous TT step has a higher positive roll angle than flanking steps (12), which therefore suggests that the effect of replacing dT by dU may be directly related to the degree of induced bending.
We conclude that exocyclic groups of DNA can influence the binding of ligands both directly and indirectly depending on the precise mode of interaction of the ligand with the double helix.
Acknowledgments
The technical assistance of Dean Gentle is gratefully acknowledged. This work was supported by grants (to M.J.W.) from the Wellcome Trust, the Cancer Research Campaign, and the Association for International Cancer Research. C.B. thanks the Institut National de la Santé et de la Recherche Médicale and the Sir Halley Stewart Trust. D.P. was supported by a European Molecular Biology Organization fellowship.
Footnotes
The publication costs of this article were defrayed in part by page charge payment. This article must therefore be hereby marked “advertisement” in accordance with 18 U.S.C. §1734 solely to indicate this fact.
Abbreviation: DAP, 2,6-diaminopurine.
References
- 1.Seeman N C, Rosenberg J M, Rich A. Proc Natl Acad Sci USA. 1976;73:804–808. doi: 10.1073/pnas.73.3.804. [DOI] [PMC free article] [PubMed] [Google Scholar]
- 2.Zhurkin V B. FEBS Lett. 1983;158:293–297. doi: 10.1016/0014-5793(83)80598-5. [DOI] [PubMed] [Google Scholar]
- 3.Zhurkin V B. J Biomol Struct Dyn. 1985;2:785–804. doi: 10.1080/07391102.1985.10506324. [DOI] [PubMed] [Google Scholar]
- 4.Drew H R, Travers A A. J Mol Biol. 1985;186:773–790. doi: 10.1016/0022-2836(85)90396-1. [DOI] [PubMed] [Google Scholar]
- 5.Flaus A, Luger K, Tan S, Richmond T J. Proc Natl Acad Sci USA. 1996;93:1370–1375. doi: 10.1073/pnas.93.4.1370. [DOI] [PMC free article] [PubMed] [Google Scholar]
- 6.Sauer R T. Nature Struct Biol. 1995;2:7–9. doi: 10.1038/nsb0195-7. [DOI] [PubMed] [Google Scholar]
- 7.Travers A A. Nature Struct Biol. 1995;2:615–618. doi: 10.1038/nsb0895-615. [DOI] [PubMed] [Google Scholar]
- 8.Tomasz M. In: Molecular Aspects of Anticancer Drug–DNA Interactions. Neidle S, Waring M J, editors. Vol. 2. London: Macmillan; 1994. pp. 312–349. [Google Scholar]
- 9.Thurston D E. In: Molecular Aspects of Anticancer Drug–DNA Interactions. Neidle S, Waring M J, editors. Vol. 1. London: Macmillan; 1993. pp. 54–88. [Google Scholar]
- 10.Kopka M L, Goodsell D, Baikalov I, Grzeskowiak K, Cascio D, Dickerson R E. Biochemistry. 1994;33:13593–13610. doi: 10.1021/bi00250a011. [DOI] [PubMed] [Google Scholar]
- 11.Werner M H, Ruth J R, Gronenborn A M, Clore G M. Cell. 1995;81:705–714. doi: 10.1016/0092-8674(95)90532-4. [DOI] [PubMed] [Google Scholar]
- 12.Love J J, Li X, Case D A, Giese K, Grosschedl R, Wright P E. Nature (London) 1995;376:791–795. doi: 10.1038/376791a0. [DOI] [PubMed] [Google Scholar]
- 13.Bailly C, Waring M J. J Am Chem Soc. 1995;117:7311–7316. [Google Scholar]
- 14.Bailly C, Waring M J. Nucleic Acids Res. 1995;23:885–892. doi: 10.1093/nar/23.6.885. [DOI] [PMC free article] [PubMed] [Google Scholar]
- 15.Wagner C R, Hamana K, Elgin S C R. Mol Cell Biol. 1992;12:1915–1923. doi: 10.1128/mcb.12.5.1915. [DOI] [PMC free article] [PubMed] [Google Scholar]
- 16.Ner S S, Churchill M E A, Searles M A, Travers A A. Nucleic Acids Res. 1993;21:4369–4371. doi: 10.1093/nar/21.18.4369. [DOI] [PMC free article] [PubMed] [Google Scholar]
- 17.Churchill M E A, Jones D N M, Glaser T, Hefner H, Searles M A, Travers A A. EMBO J. 1995;14:1264–1275. doi: 10.1002/j.1460-2075.1995.tb07110.x. [DOI] [PMC free article] [PubMed] [Google Scholar]
- 18.Wolfe S A, Ferentz A E, Grantcharova V, Churchill M E A, Verdine G L. Chem Biol. 1995;2:213–221. doi: 10.1016/1074-5521(95)90271-6. [DOI] [PubMed] [Google Scholar]
- 19.Drew H R, Travers A A. Cell. 1984;37:491–502. doi: 10.1016/0092-8674(84)90379-9. [DOI] [PubMed] [Google Scholar]
- 20.Drew H R, Weeks J R, Travers A A. EMBO J. 1985;4:1025–1032. doi: 10.1002/j.1460-2075.1985.tb03734.x. [DOI] [PMC free article] [PubMed] [Google Scholar]
- 21.Low C M L, Drew H R, Waring M J. Nucleic Acids Res. 1984;12:4865–4879. doi: 10.1093/nar/12.12.4865. [DOI] [PMC free article] [PubMed] [Google Scholar]
- 22.Smith J M, Thomas D J. Comput Appl Biosci. 1990;6:93–99. doi: 10.1093/bioinformatics/6.2.93. [DOI] [PubMed] [Google Scholar]
- 23.Dabrowiak J C, Goodisman J. In: Chemistry and Physics of DNA–Ligand Interactions. Kallenbach N R, editor. Schenectady, NY: Adenine; 1989. pp. 143–174. [Google Scholar]
- 24.Sayers E W, Waring M J. Biochemistry. 1993;32:9094–9107. doi: 10.1021/bi00086a014. [DOI] [PubMed] [Google Scholar]
- 25.Bailly C, Hamy F, Waring M J. Biochemistry. 1996;35:1150–1161. doi: 10.1021/bi951696p. [DOI] [PubMed] [Google Scholar]
- 26.Van Dyke M W, Dervan P B. Biochemistry. 1983;22:2373–2377. doi: 10.1021/bi00279a011. [DOI] [PubMed] [Google Scholar]
- 27.Van Dyke M W, Hertzberg R P, Dervan P B. Proc Natl Acad Sci USA. 1983;79:5470–5474. doi: 10.1073/pnas.79.18.5470. [DOI] [PMC free article] [PubMed] [Google Scholar]
- 28.Portugal J, Waring M J. Eur J Biochem. 1987;167:281–289. doi: 10.1111/j.1432-1033.1987.tb13334.x. [DOI] [PubMed] [Google Scholar]
- 29.Stankus A, Goodisman J, Dabrowiak J C. Biochemistry. 1992;31:9310–9318. doi: 10.1021/bi00153a026. [DOI] [PubMed] [Google Scholar]
- 30.Klevit R E, Wemmer D E, Reid B R. Biochemistry. 1986;25:3296–3303. doi: 10.1021/bi00359a032. [DOI] [PubMed] [Google Scholar]
- 31.Coll M, Frederick C A, Wang A H J, Rich A. Proc Natl Acad Sci USA. 1987;84:8385–8389. doi: 10.1073/pnas.84.23.8385. [DOI] [PMC free article] [PubMed] [Google Scholar]
- 32.Pelton J G, Wemmer D E. J Am Chem Soc. 1990;112:1393–1399. [Google Scholar]
- 33.Kopka M L, Larsen T A. In: Nucleic Acid Targeted Drug Design. Propst C L, Perun T J, editors. New York: Dekker; 1992. pp. 303–374. [Google Scholar]
- 34.Goodsell D, Kopka M L, Dickerson R E. Biochemistry. 1995;34:4983–4993. doi: 10.1021/bi00015a009. [DOI] [PubMed] [Google Scholar]
- 35.Keniry M A, Banville D L, Simmonds P M, Shafer R. J Mol Biol. 1993;231:753–767. doi: 10.1006/jmbi.1993.1324. [DOI] [PubMed] [Google Scholar]
- 36.Sastry M, Patel D J. Biochemistry. 1993;32:6588–6604. doi: 10.1021/bi00077a012. [DOI] [PubMed] [Google Scholar]
- 37.Kopka M L, Yoon C, Goodsell D, Pjura P, Dickerson R E. Proc Natl Acad Sci USA. 1985;82:1376–1380. doi: 10.1073/pnas.82.5.1376. [DOI] [PMC free article] [PubMed] [Google Scholar]
- 38.Chow C S, Whitehead J P, Lippard S J. Biochemistry. 1994;33:15124–15130. doi: 10.1021/bi00254a023. [DOI] [PubMed] [Google Scholar]
- 39.Bailly C, Waring M J, Travers A A. J Mol Biol. 1995;253:1–7. doi: 10.1006/jmbi.1995.0530. [DOI] [PubMed] [Google Scholar]
- 40.Nelson H C M, Finch J T, Luisi B F, Klug A. Nature (London) 1987;330:221–226. doi: 10.1038/330221a0. [DOI] [PubMed] [Google Scholar]