

Abstract
Superoxide promotes hydroxyl-radical formation and consequent DNA damage in cells of all types. The long-standing hypothesis that it primarily does so by delivering electrons to adventitious iron on DNA was refuted by recent studies in Escherichia coli. Alternative proposals have suggested that superoxide may accelerate oxidative DNA damage by leaching iron from storage proteins or enzymic [4Fe-4S] clusters. The released iron might then deposit on the surface of the DNA, where it could catalyze the formation of DNA oxidants using other electron donors. The latter model is affirmed by the experiments described here. Whole-cell electron paramagnetic resonance demonstrated that the level of loose iron in superoxide-stressed cells greatly exceeds that of unstressed cells. Bacterial iron storage proteins were not the major source for free iron, since superoxide also increased iron levels in mutants lacking these iron storage proteins. However, overproduction of an enzyme containing a labile [4Fe-4S] cluster dramatically increased the free iron content of cells when they were growing in air. The rates of spontaneous mutagenesis and DNA damage from exogenous H2O2 increased commensurately. It is striking that both growth defects and DNA damage caused by superoxide ensue from its ability to damage a subset of iron–sulfur clusters.
Keywords: hydrogen peroxide, Fenton reaction, oxidative stress, hydroxyl radical, oxygen toxicity
Superoxide ( ), a by-product of
aerobic metabolism, has been implicated in the production of oxidative
DNA damage. Many redox-cycling drugs that generate
), a by-product of
aerobic metabolism, has been implicated in the production of oxidative
DNA damage. Many redox-cycling drugs that generate
 are mutagenic
to mammalian and bacterial cells (ref. 1, reviewed in refs. 2, 3, 4, 5).
Furthermore, mutants of Escherichia coli that lack cytosolic
superoxide dismutase (SOD) exhibit a high rate of aerobic mutagenesis
(6), and SOD-deficient strains with attenuated DNA-repair systems
cannot grow in air at all (7, 8).
are mutagenic
to mammalian and bacterial cells (ref. 1, reviewed in refs. 2, 3, 4, 5).
Furthermore, mutants of Escherichia coli that lack cytosolic
superoxide dismutase (SOD) exhibit a high rate of aerobic mutagenesis
(6), and SOD-deficient strains with attenuated DNA-repair systems
cannot grow in air at all (7, 8).
Although  is
chemically incapable of damaging DNA directly (9, 10), it is thought to
do so indirectly by participating in the production of hydroxyl
radicals (OH·) (11). A long-standing proposal is that
is
chemically incapable of damaging DNA directly (9, 10), it is thought to
do so indirectly by participating in the production of hydroxyl
radicals (OH·) (11). A long-standing proposal is that
 serves as a
reductant for iron that is adventitiously bound to DNA (12). Subsequent
oxidation of the iron by hydrogen peroxide
(H2O2) generates the hydroxyl radical, a
powerful oxidant that attacks the adjacent DNA.
serves as a
reductant for iron that is adventitiously bound to DNA (12). Subsequent
oxidation of the iron by hydrogen peroxide
(H2O2) generates the hydroxyl radical, a
powerful oxidant that attacks the adjacent DNA.
 |
1 |
 |
2 |
This mechanism has been confirmed to occur in model systems in vitro (9, 10). It is also supported by the marked sensitivity of E. coli SOD mutants to killing by exogenous H2O2 (13, 14).
However, other observations conflict with this scheme. In the in
vitro systems, the
 concentration
needed to rapidly reduce iron exceeded by several orders of magnitude
its estimated intracellular concentration (8, 15). More abundant
intracellular reductants, including NADH and glutathione, can also
reduce iron in vitro (16, 17), and some evidence indicates
that they do so in vivo as well (18). Finally, recent
experiments with E. coli SOD− mutants
demonstrated that their sensitivity to oxidative DNA damage persisted
for a substantial period after the
concentration
needed to rapidly reduce iron exceeded by several orders of magnitude
its estimated intracellular concentration (8, 15). More abundant
intracellular reductants, including NADH and glutathione, can also
reduce iron in vitro (16, 17), and some evidence indicates
that they do so in vivo as well (18). Finally, recent
experiments with E. coli SOD− mutants
demonstrated that their sensitivity to oxidative DNA damage persisted
for a substantial period after the
 had been
removed (8). This result contradicted the standard model and indicated
that
had been
removed (8). This result contradicted the standard model and indicated
that  must play
some other role in producing damage.
must play
some other role in producing damage.
Concerns such as these have prompted the development of other
hypotheses. Aust et al. (19) demonstrated that
 can release
iron from ferritin in vitro and suggested that similar
behavior in vivo could provide free iron to catalyze the
peroxidation of cell membranes. If so, by extension, ferritin
degradation could facilitate DNA damage as well, since iron overload
has been shown to accelerate oxidative DNA damage in both mammalian and
bacterial cells (7, 20). More-recent work has established that several
of the characteristic growth deficiencies of SOD mutants arise from the
inactivation of a subset of dehydratases containing [4Fe-4S] clusters
(21, 22, 23, 24, 25).
can release
iron from ferritin in vitro and suggested that similar
behavior in vivo could provide free iron to catalyze the
peroxidation of cell membranes. If so, by extension, ferritin
degradation could facilitate DNA damage as well, since iron overload
has been shown to accelerate oxidative DNA damage in both mammalian and
bacterial cells (7, 20). More-recent work has established that several
of the characteristic growth deficiencies of SOD mutants arise from the
inactivation of a subset of dehydratases containing [4Fe-4S] clusters
(21, 22, 23, 24, 25).  oxidizes the clusters, precipitating the release of one or more iron
atoms. Flint and Emptage (26) suggested that the released iron could
immediately act as a Fenton catalyst, possibly further damaging the
dehydratase. However, as Liochev and Fridovich have noted (27), the
released iron could also more generally participate in Fenton reactions
throughout the cell, including along the surface of DNA.
oxidizes the clusters, precipitating the release of one or more iron
atoms. Flint and Emptage (26) suggested that the released iron could
immediately act as a Fenton catalyst, possibly further damaging the
dehydratase. However, as Liochev and Fridovich have noted (27), the
released iron could also more generally participate in Fenton reactions
throughout the cell, including along the surface of DNA.
The question addressed here is whether
 releases enough
iron from either ferritins or dehydratases to substantially elevate the
free-iron pool and thereby account for the acceleration of DNA damage.
The data indicate that the genotoxic effects of
releases enough
iron from either ferritins or dehydratases to substantially elevate the
free-iron pool and thereby account for the acceleration of DNA damage.
The data indicate that the genotoxic effects of
 indeed result
from the iron that it releases from [4Fe-4S] clusters.
indeed result
from the iron that it releases from [4Fe-4S] clusters.
MATERIALS AND METHODS
Reagents.
Diethylenetriaminepentaacetic acid (DETAPAC), deferoxamine mesylate (desferrioxamine), paraquat (methyl viologen), ampicillin, isopropyl β-d-thiogalactopyranoside (IPTG), o-nitrophenyl-β-d-galactopyranoside (ONPG), spectinomycin, kanamycin, trimethoprim, thymine, casamino acids (acid hydrolysate), bromthymol blue (BTB), NADH, rabbit muscle lactic dehydrogenase, 6-phosphogluconate, gluconic acid, and hydrogen peroxide [30% (wt/vol)] were purchased from Sigma. Phosphorylated EcoRI linkers were from New England Biolabs. Coomassie protein assay reagent was purchased from Pierce. Water for experiments was purified by a Labonco Water Pro PS system.
Media and Cell Growth.
Cultures were routinely maintained in Luria–Bertani (LB) glucose medium containing 10 g tryptone, 5 g yeast extract, and 10 g NaCl per liter supplemented with 0.2% glucose (28). Some cultures were grown in minimal A media (28) supplemented with 0.2% glucose, 0.25% casamino acids, 5 mg/liter thiamine, and 0.5 mM tryptophan. Anaerobic cultures were maintained in a Coy anaerobic chamber under 85% N2/10% H2/5% CO2. Plates and media were moved into the chamber while hot and allowed to equilibrate for at least 1 day prior to use. Plasmids were maintained with 12 μg/ml tetracycline or 100 μg/ml ampicillin. Where indicated, 1 mM IPTG was included. Transductions were performed in minimal A media supplemented with 125 μg/ml spectinomycin, 50 μg/ml kanamycin, or 12 μg/ml tetracycline as required. BTB gluconate indicator plates (29) contained 2.5 g protease peptone no. 3, 1.5 g yeast extract, 10 g CaCO3, 50 mg BTB, 15 g agar, and 10 g sodium gluconate.
Strain Construction.
Strains used are described in Table 1. P1 transduction was performed by standard methods (28). These strains were constructed and maintained anaerobically until it was determined that they were stable in air. Plasmid pKK3, overproducing 6-phosphogluconate dehydratase from a tac promoter, was constructed from pBN44, which contains the “zwf-eda” operon fragment, including the intact edd gene flanked by an untranslated C-terminal fragment of zwf and an N-terminal fragment of eda (32). The HindIII–EcoRI fragment was excised and, after addition of EcoRI linkers, ligated into the EcoRI site of pCKR101 (33). The plasmid was then transformed into an edd− strain and selected with ampicillin. The resulting transformants were screened on BTB gluconate plates, where the presence of 6-phosphogluconate dehydratase produces yellow colonies (29).
Table 1.
Strains and plasmids used in this study
| Strain or plasmid | Genotype | Source or ref. |
|---|---|---|
| Strains | ||
| AB1157 | F−thr-1 leuB6 proA2 his-4 thi-1 argE2 lacY1 galK2 | 14 |
| rpsL supE44 ara-14 xyl-15 mtl-1 tsx-33 | ||
| JI132 | As AB1157 plus (sodA::Mud PR13)25(sodB::kan)1-Δ2 | 14 |
| BN407 | As A1157 plus ΔlacU169 and ColV-K30 (iucC::lacZ) | 30 |
| HB351 | F− Δ(argF-lac)169 Δ(edd-zwf)22 zeb-1::Tn10 | 31 |
| JRG2953 | As W3110 plus bfr::kan ftn::spec | John Guest |
| KK204 | As AB1157 plus fur::Tn5 | 8 |
| KK206 | As AB1157 plus bfr::kan ftn::spec | P1(JRG2953) × AB1157 |
| KK209 | As JI132 plus bfr::kan ftn::spec | P1(JRG2953) × JI132 |
| KK216 | As JI132 plus fur::Tn5 zbf-507::Tn10 | 8 |
| KK222 | As JI132 plus Δ(edd-zwf)22 zeb-1::Tn10 | P1(HB351) × JI132 |
| KK226 | As AB1157 plus Δ(edd-zwf)22 zeb-1::Tn10 | P1(HB351) × AB1157 |
| KK230 | As KK226 plus pKK3 | This study |
| KK231 | As KK222 plus pKK3 | This study |
| KK260 | As KK226 plus pCKR101 | This study |
| KK261 | As BN407 plus pKK3 | This study |
| KK266 | As KK222 plus pKK3 | This study |
| Plasmids | ||
| pBN44 | pUC18 derivative containing zwf-eda | 32 |
| pCKR101 | pBR328-derived vector containing lacIq and Ptac | Jeff Gardner |
| pKK3 | pCKR101 containing zwf-eda | This study |
Killing by H2O2.
Killing with 2.5 mM H2O2 was performed as described (34). Briefly, strains were grown in minimal A/casamino acids media for 3–4 generations to an OD600 of 0.1. These logarithmic-phase cells were then challenged with 2.5 mM H2O2. Aliquots were removed at intervals, diluted into LB/glucose medium, immediately plated in top agar onto LB/glucose plates, and incubated at 37°C overnight. Control experiments showed that the use of top agar does not affect cell survival. Killing by H2O2 was assessed as the percent of surviving colonies compared with unchallenged cells.
Whole-Cell EPR Spectroscopy.
The protocol was derived from the EPR assay for iron in cell extracts devised by Yegorov et al. (35). Cells were aerobically grown in 2–3 liters of minimal A medium containing 0.2% glucose, 5 mg/liter thiamine, 0.25% casamino acids, and 0.5 mM tryptophan to 0.1–0.2 OD600. Cells were then centrifuged at 7800 × g at room temperature and concentrated 200–300-fold prior to a 15-minute incubation in the same 37°C medium containing 20 mM desferrioxamine. The cells were then centrifuged, washed with cold 20 mM Tris (pH 7.4), resuspended in a final volume of 0.2–1.0 ml Tris/10% glycerol, and frozen in 3-mm quartz tubes on dry ice. Samples were stored at −78°C for EPR analysis. The EPR signals were measured with a Varian Century Series E-112 X-band spectrometer equipped with a Varian TE102 cavity and a Varian temperature controller. Temperature was measured with a T-type thermocouple fixed next to the sample and an Omega Engineering (Stamford, CT) 670/680 microprocessor-based thermocouple meter. Data were analyzed using software provided by Scientific Software Services (Bloomington, IL). Iron levels were quantitated by normalizing the amplitude of the iron signal to iron standards, and internal concentrations were calculated using the intracellular volume (15).
Aerobic and Anaerobic Mutagenesis.
Mutagenesis was measured by quantifying the forward mutation of the thyA gene (28). The strains used were streaked from freezer stocks onto anaerobic plates to avoid any exposure to oxygen prior to each experiment. Cultures were grown from single colonies to mid-logarithmic phase anaerobically in minimal A-casamino acids medium containing 0.1 mg/ml thymine. The cells were then subcultured into the same medium and exposed to air for 4–5 hr. To maintain the cells in exponential phase, they were subcultured as necessary during this period so that the culture density was never greater than 6 × 10⁷ colony-forming units/ml. Cultures were then diluted and plated in top agar anaerobically onto minimal A-casamino acid plates containing 0.1 mg/ml thymine and 0.1 mg/ml trimethoprim to allow outgrowth of thyA mutants. Cell viability was simultaneously quantitated on plates lacking trimethoprim. Anaerobic mutagenesis was determined by the same protocol except that cultures were not shifted into air.
Biochemical Assays.
Assays for 6-phosphogluconate dehydratase were performed using a two-step reaction (36). In the first step, 6-phosphogluconate dehydratase activity is rate-limiting for the conversion of 6-phosphogluconate into pyruvate; in the second step, the pyruvate is assayed using lactate dehydrogenase. Extract, 8 mM 6-phosphogluconate, 10 mM MgCl2, and 50 mM Tris (pH 7.65) were incubated in a 0.1-ml reaction for 5 min at room temperature. The reaction was stopped by dilution into 2 ml of 50 mM Tris (pH 7.65) with subsequent boiling for 2 min in a water bath. The sample was then centrifuged to remove particulates, and the amount of pyruvate in the supernatant was assayed with NADH and lactic dehydrogenase. One unit of 6-phosphogluconate dehydratase activity catalyzed the formation of 1 μmol pyruvate per minute. β-galactosidase activity was assayed according to Miller (28). The total protein content of cell extracts was quantitated with a Coomassie stain-based assay from Pierce.
RESULTS
Loosely Bound Iron Can Be Detected in Whole Cells by EPR.
Our
initial goal was to determine whether the amount of free iron is
elevated in cells stressed by  . We
first attempted to measure intracellular free iron using established
protocols. An E. coli Fur− mutant was used as a
positive control. This mutant lacks the global iron repressor protein
and constitutively imports iron (37); its hypersensitivity to oxidative
DNA damage presumably reflects an excessive internal free-iron
concentration (7, 8). Measurements of total acid-soluble non-heme iron
(38) could not distinguish between the enlarged iron pool of the
Fur− mutant and that of the wild-type cells (data not
shown); measured iron levels varied inconsistently between 300–500
μM for each. These values include iron lost from proteins upon cell
disruption or exposure to acid, and those spurious iron sources
apparently obscured differences in the smaller genuine free-iron pools.
Other spectrophotometric assays of chelatable iron in cell extracts
(35) produced similar results (data not shown).
. We
first attempted to measure intracellular free iron using established
protocols. An E. coli Fur− mutant was used as a
positive control. This mutant lacks the global iron repressor protein
and constitutively imports iron (37); its hypersensitivity to oxidative
DNA damage presumably reflects an excessive internal free-iron
concentration (7, 8). Measurements of total acid-soluble non-heme iron
(38) could not distinguish between the enlarged iron pool of the
Fur− mutant and that of the wild-type cells (data not
shown); measured iron levels varied inconsistently between 300–500
μM for each. These values include iron lost from proteins upon cell
disruption or exposure to acid, and those spurious iron sources
apparently obscured differences in the smaller genuine free-iron pools.
Other spectrophotometric assays of chelatable iron in cell extracts
(35) produced similar results (data not shown).
An alternative strategy was developed to measure free iron inside unbroken cells. The intracellular free iron pool may be a mixture of both iron(II) and iron(III) (35). Although both species are paramagnetic, iron(III) is much more easily detected by EPR spectroscopy because of its sharper signal. It was therefore useful to use a cell-permeable iron chelator that would convert all the free iron to the iron(III) form for EPR detection. Desferrioxamine is an iron chelator that binds free iron(III) and, in the presence of of oxygen, both binds and promotes the oxidation of iron(II). The resultant iron(III) chelates exhibit an iron(III) EPR signal with g = 4.3. Protein-bound iron does not resonate at this g value. Previous studies demonstrated that desferrioxamine enters E. coli and avidly binds the intracellular iron that can catalyze DNA damage (8, 18, 39). In particular, pre-incubation of E. coli with 20 mM desferrioxamine completely blocks DNA damage by subsequent doses of H2O2. Importantly, although desferrioxamine chelates free iron, it appears not to remove iron from proteins. For example, whereas 6-phosphogluconate dehydratase requires an intact [4Fe-4S] cluster for its biochemical activity, it lost none of its activity when incubated anaerobically with desferrioxamine in vitro (data not shown). Thus, we anticipated that the desferrioxamine–EPR assay would be specific enough to detect free iron without disrupting metalloproteins.
The amplitude of the desferrioxamine:iron EPR first-derivative signal was directly proportional to the concentration of purified iron in vitro (not shown). To test whether free iron could be detected in vivo, samples of the Fur− mutant and its wild-type parent were prepared for EPR analysis. Wild-type cells exhibited a small signal, equivalent to 10 μM Fe, which agrees with the estimated affinity for iron of the regulatory protein, Fur (≈10−5 M) (30) (Fig. 1). The Fur− mutant produced an iron signal seven times as intense (Fig. 1). The signal intensity was proportional to the concentration of cells in the sample (data not shown).
Figure 1.
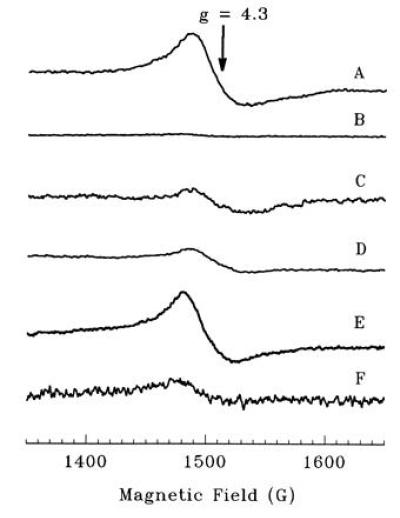
Iron EPR signals from whole-cell preparations. EPR parameters were: T = −125°C, field center = 1520 G, field sweep = 500 G, modulation amplitude = 25 G, receiver gain = 32,000, frequency = 9.006 GHz, and power = 30 mW. One thousand data points were collected per scan, and four scans were averaged per sample. Scan profiles for samples B–F have been normalized to cell concentration. Scans: A, iron standard; B, AB1157 (wild type), 10 μM intracellular chelatable iron; C, KK204 (Fur−), 70 μM iron; D, JI132 (SOD−), 80 μM iron; E, KK216 (SOD− Fur−), 160 μM iron; F, same AB1157 scan as B with 13-fold amplification of signal.
In a control experiment to ensure that the detected free iron originated from inside the cell and that external iron was not adventitiously internalized with the chelator, cells were incubated with the extracellular iron chelator, DETAPAC, prior to the addition of desferrioxamine. DETAPAC should sequester extracellular iron and be removed by the cell washes, preventing its transfer into the cell by desferrioxamine. The DETAPAC exposure did not diminish the EPR signal, confirming that the iron producing the EPR signal was from an intracellular source.
Superoxide Increases Intracellular Free Iron.
This method was
then applied to test whether superoxide increases the amount of free
iron. The EPR signal of an SOD− mutant was increased
8-fold over that of an SOD-proficient strain, to an internal iron
concentration of 80 μM (Fig. 1). Similarly, the iron EPR signal of an
SOD-proficient strain grown in the presence of the
superoxide-generating drug, paraquat, was substantially enhanced (Fig.
2). Both of these results indicate that
 increased the amount of free iron
inside the cell.
increased the amount of free iron
inside the cell.
Figure 2.
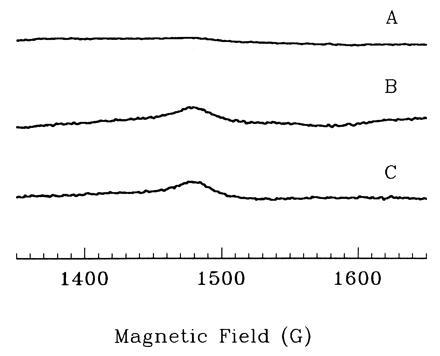
Effect of 6-phosphogluconate dehydratase overproduction or exposure to paraquat upon the EPR signals of SOD-proficient cells. Assay conditions were similar to those described in Fig. 1, except: power = 50 mW, modulation amplitude = 16 G, and receiver gain = 20,000. Scans: A, wild-type cells (AB1157), 10 μM intracellular free iron; B, 6-phosphogluconate dehydratase overproducer (KK230), 35 μM iron; C, AB1157 during exposure to 200 μM paraquat, 40 μM iron. This concentration of paraquat was just sufficient to reduce the rate of growth by about 50%.
The intensity of the EPR signal of an SOD− Fur− mutant was approximately equal to the sum of the signals of SOD− or Fur− mutants alone (Fig. 1). SOD and Fur deficiencies apparently overload the cell with iron by independent mechanisms: the Fur regulon remains repressed under these growth conditions in an SOD− mutant, as in wild-type cells (8). Importantly, the increase in the free-iron content of these strains compared with wild-type strains paralleled their increased susceptibility to DNA damage by H2O2 (Fig. 3).
Figure 3.
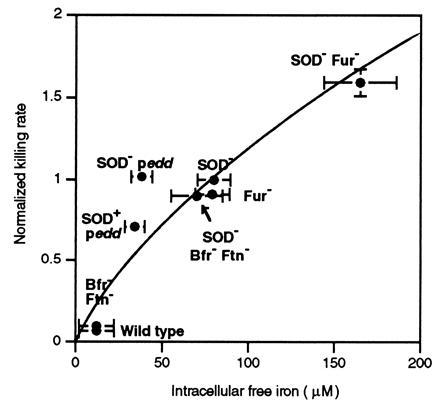
Relationship between internal iron concentration and sensitivity to killing by H2O2. Cell concentrates of the congenic strains AB1157 (wild type), JI132 (SOD−), KK204 (Fur−), KK206 (bfr ftn), KK209 (SOD- bfr ftn), KK216 (SOD− Fur−), KK230 (SOD+ Edd overproducer), and KK231 (SOD− Edd overproducer) were grown aerobically and assayed for internal iron by EPR. The sensitivity of the exponentially growing cultures to killing by exogenous H2O2 was determined after 8 min of exposure to 2.5 mM H2O2 in the same medium (8); other work has shown that the consequent cell death is due to iron-catalyzed DNA damage (52). Killing rates [-Ln(surviving fraction)/8] have been normalized to that of JI132 (8% survival). Error bars signify standard deviations of at least four independent experiments.
It is interesting to note that in the SOD− Fur− strain a small g = 4.3 iron signal was visible even in the absence of chelator, suggestive of a small pool of iron (III), but was greatly enhanced by the addition of desferrioxamine (data not shown). This result confirms that most of the intracellular free iron was in the ferrous state and only appeared as ferric iron after its oxidation was promoted by the chelator. Indeed, others had previously speculated that most intracellular free iron is reduced (30).
Iron Storage Proteins Are Not the Major Source for Free Iron in E. coli.
It has been noted that
 can reductively leach iron from
storage proteins (41, 42, 43), although others have predicted that the rate
may be too slight to have any physiological impact (44). E.
coli contains two such proteins, bacterioferritin (encoded by
bfr) and ferritin (ftn) (45, 46), which
are structurally homologous to mammalian ferritins (47, 48). Mutants
lacking these two iron-storage proteins exhibited the same minimal EPR
signal, and the same sensitivity to exogenous
H2O2, as did wild-type cells (Fig. 3).
Importantly, the addition of SOD mutations to the storage-deficient
strains resulted in elevated EPR signals and hypersensitivity to
H2O2, as were seen in SOD−
storage-proficient strains (Fig. 3). These data demonstrated that these
bacterial ferritins are not the primary sources of the free iron found
in E. coli cells stressed by
can reductively leach iron from
storage proteins (41, 42, 43), although others have predicted that the rate
may be too slight to have any physiological impact (44). E.
coli contains two such proteins, bacterioferritin (encoded by
bfr) and ferritin (ftn) (45, 46), which
are structurally homologous to mammalian ferritins (47, 48). Mutants
lacking these two iron-storage proteins exhibited the same minimal EPR
signal, and the same sensitivity to exogenous
H2O2, as did wild-type cells (Fig. 3).
Importantly, the addition of SOD mutations to the storage-deficient
strains resulted in elevated EPR signals and hypersensitivity to
H2O2, as were seen in SOD−
storage-proficient strains (Fig. 3). These data demonstrated that these
bacterial ferritins are not the primary sources of the free iron found
in E. coli cells stressed by
 .
.
Superoxide Liberates Free Iron from Enzymic [4Fe-4S] Clusters.
Superoxide rapidly excises iron from a family of
dehydratases that contain [4Fe-4S] clusters. These clusters include a
solvent-accessible iron atom, which acts as a Lewis acid during
substrate dehydration. The exposed iron atom is vulnerable to oxidation
and release by oxidants such as  .
During oxidation reactions in vitro, release of the first
iron atom can be followed by disintegration of the cluster (21, 49); it
is not known whether the complete cluster is lost in vivo.
In E. coli, the clusters of dihydroxy acid dehydratase,
aconitase, 6-phosphogluconate dehydratase, and fumarases A and B are
rapidly destroyed by
.
During oxidation reactions in vitro, release of the first
iron atom can be followed by disintegration of the cluster (21, 49); it
is not known whether the complete cluster is lost in vivo.
In E. coli, the clusters of dihydroxy acid dehydratase,
aconitase, 6-phosphogluconate dehydratase, and fumarases A and B are
rapidly destroyed by  (21, 22, 23, 24, 25, 26). It
was not feasible to remove the structural genes of all of these
enzymes, so we instead overproduced one of them to test whether the
rate of DNA damage and the amount of free iron would increase
commensurately. 6-phosphogluconate dehydratase (Edd, encoded by edd) was selected for overproduction because its synthesis does
not present metabolic problems for cells when they are grown on
glucose. This enzyme catalyzes a step in the Entner–Doudoroff
fermentative pathway and is active only when gluconate is used as a
carbon source (50).
(21, 22, 23, 24, 25, 26). It
was not feasible to remove the structural genes of all of these
enzymes, so we instead overproduced one of them to test whether the
rate of DNA damage and the amount of free iron would increase
commensurately. 6-phosphogluconate dehydratase (Edd, encoded by edd) was selected for overproduction because its synthesis does
not present metabolic problems for cells when they are grown on
glucose. This enzyme catalyzes a step in the Entner–Doudoroff
fermentative pathway and is active only when gluconate is used as a
carbon source (50).
The edd gene was cloned behind the strong tac promoter onto a medium copy vector, and this plasmid was transformed into both wild-type and SOD-deficient strains. Strains containing the overproducing plasmid contained 0.8 unit of activity, an 8-fold increase from activity of the enzyme in a wild-type cell grown on gluconate.
Strikingly, overproduction of 6-phosphogluconate dehydratase intensified the iron EPR signal even of SOD-proficient cells (Fig. 2), indicating that the high cluster content caused an increase in the amount of free iron. Accordingly, the overproduction also greatly increased the rate at which exogenous H2O2 killed the aerobic cells (Fig. 3). Anaerobic cultures were not sensitized, indicating that the increase in free iron derived specifically from the oxidative lability of the dehydratase (data not shown).
To ensure that these phenotypes were not due to any metabolic activity of the overexpressed dehydratase the experiment was repeated in a genetic background lacking zwf, the structural gene for glucose-6-phosphate dehydrogenase. The absence of this enzyme prevents the formation in vivo of 6-phosphogluconate, the substrate of the dehydratase. Still, dehydratase overproduction dramatically increased the free-iron signal and sensitized the strain to DNA damage by H2O2.
Other experiments demonstrated that this increase in free iron was from destruction of the cluster and not from the derepression of the Fur regulon. A colV plasmid containing an iucC::lacZ fusion was mated into this strain, and β-galactosidase activity was compared with that of a wild-type strain. iucC is part of the aerobactin iron uptake operon that is regulated by Fur (30); an increase in β-galactosidase activity would indicate the derepression of Fur. Fur remained repressed in this strain. Thus, the increase in internal iron was not due to an acceleration of iron uptake. It is apparent that a sufficient amount of iron can spill from oxidatively labile iron–sulfur clusters to threaten cell fitness.
We initially anticipated that the free-iron content and H2O2 sensitivity of a strain that both lacked SOD and overproduced Edd would substantially exceed that of either an SOD− mutant or an SOD+ overproducer, but that was not the case (Fig. 3). To ensure that a suppressor mutation was not interfering, the strain was reconstructed anaerobically with similar results. The explanation we favor is that in SOD− mutants the re-assembly of [4Fe-4S] clusters by endogenous repair processes (40, 51) is continually outpaced by their rapid oxidative destruction. In this situation, the flux of iron being leached from dehydratases is limited by the rate at which the clusters are rebuilt. It is clear that the superoxide concentration inside SOD− mutants is so high that virtually all of the dehydratases are in the apoenzyme form, presumably saturating the cluster-assembly process. We have determined, for example, that 90–95% of chromosomally encoded 6-phosphogluconate dehydratase proteins are inactive in an SOD mutant. The addition of paraquat does not further increase the amount of free iron (data not shown), confirming that the slow step in the iron-release cycle is cluster reassembly rather than cluster oxidation. Because the cluster-assembly process is overwhelmed, the engineered overproduction of apodehydratase should not increase the rate at which clusters are assembled—nor, hence, the rate at which iron is subsequently knocked out. In fact, because the damaged dehydratases may retain partial clusters even in an oxidizing environment (49), it may be understandable that their overexpression even slightly diminishes the pool of free iron (Fig. 3). In contrast, in an SOD-proficient cell the rate of iron release is limited by the rate of cluster destruction, which is slow, due to the far smaller concentration of ambient superoxide. In that case, the dehydratases are predominantly metallated, and dehydratase overproduction should cause a proportionate increase in the flux of iron release. It will be necessary to modulate both oxidative stress and cluster assembly to adequately test this idea. We also note that interpretation of the behavior of the SOD− strain that overproduces Edd is clouded by its poor growth in air, which may affect other aspects of the iron-metabolism and DNA-damage processes.
Excess Free Iron Increases the Potential for Oxidative DNA Damage.
Comparison of these various strains indicated a positive correlation between the amount of free iron and their susceptibility to killing by exogenous H2O2 (Fig. 3). Other studies have established that this killing is due to oxidative DNA damage (8, 52). H2O2 is only mildly genotoxic in wild-type strains, which contain only small amounts of chelable iron. Iron levels were 7- to 8-fold higher in SOD− and Fur− mutants; killing rates were 8- to 10-fold higher. Finally, the 17-fold increase in chelatable iron in the Fur− SOD− double mutant was matched by an equivalent increase in H2O2 sensitivity. Those results strongly support the idea that the free iron measured in the EPR assay is responsible for catalyzing the formation of DNA-damaging oxidants.
H2O2 is also produced by autoxidation of metabolic enzymes, and the mutagenic potential of endogenous H2O2 (53, 54) is probably the primary reason that cells carefully regulate their free-iron content. Touati and colleagues have shown that Fur− and SOD− mutants suffer high rates of mutation in air (6, 7), which is consistent with their elevated free-iron content. Similarly, the increase in free iron that ensued from overproduction of 6-phosphogluconate dehydratase was matched by a high rate of aerobic mutagenesis (Fig. 4).
Figure 4.
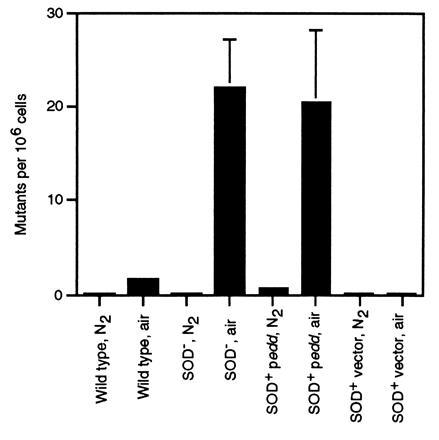
Aerobic and anaerobic mutagenesis using trimethoprim. Error bars represent standard deviations from at least three experiments.
DISCUSSION
These data support three main conclusions: (i)
Intracellular  causes an increase
in the internal pool of free iron. (ii) The excess iron is
not primarily leached from storage proteins. Instead, it probably
evolves from the [4Fe-4S] clusters of a subclass of damaged
dehydratases. (iii) The elevation in free iron greatly
increases the rates at which either exogenous or endogenous
H2O2 damages DNA.
causes an increase
in the internal pool of free iron. (ii) The excess iron is
not primarily leached from storage proteins. Instead, it probably
evolves from the [4Fe-4S] clusters of a subclass of damaged
dehydratases. (iii) The elevation in free iron greatly
increases the rates at which either exogenous or endogenous
H2O2 damages DNA.
This information supersedes the long-standing Haber–Weiss scheme,
which suggested that  stimulated
HO· production by acting as the rate-limiting electron
donor for a pre-existing pool of free iron. That scheme was
conceptually troubled by the limited amount of
stimulated
HO· production by acting as the rate-limiting electron
donor for a pre-existing pool of free iron. That scheme was
conceptually troubled by the limited amount of
 present inside cells, and it has
been experimentally contradicted by experiments conducted with
SOD-deficient E. coli (8).
present inside cells, and it has
been experimentally contradicted by experiments conducted with
SOD-deficient E. coli (8).
It is striking that both oxidative growth deficiencies and oxidative
mutagenesis arise from damage to this single class of dehydratase
proteins. This possibility was recognized when it became clear that
 releases iron from proteins (26,
27), and it seems likely that the impact is amplified by the continual
replacement of lost iron atoms by cluster-repair processes (40, 51,
55). The cycles of oxidation and repair can plausibly permit a single
dehydratase protein to release many iron atoms during a period of
oxidative stress.
releases iron from proteins (26,
27), and it seems likely that the impact is amplified by the continual
replacement of lost iron atoms by cluster-repair processes (40, 51,
55). The cycles of oxidation and repair can plausibly permit a single
dehydratase protein to release many iron atoms during a period of
oxidative stress.
The same sequelae to oxidative protein damage will probably occur in
mammalian cells. In particular, the juxtaposition in mitochondria of
respiratory dehydrogenases, which are the primary sources of
 (56), and TCA-cycle enzymes,
including the labile mitochondrial aconitase (21, 57), may cause an
unusually high free-iron concentration in that compartment. That
scenario could explain why damage accrues much more rapidly in
mitochondrial DNA than in nuclear DNA (58, 59, 60). Membrane damage,
another symptom of oxidative stress, may also result when iron is
leached from these clusters. While some of the spilled iron deposits on
the polyanionic nucleic acids and causes damage to them, other iron may
collect along the negatively charged lipid bilayer, where workers have
anticipated that it could promote lipid peroxidation (61). This
connection remains to be tested.
(56), and TCA-cycle enzymes,
including the labile mitochondrial aconitase (21, 57), may cause an
unusually high free-iron concentration in that compartment. That
scenario could explain why damage accrues much more rapidly in
mitochondrial DNA than in nuclear DNA (58, 59, 60). Membrane damage,
another symptom of oxidative stress, may also result when iron is
leached from these clusters. While some of the spilled iron deposits on
the polyanionic nucleic acids and causes damage to them, other iron may
collect along the negatively charged lipid bilayer, where workers have
anticipated that it could promote lipid peroxidation (61). This
connection remains to be tested.
Because the free-iron pool size determines the rate of oxidative DNA
damage, other factors that disturb iron homeostasis could also affect
the rate of mutagenesis and even cell death. Genetic hemochromatosis
and asbestosis, for example, are carcinogenic disorders whose effects
have been postulated to arise from iron-promoted DNA damage (20).
Importantly, iron overload can damage DNA even when
 concentrations are minimal, since
it is clear that some agent(s) other than
concentrations are minimal, since
it is clear that some agent(s) other than
 delivers the electrons to free
iron when it redox-cycles with H2O2 (8). An
important next step will be to identify the primary reductant; both
thiols and reduced dinucleotides are plausible candidates.
delivers the electrons to free
iron when it redox-cycles with H2O2 (8). An
important next step will be to identify the primary reductant; both
thiols and reduced dinucleotides are plausible candidates.
Iron pools also fluctuate in non-pathological circumstances. Among microbes intracellular iron pools can be influenced by the availability of environmental iron, although regulatory controls strive to keep them within narrow limits. Interestingly, iron levels in E. coli are permitted to rise during anaerobiosis, presumably because there is no threat of its reacting with endogenous H2O2 (8). In aerobic cells free-iron concentrations may increase when enzymes that contain labile clusters are induced in response to environmental cues—a situation potentially analogous to the engineered overproduction of Edd in this study. Aconitase, fumarase, and 6-phosphogluconate dehydratase are minimally synthesized in glucose medium, and their higher titers in other media may cause an increased rate of oxidative mutagenesis. It will also be interesting to see how oxygen-sensitive microbes that contain abundant labile clusters—such as those in nitrogenase—defend themselves against DNA damage during their periodic, transient exposures to air.
Acknowledgments
Strains and plasmids were generously provided by Paul Blum, Richard Wolf, and John Guest. We would like to thank Dr. Alex I. Smirnov, Tatyana I. Smirnova, and Prof. R. Linn Belford (University of Illinois) for assistance with the EPR experiments conducted at the Illinois EPR Research Center, a National Institutes of Health Biomedical Research Technology Resource (P41-RR01811). This study was supported by Grant CN-146 from the American Cancer Society.
Footnotes
The publication costs of this article were defrayed in part by page charge payment. This article must therefore be hereby marked “advertisement” in accordance with 18 U.S.C. §1734 solely to indicate this fact.
Abbreviation: SOD, superoxide dismutase.
References
- 1.Moody C S, Hassan H M. Proc Natl Acad Sci USA. 1982;79:2855–2859. doi: 10.1073/pnas.79.9.2855. [DOI] [PMC free article] [PubMed] [Google Scholar]
- 2.Cerutti P A. Science. 1985;227:375–381. doi: 10.1126/science.2981433. [DOI] [PubMed] [Google Scholar]
- 3.Sinha B K, Mimnaugh E G. Free Radical Biol Med. 1990;8:567–581. doi: 10.1016/0891-5849(90)90155-c. [DOI] [PubMed] [Google Scholar]
- 4.Powis G. Free Radical Biol Med. 1989;6:63–101. doi: 10.1016/0891-5849(89)90162-7. [DOI] [PubMed] [Google Scholar]
- 5.Brunmark A, Cadenas E. Free Radical Biol Med. 1989;7:435–477. doi: 10.1016/0891-5849(89)90126-3. [DOI] [PubMed] [Google Scholar]
- 6.Farr S B, D’Ari R, Touati D. Proc Natl Acad Sci USA. 1986;83:8268–8272. doi: 10.1073/pnas.83.21.8268. [DOI] [PMC free article] [PubMed] [Google Scholar]
- 7.Touati D, Jacques M, Tardat B, Bouchard L, Despied S. J Bacteriol. 1995;177:2305–2314. doi: 10.1128/jb.177.9.2305-2314.1995. [DOI] [PMC free article] [PubMed] [Google Scholar]
- 8.Keyer K, Gort A S, Imlay J A. J Bacteriol. 1995;177:6782–6790. doi: 10.1128/jb.177.23.6782-6790.1995. [DOI] [PMC free article] [PubMed] [Google Scholar]
- 9.Brawn K, Fridovich I. Arch Biochem Biophys. 1981;206:414–419. doi: 10.1016/0003-9861(81)90108-9. [DOI] [PubMed] [Google Scholar]
- 10.Lesko S A, Lorentzen R J, Ts’o P O P. Biochemistry. 1980;19:3023–3028. doi: 10.1021/bi00554a029. [DOI] [PubMed] [Google Scholar]
- 11.Beauchamp C, Fridovich I. J Biol Chem. 1970;245:5214–5222. [PubMed] [Google Scholar]
- 12.McCord J M, Day E D., Jr FEBS Lett. 1978;86:139–142. doi: 10.1016/0014-5793(78)80116-1. [DOI] [PubMed] [Google Scholar]
- 13.Carlioz A, Touati D. EMBO J. 1986;5:623–630. doi: 10.1002/j.1460-2075.1986.tb04256.x. [DOI] [PMC free article] [PubMed] [Google Scholar]
- 14.Imlay J A, Linn S. J Bacteriol. 1987;169:2967–2976. doi: 10.1128/jb.169.7.2967-2976.1987. [DOI] [PMC free article] [PubMed] [Google Scholar]
- 15.Imlay J A, Fridovich I. J Biol Chem. 1991;266:6957–6965. [PubMed] [Google Scholar]
- 16.Winterbourn C C. Biochem J. 1979;182:625–628. doi: 10.1042/bj1820625. [DOI] [PMC free article] [PubMed] [Google Scholar]
- 17.Rowley D A, Halliwell B. FEBS Lett. 1982;142:39–41. doi: 10.1016/0014-5793(82)80214-7. [DOI] [PubMed] [Google Scholar]
- 18.Imlay J A, Linn S. Science. 1988;240:1302–1309. doi: 10.1126/science.3287616. [DOI] [PubMed] [Google Scholar]
- 19.Minotti G, Aust S D. J Biol Chem. 1987;262:1098–1104. [PubMed] [Google Scholar]
- 20.Toyokuni S. Free Radical Biol Med. 1996;20:553–566. doi: 10.1016/0891-5849(95)02111-6. [DOI] [PubMed] [Google Scholar]
- 21.Flint D H, Tuminello J F, Emptage M H. J Biol Chem. 1993;268:22369–22376. [PubMed] [Google Scholar]
- 22.Gardner P R, Fridovich I. J Biol Chem. 1991;266:19328–19333. [PubMed] [Google Scholar]
- 23.Gardner P R, Fridovich I. J Biol Chem. 1991;266:1478–1483. [PubMed] [Google Scholar]
- 24.Kuo C F, Mashino T, Fridovich I. J Biol Chem. 1987;262:4724–4727. [PubMed] [Google Scholar]
- 25.Liochev S I, Fridovich I. Proc Natl Acad Sci USA. 1992;89:5892–5896. doi: 10.1073/pnas.89.13.5892. [DOI] [PMC free article] [PubMed] [Google Scholar]
- 26.Flint D H, Emptage M H. In: Biosynthesis of Branched Chain Amino Acids. Barak Z, Chipman D, Schloss J V, editors. Borch & Balaban, Philadelphia: Deerfield; 1990. pp. 285–314. [Google Scholar]
- 27.Liochev S I, Fridovich I. Free Radical Biol Med. 1994;16:29–33. doi: 10.1016/0891-5849(94)90239-9. [DOI] [PubMed] [Google Scholar]
- 28.Miller J H. Experiments in Molecular Genetics. Plainview, NY: Cold Spring Harbor Lab. Press; 1972. [Google Scholar]
- 29.Wolf R E, Jr, Cool J A. J Bacteriol. 1980;141:1222–1229. doi: 10.1128/jb.141.3.1222-1229.1980. [DOI] [PMC free article] [PubMed] [Google Scholar]
- 30.Bagg A, Neilands J B. Biochemistry. 1987;26:5471–5477. doi: 10.1021/bi00391a039. [DOI] [PubMed] [Google Scholar]
- 31.Rowley D L, Wolf R E., Jr J Bacteriol. 1991;173:968–977. doi: 10.1128/jb.173.3.968-977.1991. [DOI] [PMC free article] [PubMed] [Google Scholar]
- 32.Rockabrand D, Blum P. Mol Gen Genet. 1995;249:498–506. doi: 10.1007/BF00290575. [DOI] [PubMed] [Google Scholar]
- 33.Sambrook J, Fritsch E F, Maniatis T. Molecular Cloning: A Laboratory Manual. 2nd Ed. Plainview, NY: Cold Spring Harbor Lab. Press; 1989. [Google Scholar]
- 34.Imlay J A, Linn S. J Bacteriol. 1986;166:519–527. doi: 10.1128/jb.166.2.519-527.1986. [DOI] [PMC free article] [PubMed] [Google Scholar]
- 35.Yegorov D Y, Kozlov A V, Azizova O A, Vladimirov Y A. Free Radical Biol Med. 1993;15:565–574. doi: 10.1016/0891-5849(93)90158-q. [DOI] [PubMed] [Google Scholar]
- 36.Fraenkel D G, Horecker B L. J Biol Chem. 1964;239:2765–2771. [PubMed] [Google Scholar]
- 37.Bagg A, Neilands J B. J Bacteriol. 1985;161:450–453. doi: 10.1128/jb.161.1.450-453.1985. [DOI] [PMC free article] [PubMed] [Google Scholar]
- 38.Brumby P E, Massey V. Methods Enzymol. 1967;10:463–474. [Google Scholar]
- 39.Blakely W F, Fuciarelli A F, Wegher B J, Dizdaroglu M. Radiat Res. 1990;121:338–343. [PubMed] [Google Scholar]
- 40.Flint D H, Tuminello J F, Miller T J. J Biol Chem. 1996;271:16053–16067. doi: 10.1074/jbc.271.27.16053. [DOI] [PubMed] [Google Scholar]
- 41.Aust S D, Morehouse L A, Thomas C E. Free Radical Biol Med. 1985;1:3–25. doi: 10.1016/0748-5514(85)90025-x. [DOI] [PubMed] [Google Scholar]
- 42.Biemond P, Swaak A J G, Beindorff C M, Koster J F. Biochem J. 1986;239:169–173. doi: 10.1042/bj2390169. [DOI] [PMC free article] [PubMed] [Google Scholar]
- 43.Biemond P, Swaak A J G, van Eijk H G, Koster J F. Free Radical Biol Med. 1988;4:185–198. doi: 10.1016/0891-5849(88)90026-3. [DOI] [PubMed] [Google Scholar]
- 44.Bolann B J, Ulvik R J. Eur J Biochem. 1990;193:899–904. doi: 10.1111/j.1432-1033.1990.tb19415.x. [DOI] [PubMed] [Google Scholar]
- 45.Yariv J, Kalb A J, Sperling R, Bauminger E R, Cohen S G, Ofer S. Biochem J. 1981;197:171–175. doi: 10.1042/bj1970171. [DOI] [PMC free article] [PubMed] [Google Scholar]
- 46.Hudson S J, Andrews S C, Hawkins C, Williams J M, Izuhara M, Meldrum F C, Mann S, Harrison P M, Guest J R. Eur J Biochem. 1993;218:985–995. doi: 10.1111/j.1432-1033.1993.tb18457.x. [DOI] [PubMed] [Google Scholar]
- 47.Grossman M J, Hinton S M, Minak-Bernero V, Slaughter C, Stiefel E I. Proc Natl Acad Sci USA. 1992;89:2419–2423. doi: 10.1073/pnas.89.6.2419. [DOI] [PMC free article] [PubMed] [Google Scholar]
- 48.Andrews S C, Smith J M A, Yewdall S J, Guest J R, Harrison P M. FEBS Lett. 1991;293:164–168. doi: 10.1016/0014-5793(91)81177-a. [DOI] [PubMed] [Google Scholar]
- 49.Flint D H, Smyk-Randall E, Tuminello J F, Draczynska-Lusiak B, Brown O R. J Biol Chem. 1993;268:25547–25552. [PubMed] [Google Scholar]
- 50.Zablotny R, Fraenkel D G. J Bacteriol. 1967;93:1579–1581. doi: 10.1128/jb.93.5.1579-1581.1967. [DOI] [PMC free article] [PubMed] [Google Scholar]
- 51.Flint D H. J Biol Chem. 1996;271:16068–16074. [PubMed] [Google Scholar]
- 52.Imlay J A, Linn S. Science. 1988;240:640–642. doi: 10.1126/science.2834821. [DOI] [PubMed] [Google Scholar]
- 53.Greenberg J T, Demple B. EMBO J. 1988;7:2611–2617. doi: 10.1002/j.1460-2075.1988.tb03111.x. [DOI] [PMC free article] [PubMed] [Google Scholar]
- 54.Storz G, Christman M F, Sies H, Ames B N. Proc Natl Acad Sci USA. 1987;84:8917–8921. doi: 10.1073/pnas.84.24.8917. [DOI] [PMC free article] [PubMed] [Google Scholar]
- 55.Zheng L, Dean D R. J Biol Chem. 1994;269:18723–18726. [PubMed] [Google Scholar]
- 56.Boveris A, Cadenas E. In: Superoxide Dismutase. Oberley L W, editor. Vol. 2. Boca Raton, FL: CRC; 1982. pp. 15–30. [Google Scholar]
- 57.Gardner P R, Raineri I, Epstein L B, White C W. J Biol Chem. 1995;270:13399–13405. doi: 10.1074/jbc.270.22.13399. [DOI] [PubMed] [Google Scholar]
- 58.Wallace D C, Ye J, Neckelmann S N, Singh G, Webster K A, Greenberg B D. Curr Genet. 1987;12:81–90. doi: 10.1007/BF00434661. [DOI] [PubMed] [Google Scholar]
- 59.Richter C, Park J-W, Ames B N. Proc Natl Acad Sci USA. 1988;85:6465–6467. doi: 10.1073/pnas.85.17.6465. [DOI] [PMC free article] [PubMed] [Google Scholar]
- 60.Mecocci P, MacGarvey U, Kaufman A E, Koontz D, Shoffner J M, Wallace D C, Beal M F. Ann Neurol. 1993;34:609–616. doi: 10.1002/ana.410340416. [DOI] [PubMed] [Google Scholar]
- 61.Miller D M, Spear N H, Aust S D. Arch Biochem Biophys. 1992;295:240–246. doi: 10.1016/0003-9861(92)90513-v. [DOI] [PubMed] [Google Scholar]