Abstract
Central nervous system control of energy balance affects susceptibility to obesity and diabetes, but how fatty acids, malonyl-CoA, and other metabolites act at this site to alter metabolism is poorly understood. Pharmacological inhibition of fatty acid synthase (FAS), rate limiting for de novo lipogenesis, decreases appetite independently of leptin but also promotes weight loss through activities unrelated to FAS inhibition. Here we report that the conditional genetic inactivation of FAS in pancreatic β cells and hypothalamus produced lean, hypophagic mice with increased physical activity and impaired hypothalamic PPARα signaling. Administration of a PPARα agonist into the hypothalamus increased PPARα target genes and normalized food intake. Inactivation of β cell FAS enzyme activity had no effect on islet function in culture or in vivo. These results suggest a critical role for brain FAS in the regulation of not only feeding, but also physical activity, effects that appear to be mediated through the provision of ligands generated by FAS to PPARα. Thus, 2 diametrically opposed proteins, FAS (induced by feeding) and PPARα (induced by starvation), unexpectedly form an integrative sensory module in the central nervous system to orchestrate energy balance.
Introduction
Higher organisms adapt to changes in energy needs by assimilating peripheral hormonal and nutritional cues and integrating them in the central nervous system (1, 2). Even subtle defects in this system have deleterious consequences since modest excess weight in humans is associated with increased mortality (3, 4). The most thermodynamically efficient strategy for weight loss is appetite suppression, a difficult goal given the diversity of factors regulating food intake, ranging from amines and peptides to metabolites and fatty acids (reviewed in ref. 5).
Fatty acid metabolism affects feeding behavior. Malonyl-CoA, an intermediary substrate controlling fatty acid flux, and carnitine palmitoyltransferase-1 (CPT-1), which allows fatty acids access to mitochondria for β-oxidation, have been independently implicated in regulating appetite (6, 7). Pharmacological inhibition of fatty acid synthase (FAS), the multifunctional enzyme that utilizes malonyl-CoA for the first committed step in fatty acid biosynthesis (8), with the compound C75 produces anorexia and weight loss in mice in the setting of increased malonyl-CoA (9). However, recent studies indicate that these effects on malonyl-CoA alone may not be sufficient to induce anorexia, as C75 also has an impact on the sympathetic nervous system and metabolic mediators, including PPARα and PPARγ coactivator-1 α (PGC1α) (10, 11). In addition, CNS glucose metabolism is required for the anorexic actions of C75 (12). How multiple disparate events related to fatty acid metabolism in the CNS coordinate energy balance is uncertain.
Previous studies have linked appetite and pancreatic β cell function. Chronic i.c.v. insulin infusion reduces food intake and body weight (13). Genetic disruption of insulin receptor substrate 2 in β cells and the hypothalamus using rat insulin 2 promoter Cre (RIPCre) transgenic mice mated with floxed insulin receptor substrate 2 mice increases appetite as well as body weight and causes diabetes (14, 15). Constitutive activation of CPT-1 in pancreatic islets suppresses glucose-stimulated insulin secretion (16) whereas inhibition of CPT-1 in the hypothalamus (which increases long-chain fatty acyl-CoAs) decreases hepatic gluconeogenesis and food intake (17). Since many of the same factors appear to regulate food intake and β cell function, a common mechanism could integrate glucose metabolism and feeding behavior.
FAS is one such potential integrative mediator. It is regulated by glucose, insulin, amino acids, fatty acids, leptin, and other metabolites directly involved in energy balance (18–20). FAS is increased in animal models of obesity and insulin-resistant diabetes (21), and a sequence variant in FAS is associated with altered adiposity in humans (22). FAS expression is ubiquitous and essential for life since global inactivation of the FAS gene in mice is embryonic lethal at the preimplantation stage (23). Recent studies using liver-specific FAS knockout mice suggest that products of the FAS reaction (as yet unidentified) regulate hepatic glucose and lipid metabolism by serving as endogenous activators of the nuclear receptor PPARα (24). These findings and others (23, 25) suggest that de novo lipogenesis produces a distinct regulatory pool of fatty acids.
To determine whether FAS in pancreatic β cells and the CNS affects glucose metabolism and feeding, we mated floxed FAS mice (24) with RIPCre mice (26). We found that FAS is not important for pancreatic β cell function but is crucial for coordinating feeding behavior by activating PPARα in the brain.
Results
Generation of pancreatic β cell and hypothalamic FAS knockout mice.
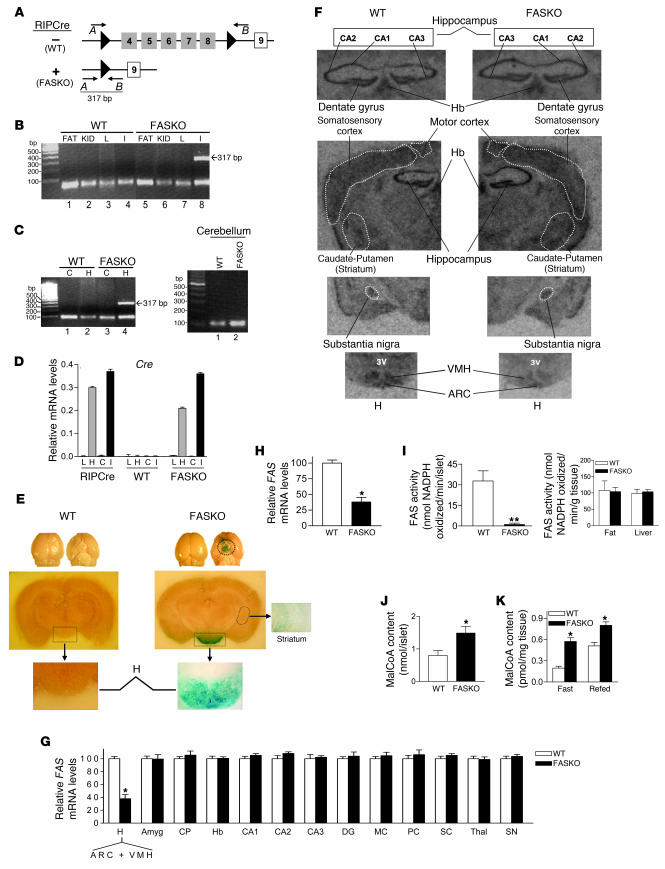
By crossing mice homozygous for the FAS loxP allele (24) with RIPCre mice, we generated FASKO (FAS knockout) mice (Figure 1), which were born at the expected frequency. There was no effect of genotype on either litter size or birth weights. FAS gene rearrangement was confirmed by PCR using primers (24) that yield a 317-bp product when exons 4–8 of the gene are deleted (Figure 1A) and was restricted to islets (Figure 1B) and hypothalamus (Figure 1C). FAS was not rearranged in other peripheral tissues (Figure 1B), the cerebral cortex (Figure 1C), or the cerebellum (Figure 1C) in WT or FASKO animals.
Figure 1. Generation of FASKO mice.
(A) Homozygous FAS-floxed mice with loxP sites (black arrowheads) flanking exons 4–8 (gray boxes) were mated with RIPCre animals to yield FASKO mice and their littermate controls (WT, floxed mice without Cre). (B and C) PCR analysis. DNA from FASKO islets (I) and hypothalamus (H) produced a 317-bp product (B, lane 8; C, lane 4) using primers A (forward arrow) and B (reverse arrow) in A, indicating appropriate deletion of exons 4–8 of the FAS gene. The product was absent in the islets and hypothalamus in WT (B, lane 4; C, left panel, lane 2), as well as in epididymal fat pads (FAT), kidney (KID), liver (L), cerebral cortex (C), and cerebellum (C, right panel) of WT and FASKO mice. (D) Quantitative RT-PCR of tissues from RIPCre and FASKO mice showed Cre expression only in islets and hypothalamus. (E) Dorsal and ventral views of whole brain from FASKO and WT mice mated with ROSA26 animals and stained for β-galactosidase (blue staining), indicative of Cre expression (upper panel). Robust expression of Cre was largely restricted to the hypothalamus of FASKO mice (middle and lower panels), with weak expression in the striatum. Original magnification, ×1.5 (middle panels), ×6.3 (lower panels), ×6.3 (striatum). Other brain regions had no blue staining. (F and G) In situ hybridization. ARC, arcuate nucleus; VMH, ventral medial hypothalamus; Amyg, amygdala; CP, caudate putamen (striatum); Hb, habenula; CA1,2,3, hippocampus areas CA1, CA2, CA3; DG, hippocampus dentate gyrus; MC, motor cortex; PC, pyriform cortex; SC, sensory cortex; Thal, thalamus (zona incerta); SN, substantia nigra; 3V, third ventricle. (H) FAS mRNA expression in the hypothalamus by quantitative RT-PCR. (I) FAS enzyme activity in isolated islets (left panel), epididymal fat pads, and liver (right panel). (J) Determination of malonyl-CoA (MalCoA) content in isolated islets. (K) Malonyl-CoA content in the hypothalamus of 24-hour fasted (fast), and 24-hour fasted–24-hour refed (refed) mice. For D and G–K, results are mean ± SEM of 6–8 animals per group. *P < 0.05; **P < 0.001 compared with corresponding WT mice.
We confirmed previous reports (14, 15, 27) of both pancreatic β cell and hypothalamic Cre expression with this RIPCre model in 2 ways. First, Cre mRNA was detected by quantitative RT-PCR only in the hypothalamus and islets of RIPCre and FASKO mice (Figure 1D). Second, we crossed the FASKO mice with ROSA26 animals, a model that allows expression of β-galactosidase in the presence of Cre recombinase (28). Expression of β-galactosidase was present, as expected, in pancreatic β cells (not shown). Strong expression of β-galactosidase was also present in a diffuse population of hypothalamic neurons and weakly within the striatum (caudate putamen) in FASKO brains (Figure 1E), a pattern that is consistent with previous reports (14, 15, 27, 29). However, in situ hybridization for FAS message showed that its expression was unaffected by genotype in the striatum, substantia nigra, or other brain regions analyzed, except within the hypothalamus of FASKO mice around the arcuate nucleus and the ventral medial hypothalamus (Figure 1, F and G). The decrease in FAS expression in the hypothalamus was further quantified and confirmed by quantitative RT-PCR (Figure 1H). The actual degree of neuronal FAS suppression was probably greater than shown in Figure 1H since these measurements include glial cells, which would not be expected to show gene rearrangement and decreased expression. Brain weight (0.43 ± 0.02 g WT versus 0.41 ± 0.02 g FASKO; P = NS, n = 5) and overall brain morphology were also similar between genotypes.
Two other lines of evidence indicated that FAS was disrupted in pancreatic β cells and hypothalamus. First, FAS enzyme activity was decreased and malonyl-CoA levels were increased in isolated FASKO islets (Figure 1, I and J). Malonyl-CoA, a FAS substrate, would be expected to rise with FAS disruption. FAS enzyme activity was unaffected in FASKO epididymal fat and liver (Figure 1I, right panel). Second, hypothalamic malonyl-CoA content in the FASKO mice was significantly elevated even in the fasted state; levels under these conditions should be low, as seen in fasted WT littermates (Figure 1K). Collectively, these results are consistent with selective inactivation of FAS in pancreatic β cells and the hypothalamus.
Pancreatic β cell function in FASKO mice.
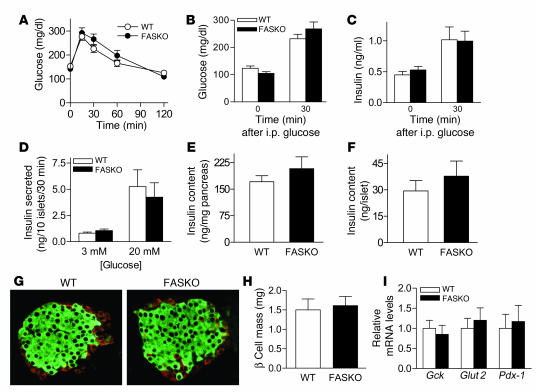
Although recent data suggest that Cre expression alone may have nonspecific effects on β cell function (30), we found no β cell phenotype in FASKO mice. Loss of FAS enzyme activity in FASKO islets (Figure 1I) had no effect on glucose and insulin levels during glucose tolerance testing (Figure 2, A–C). When islets were isolated from these mice and stimulated with glucose in culture, there was no difference in insulin secretion (Figure 2D). Insulin content of whole pancreas as well as isolated islets was unaffected by the deletion of β cell FAS (Figure 2, E and F). Islets from FASKO mice exhibited normal distribution of non-β cells at the periphery and insulin-positive cells in the core (Figure 2G). Morphometry showed similar β cell mass (Figure 2H) and islet size distribution (not shown) in FASKO and WT mice. Expression of genes involved in glucose sensing and islet function, such as glucokinase (Gck), glucose transporter 2 (Glut2), and pancreatic duodenal homeobox-1 (Pdx-1), was unaltered by islet FAS inactivation (Figure 2I). Together, these results show that FAS is not required for β cell function in adult mice.
Figure 2. FAS does not play a major role in pancreatic β cell function.
(A) Glucose (1 g/kg, 10% D-glucose) tolerance tests (i.p.) in 4-month-old WT and FASKO mice (n = 8). (B) Serum glucose and (C) insulin concentrations immediately before (time 0) and 30 minutes after the glucose load (n = 8). (D) Isolated islets from WT and FASKO mice cultured with 3 mM and 20 mM glucose (n = 7). (E) Insulin content from whole pancreas and (F) isolated islets (n = 7). (G) Representative pancreatic sections immunostained with antibodies against insulin (green) and a mixture of anti-glucagon, anti-pancreatic polypeptide, and anti-somatostatin antibodies (red) in WT and FASKO mice (n = 3). Original magnification, ×20. (H) Islet β cell mass (n = 4). (I) Gene expression by quantitative RT-PCR for glucokinase (Gck), Glut2, and Pdx-1 in isolated islets from WT and FASKO mice (n = 5). All bars represent mean ± SEM.
Feeding behavior and energy balance in FASKO mice.
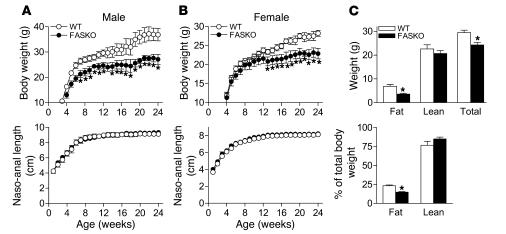
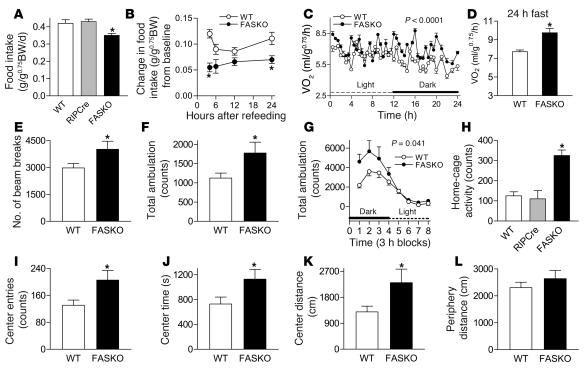
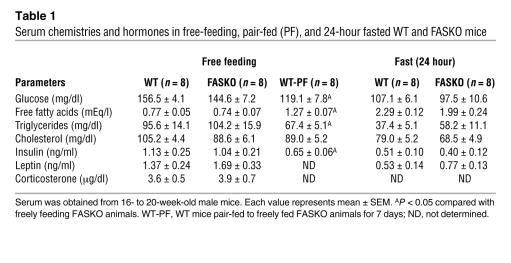
FASKO mice weighed less, but were not runted, compared with their WT littermates (Figure 3, A and B). Their decreased body weight was due to decreased adiposity without a genotype effect on percentage of lean body mass (Figure 3C). Adiposity is determined by the balance between caloric intake and expenditure. Both were affected in FASKO mice. Freely feeding FASKO mice ate 17% less than control (WT and RIPCre) animals (Figure 4A). To determine whether this hypophagia was dependent on feeding state, we studied the response of FASKO mice to 24 hours of food deprivation. Compared with ad libitum baseline levels, food intake was significantly attenuated at 4 hours and 24 hours after refeeding (Figure 4B) in FASKO mice, confirming the hypophagic effect of CNS FAS disruption. This genetic alteration did not produce visceral illness or aversive behavior, as FASKO mice had normal water intake (2.03 ± 0.94 versus 1.98 ± 1.05 ml/24 h in WT; P = NS, n = 20), body temperature, stool mass and consistency, pain threshold (assessed using the hot plate test at 55°C, not shown), and corticosterone concentration (Table 1). Serum glucose, insulin, free fatty acids, triglycerides, and cholesterol levels under ad libitum chow-fed and 24-hour–fasted conditions were also similar between genotypes (Table 1).
Figure 3. FASKO mice weigh less due to decreased fat mass.
(A and B) Body weight (top panels) and naso-anal length (bottom panels) with age in male and female WT and FASKO mice maintained on chow diet. Results are from 20–25 mice per genotype per sex. *P < 0.05 versus control. (C) Body composition of 16- to 20-week-old WT and FASKO male mice using dual energy x-ray absorptiometry represented as absolute mass (top panel) and as percentage of total body mass (bottom panel). Each bar represents the mean ± SEM of 12–15 animals per genotype. *P < 0.05 compared with WT.
Figure 4. Hypothalamic FAS inactivation decreases food intake, increases metabolic rate and physical activity, and alters behavior.
(A) Ad libitum daily food intake in control (WT [lox/lox Cre–] and RIPCre) and FASKO mice (n = 25). (B) Change in food intake with refeeding after a 24-hour fast relative to ad libitum baseline levels (n = 12–15). BW, body weight. (C–D) Oxygen consumption (VO2) by indirect calorimetry during a 12-hour light (6:00 am–6:00 pm) and 12-hour dark (6:00 pm–6:00 am) cycle in freely fed animals and following a 24-hour fast. (E) Assessment of locomotor activity determined by total beam breaks. (F) Ambulations in an open field arena were recorded over a 1-hour and (G) 24-hour period using a computerized photobeam system. (H) Home-cage activity was quantified using infrared sensors over a 3-day period. (I–L) Assessment of open-field behaviors, including total center entries, time spent in the center, distance traveled in the center, and distance traveled in the periphery of the test arena. For C–L, 17–22 animals per genotype were used. All graphs represent mean ± SEM. *P < 0.05 compared with WT littermates.
Table 1 .
Serum chemistries and hormones in free-feeding, pair-fed (PF), and 24-hour fasted WT and FASKO mice
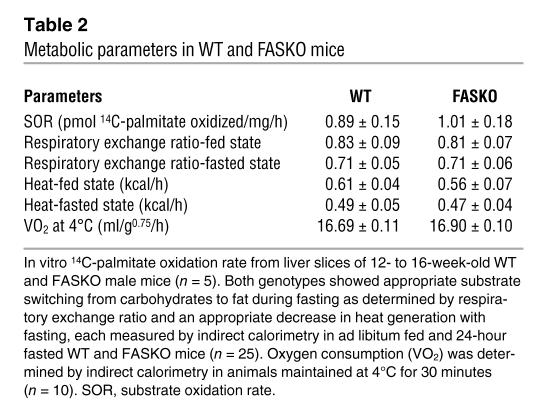
FASKO animals exhibited increased oxygen consumption under both fed (Figure 4C) and fasted conditions (Figure 4D). When animals were tested over a 1-hour period using a computerized photobeam system, FASKO mice showed significantly increased locomotor activity in terms of both total beam breaks (Figure 4E) and ambulations (whole-body movements) (Figure 4F). They also had increased ambulation over a 24-hour period (Figure 4G), with the greatest differences being manifested during the dark phase, the same time period during which maximal differences in oxygen consumption were seen (Figure 4C). Increased oxygen consumption in FASKO animals was mainly due to increased physical activity rather than intrinsically elevated metabolism in peripheral tissues, since substrate oxidation rate, substrate preference (respiratory exchange ratio), heat generation, and cold-induced thermogenesis were all unaffected by genotype (Table 2). We sought further confirmation of increased physical activity by using an infrared sensing technique to measure home-cage activity over 3 days (Figure 4H). This increase in activity was seen only in the FASKO mice and not in the control (WT and RIPCre) animals (Figure 4H). Together with hypophagia (Figure 4A), these data suggest that the observed phenotype is due to FAS inactivation and not a nonspecific effect of Cre.
Table 2 .
Metabolic parameters in WT and FASKO mice
FASKO animals also made more entries (Figure 4I), spent more time (Figure 4J), and traveled a greater distance (Figure 4K) in the center of the open field as compared with WT controls. These differences might reflect altered emotionality and not merely a generalized hyperactive state because the distance traveled in the periphery of the same open-field arena was similar between genotypes (Figure 4L).
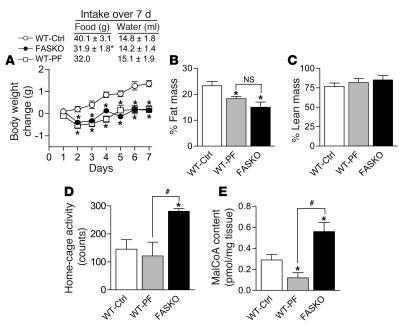
To determine whether hypophagia, increased physical activity, or both were responsible for lower body weight in FASKO animals, we performed pair-feeding experiments. When WT mice were food restricted by pair-feeding to FASKO animals for 7 days, the change in their body weight and percentage of fat mass was nearly identical to that of freely fed FASKO mice (Figure 5, A and B). Percentage of lean mass remained unaffected by genotype or pair feeding (Figure 5C). Physical activity in the WT pair-fed mice remained the same as in ad libitum–fed control mice (WT-Ctrl) and was lower than that of FASKO animals (Figure 5D). These results suggest that decreased food intake is largely responsible for decreased adiposity in FASKO mice. However, they do not eliminate the possibility that, over the long term, increased physical activity of these mice also contributes to their decreased adiposity.
Figure 5. Pair-feeding studies in WT and FASKO mice.
(A–E) Effect of pair-feeding (PF) WT mice to freely fed FASKO animals for 7 days on body weight and food and water intake (A), percentage of fat (B) and lean mass (C), physical activity level (D), and hypothalamic malonyl-CoA content (E). All results are mean ± SEM of 6–8 animals per group. *P < 0.05 compared with WT control. #P < 0.05 compared with freely fed FASKO mice.
Pair feeding WT mice with FASKO animals further decreased hypothalamic malonyl-CoA content relative to that of freely fed control animals, an appropriate physiologic response to fasting (Figure 5E). Serum metabolites and hormones in the WT pair-fed mice confirmed the relative fasted state (Table 1). Since, by design, food intake in FASKO and pair-fed WT mice was the same, higher hypothalamic malonyl-CoA content in the FASKO animals (Figure 5E) suggests that hypophagia in these animals was a consequence of hypothalamic FAS inactivation.
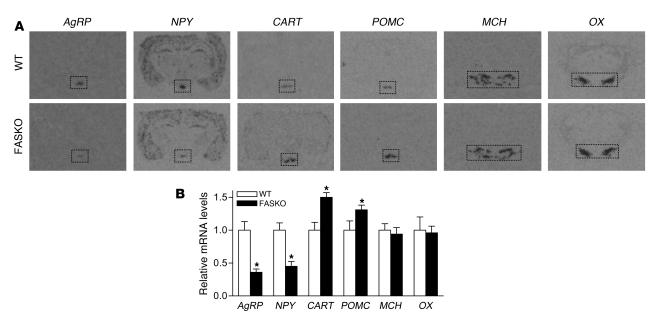
Feeding behavior is controlled in part by orexigenic and anorexigenic neuropeptides within the arcuate nucleus of the hypothalamus, where signals such as insulin and leptin are integrated (1, 2). In situ hybridization revealed suppression of mRNAs for the orexigenic neuropeptides agouti-related protein (AgRP) and neuropeptide Y (NPY) and induction of mRNAs for the anorexigenic neuropeptides cocaine-amphetamine–related transcript (CART) and proopiomelanocortin (POMC) in FASKO as compared with WT arcuate nucleus (Figure 6, A and B). Many hypothalamic areas, including the paraventricular nucleus and the lateral hypothalamus, are supplied by axons from the NPY/AgRP neurons in the arcuate nucleus (31). Therefore, we also assessed melanin-concentrating hormone (MCH) and orexin (OX) mRNAs in the lateral hypothalamus and CART mRNA in the paraventricular nucleus. In contrast to changes in neuropeptide expression seen in the arcuate nucleus, MCH and OX mRNA levels in the lateral hypothalamus (Figure 6, A and B) and CART expression in the paraventricular nucleus (not shown) were similar between FASKO and control animals. Our previous studies (32) showed that pair feeding normally increases NPY and decreases CART and POMC expression, a normal physiological response to fasting (33). In contrast, despite their hypophagia, FASKO mice have a hypothalamic neuropeptide expression profile (at least in the arcuate nucleus) characteristic of the fed state.
Figure 6. In situ hybridization analysis of hypothalamic orexigenic and anorexigenic neuropeptides.
(A and B) In situ hybridization showing decreased AgRP and NPY, but increased CART and POMC mRNA expression within the arcuate nucleus of freely fed WT and FASKO mice. No effect of genotype is seen on mRNA levels of MCH and orexin (OX) within the lateral hypothalamus. The rectangles indicate the area analyzed by densitometry to quantify the mRNA abundance in B. Original magnification, ×1.5. All results are mean ± SEM of 8 animals per group from 2 independent experiments. *P < 0.05 compared with WT littermates.
FAS activation of brain PPARα coordinates feeding behavior.
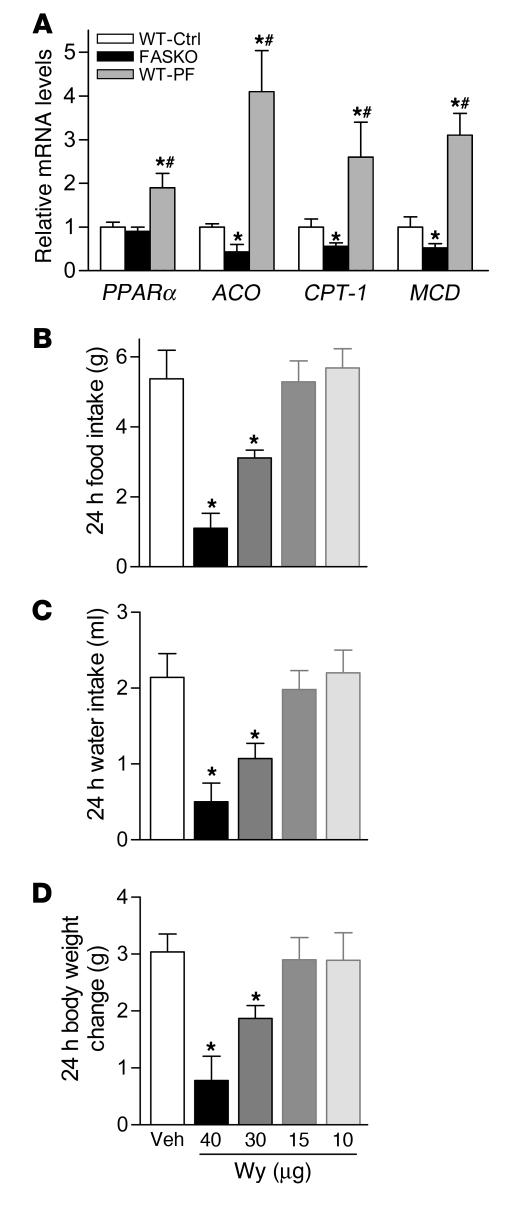
While hypophagic FASKO mice resemble C75-treated WT mice (9, 31), C75 also affects the sympathetic nervous system and mediators such as PPARα (10, 11). Since hepatic FAS is required for PPARα activation (24), we hypothesized that FAS regulates feeding through PPARα. We first studied the effects of hypothalamic FAS disruption on PPARα expression and its target genes. In contrast to limited data regarding the presence of PPARα in the hypothalamus (34), we consistently detected PPARα message by quantitative RT-PCR and found no genotype effect (Figure 7A). However, message levels of 3 genes known to be induced by PPARα (35, 36), acyl-CoA oxidase (ACO), CPT-1, and malonyl-CoA decarboxylase (MCD, which lowers malonyl-CoA levels), were decreased by approximately 50% in FASKO compared with WT hypothalamus (Figure 7A). All of these genes were appropriately induced in WT mice pair fed with FASKO animals, reflecting the normal physiologic response to fasting (Figure 7A). These data show impaired hypothalamic PPARα activation in hypophagic FASKO animals.
Figure 7. FASKO mice have impaired hypothalamic PPARα signaling.
(A) Expression of PPARα and its target genes (ACO, CPT-1, and MCD) in hypothalamus by quantitative RT-PCR in freely fed controls (WT-Ctrl), FASKO mice, and WT mice pair-fed with FASKO mice (WT-PF). Bars represent mean ± SEM of 8–10 animals per genotype. *P < 0.05 compared with WT-Ctrl. #P < 0.05 compared with freely fed FASKO mice. (B–D) Dose-dependent effect of i.c.v. administration of Wy14,643 on food/water intake and body weight. Eight-week-old male WT mice weighing approximately 25 g with chronically implanted i.c.v. cannulae received either vehicle (Veh; 20% DMSO in artificial cerebrospinal fluid) or the indicated doses of Wy14,643 (Wy) (n = 4 for each dose) after a 23.5-hour fast. The initial i.c.v. dose (40 μg) in a 25-gram mouse approximates the i.p. dose (40 mg/kg) known to induce anorexia in mice (37). Doses were titrated until no systemic aversive effects, including changes in food and water intake or body weight, were noted 24 hours after refeeding following treatment. Data represent mean ± SEM. *P < 0.05 compared with vehicle-treated animals.
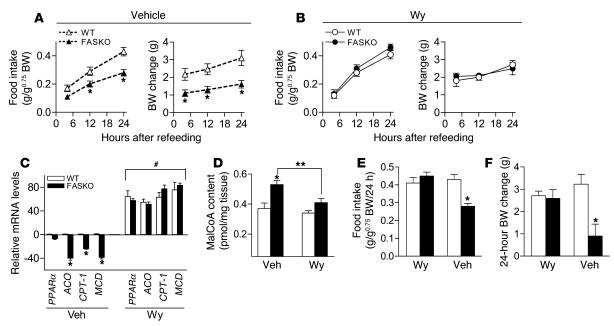
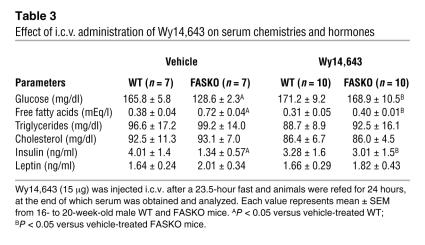
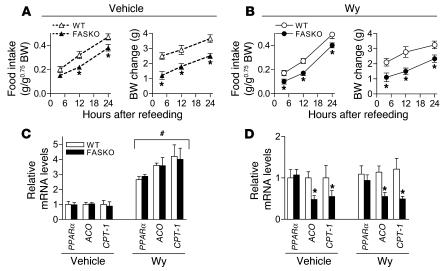
If decreased hypothalamic PPARα signaling caused by FAS inactivation suppresses food intake (Figure 4B), then administration of Wy14,643 (a potent PPARα agonist) near the hypothalamus should prevent hypophagia. Since there were no previous reports of i.c.v. treatment with Wy14,643, we performed dose-response studies to minimize the likelihood of nonspecific effects or visceral illness caused by the drug. The lowest effective i.c.v. dose that did not adversely affect food/water intake and body weight in WT animals was 15 μg (Figure 7, B–D). Administration of this dose i.c.v. to 23.5-hour fasted FASKO mice 30 minutes before the onset of the dark cycle caused an increase in food intake comparable to WT levels over the 24-hour refeeding period (Figure 8, A and B). Differences in body weight change between FASKO and WT mice were also abolished by 4 hours (Figure 8, A and B), reflecting increased food intake in the FASKO animals with i.c.v. PPARα agonist treatment. As compared with hypophagic vehicle-treated FASKO mice, Wy14,643-treated FASKO animals had higher serum glucose and insulin concentrations and lower free fatty acid levels (Table 3), consistent with their increased food intake after the 23.5-hour fast (Figure 8B). Water intake was not affected by either vehicle or drug treatment (not shown).
Figure 8. Administration of PPARα agonist i.
.v. restores PPARα signaling and normalizes food intake in FASKO mice. (A and B) Effect of a single i.c.v. injection (2 μl) of vehicle (20% dimethyl sulfoxide in artificial cerebrospinal fluid) and Wy14,643 (Wy; 15 μg) on food intake (left panel) and body weight change (right panel) in WT and FASKO mice following a 23.5-hour fast. (C) Effects of i.c.v. injection of vehicle (Veh) and Wy14,643 (Wy) on mRNA levels of PPARα and its target genes (ACO, CPT-1 and MCD) in the hypothalamus by quantitative RT-PCR after 24 hours of refeeding. (D) Effects of i.c.v. injection of vehicle and Wy14,643 on hypothalamic malonyl-CoA content after 24 hours of refeeding. (E and F) Effect on food intake and body weight change in WT and FASKO mice initially treated with Wy14,643 and then treated with vehicle 7 days later. All results represent mean ± SEM for n = 7 per genotype for vehicle and n = 10 per genotype for Wy groups. *P < 0.05 compared with corresponding WT; #P < 0.05 compared with corresponding vehicle-treated animals; **P < 0.05 compared with vehicle-treated FASKO mice.
Table 3 .
Effect of i.c.v. administration of Wy14,643 on serum chemistries and hormones
If FAS affects feeding through PPARα, CNS administration of Wy14,643 should restore not only food intake but also expression of PPARα target genes. PPARα, ACO, CPT-1, and MCD mRNAs in the hypothalamus were induced in FASKO mice at the end of the refeeding period (Figure 8C). Wy14,643 given i.c.v. also lowered hypothalamic malonyl-CoA (Figure 8D), suggesting that hypothalamic PPARα signaling regulates malonyl-CoA, presumably through the induction of MCD (36). To confirm that Wy14,643 treatment increased food intake in FASKO mice, we subjected mice to a crossover protocol in which animals previously treated with the drug were given vehicle after a 1-week washout period. Withdrawal of PPARα activation in FASKO mice returned feeding and body weight to baseline levels (Figure 8, E and F).
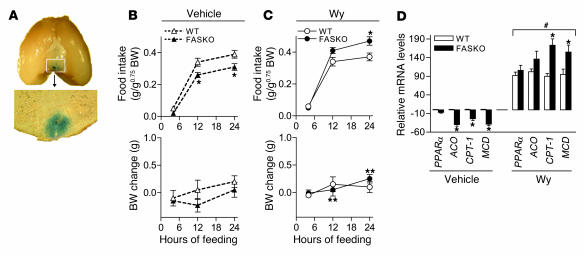
To further confirm that PPARα agonist treatment rescues hypophagia in FASKO mice, we injected Wy14,643 into the ventral hypothalamus by bilateral stereotaxic injection. To verify appropriate delivery to the targeted area, Evans blue, an inert dye, was coinjected with the drug, and brain sections were examined for the presence of the dye. As illustrated in Figure 9A, 24 hours after bilateral stereotaxic injection, dye was detected in the ventral hypothalamus adjacent to and below the third ventricle, a typical pattern for bilateral stereotaxic injections at this site.
Figure 9. Bilateral stereotaxic injection of PPARα agonist into the ventral hypothalamus restores PPARα signaling and normalizes food intake in FASKO mice.
(A) Wy14,643 (10 μg in 20% dimethyl sulfoxide and 0.05% Evans blue dye in artificial cerebrospinal fluid) was delivered into the ventral hypothalamus by bilateral stereotaxic injection. Twenty-four hours later, the brain was sectioned and examined for the presence of Evans blue dye. Shown is the typical pattern observed in the ventral hypothalamus with a prominent presence of dye in the region of the arcuate nucleus and ventromedial hypothalamus. Original magnification, ×2.5. (B and C) Effect of a single intrahypothalamic injection of vehicle (20% dimethyl sulfoxide and 0.05% Evans blue dye in artificial cerebrospinal fluid) and Wy14,643 (10 μg) on food intake (upper panels) and body weight change (lower panels) in freely feeding WT and FASKO mice. (D) Effect of intrahypothalamic injection of vehicle and Wy14,643 on mRNA levels of PPARα and its target genes (ACO, CPT-1, and MCD) in the hypothalamus by quantitative RT-PCR at the end of the 24-hour feeding period. All results represent mean ± SEM for n = 5 per genotype for vehicle and n = 7 per genotype for Wy groups. *P < 0.05 compared with corresponding WT; #P < 0.05 compared with corresponding vehicle-treated animals; **P < 0.05 compared with vehicle-treated FASKO mice.
As FASKO mice were hypophagic under ad libitum–fed conditions (Figure 4A), we hypothesized that restoration of PPARα signaling in freely fed animals would also prevent the hypophagia. Thirty minutes before the onset of the dark cycle, 10 μg of Wy14,643 was delivered directly into the ventral hypothalamus by bilateral stereotaxic injection, which resulted in increased food intake in FASKO mice by 12 hours that was significantly more than in WT at 24 hours (Figure 9, B and C). The body weight change was higher in FASKO mice after intrahypothalamic Wy14,643 injection as compared to vehicle-treated animals at the 12-hour and 24-hour time points (Figure 9, B and C), reflecting increased food intake and reversal of the baseline hypophagia. As with i.c.v. experiments, PPARα and its target genes ACO, CPT-1, and MCD were also induced after intrahypothalamic administration of Wy14,643 (Figure 9D). However, intrahypothalamic treatment resulted in higher expression of CPT-1 and MCD mRNA levels in FASKO as compared with WT mice (Figure 9D) at the end of the 24-hour feeding period, coincident with their increased food intake (Figure 9C).
Peripheral administration of Wy14,643 at much higher doses is reported to induce anorexia in mice (37). Although effective at reversing hypophagia with CNS administration, the same dose of Wy14,643 given i.p. did not affect food intake or body weight in FASKO mice (Figure 10, A and B). Control mice also maintained their baseline food intake and body weight. As expected, i.p. injection of the PPARα agonist induced PPARα and its target genes in the liver (Figure 10C) and jejunum (not shown) but had no effect on the same genes in the hypothalamus (Figure 10D), confirming that CNS activation of PPARα is required to increase food intake in FASKO animals.
Figure 10. Administration of Wy14,643 i.
. in WT and FASKO mice. (A and B) Effect of a single i.p. injection of vehicle (20% dimethyl sulfoxide in saline) and Wy14,643 (15 μg) on food intake (left panels) and body weight change (right panels) in WT and FASKO mice following a 23.5-hour fast. (C and D) Effect of i.p. injection of vehicle and Wy14,643 on mRNA levels by quantitative RT-PCR of PPARα and its target genes (ACO and CPT-1) in the liver (C) and hypothalamus (D) after 24 hours of refeeding in WT and FASKO mice. Data represent mean ± SEM for 5–6 animals per genotype per group. *P < 0.05 compared with corresponding WT; #P < 0.05 compared with corresponding vehicle-treated animals.
Long-chain fatty acids may serve as ligands for PPARα and are derived from dietary fat or generated de novo by the FAS reaction. To determine whether supplying high levels of fatty acids in the diet could activate PPARα and reverse hypophagia in FASKO mice, we fed these animals a high-fat diet (42%) for 2 weeks (Figure 11). Though food intake in both genotypes was decreased compared with their respective baseline levels during this relatively short high-fat feeding period (Figure 11B), hypophagia in FASKO animals persisted whether expressed as absolute intake per day (Figure 11A) or as percentage change from chow baseline (Figure 11B). This intervention also failed to restore the impaired hypothalamic PPARα signaling (Figure 11C). FASKO mice remained hypophagic even after 10 weeks of high-fat feeding (not shown). Together, these results suggest that fatty acids synthesized by FAS but not those provided by dietary fat activate PPARα in the brain to affect feeding behavior.
Figure 11. High-fat diet (HFD) in WT and FASKO mice.
(A and B) Effect of 2 weeks of high-fat diet on food intake and change compared with chow baseline levels. (C) Levels of mRNA by quantitative RT-PCR of PPARα and its target genes (ACO, CPT-1, and MCD) in the hypothalamus of WT and FASKO mice after 2 weeks of high-fat diet. All results are mean ± SEM for 9–10 animals per group. *P < 0.05 compared with corresponding WT littermates.
Discussion
FAS is an attractive potential target for obesity therapies because it is regulated by major mediators of energy balance and controls steady-state levels of substrates affecting food intake. However, direct evidence implicating FAS in feeding behavior is lacking since pharmacological inhibitors of FAS such as C75 have complex effects that include activation of the sympathetic nervous system. Our generation of mice with genetic inactivation of FAS in the hypothalamus and β cell serendipitously resulted in animals with hypophagia and altered behavior with no apparent β cell phenotype, allowing us to implicate brain FAS in energy homeostasis through its activation of the nuclear receptor PPARα.
The absence of a β cell phenotype in these mice was unexpected. De novo lipogenesis through malonyl-CoA is important for insulin secretion in HIT cells, a β cell line (38). The malonyl-CoA/CPT-1 interaction contributes to a metabolic signaling network controlling insulin secretion in INS(832/13) cells (16). In contrast with these studies in cell lines, our in vivo results using islets with the loss of FAS enzyme activity (Figure 1I) and increased malonyl-CoA content (Figure 1J) indicate that FAS is not required for β cell function (Figure 2).
FASKO mice had less adiposity, decreased food intake, and increased activity (Figures 3 and 4), prompting the evaluation of non-β cell tissues affecting energy homeostasis. We detected extraislet Cre expression within the hypothalamus and caudate putamen (striatum) (Figure 1E), consistent with results of others using the rat insulin 2 promoter to drive Cre (14, 15, 27, 29). However, analysis of various brain regions for FAS gene rearrangement and mRNA expression showed that FAS inactivation was largely restricted to the hypothalamus (Figure 1, B–H). Given the absence of an effect on β cell function in FASKO mice, it is likely that FAS deletion in the hypothalamus is responsible for the lean phenotype. Pair-feeding experiments (Figure 5) indicated that the decreased adiposity in FASKO mice was mostly due to their relative hypophagia rather than increased physical activity. However, a minor contribution of physical activity to the lean phenotype is plausible given that, despite the relative food restriction of WT mice, a nonsignificant trend toward increased adiposity persisted (Figure 5B). There is precedence for a link between hypothalamic FAS and increased food intake. Pharmacologic activation of the cannabinoid receptor 1 promotes feeding in association with induction of hypothalamic FAS gene expression (39).
Direct evidence for hypothalamic FAS mediation of food intake helps unify previous observations regarding the role of fatty acid metabolism in CNS control of bioenergetics. Increased neuronal malonyl-CoA content, inhibition of CPT-1 activity, and the accumulation of long-chain fatty acids and their esters have been independently reported to suppress appetite (6, 7, 17, 40). These biologic variables are interrelated in complex ways. High malonyl-CoA levels inhibit CPT-1 activity. Decreased CPT-1 activity impairs fatty acid metabolism, causing the accumulation of long-chain fatty acyl-CoAs (7) that inhibit acetyl-CoA carboxylase (41) and decrease malonyl-CoA levels, since malonyl-CoA is the product of the acetyl-CoA carboxylase reaction.
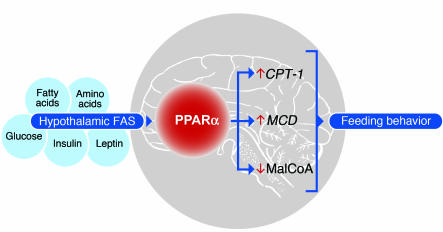
In the current work, we establish a basis for the coordinate regulation of these interrelated mediators. FASKO mice lack normal hypothalamic PPARα signaling (Figure 7A), resulting in hypophagia with increased malonyl-CoA content (Figure 1K and Figure 5E) and decreased expression of CPT-1 (Figure 7A and Figure 8C) in the hypothalamus. Intrahypothalamic and i.c.v. (but not i.p.) administration of Wy14,643 restored hypothalamic PPARα signaling by inducing CPT-1 and MCD (Figure 8C and Figure 9D) and decreasing malonyl-CoA content (Figure 8D), which increased food intake (Figure 8B and Figure 9C). Fatty acids provided in a high-fat diet failed to correct impaired hypothalamic PPARα signaling (Figure 11C) or reverse hypophagia in FASKO animals (Figure 11A). Therefore, fatty acids synthesized by FAS appear to activate PPARα in the CNS to coordinate feeding behavior. These results are consistent with the model shown in Figure 12. FAS, known to be regulated by several metabolites (glucose, amino acids, fatty acids, insulin, and leptin) involved in energy balance (8, 18–20), senses nutritional status in the CNS and orchestrates fatty acid metabolism to affect feeding behavior through the nutritionally regulated nuclear receptor PPARα.
Figure 12. A proposed model for the role of hypothalamic FAS and PPARα in the regulation of feeding behavior.
FASKO mice exhibit a lean hypophagic phenotype with impaired hypothalamic PPARα signaling. FAS is regulated by many factors associated with the fed state whereas PPARα is induced in the fasted state. Activation of PPARα in the CNS induces CPT-1 and MCD expression and decreases malonyl-CoA content, thereby forming an integrative sensory module to affect feeding homeostasis.
Why the administration of the PPARα agonist to WT animals does not further increase food intake is unclear. Activating PPARα in an animal with normal PPARα signaling (as opposed to FASKO animals with impaired PPARα activation) may prompt compensatory changes in the expression of regulatory factors in an attempt to control food intake. In support of this notion, NPY and AgRP knockout mice do not exhibit expected decreases in food intake (42). There is no effect on food intake in whole-body PPARα null mice (43).
In addition to their hypophagia, FASKO mice had increased oxygen consumption due to enhanced physical activity rather than elevation of intrinsic metabolism in peripheral tissues (Figure 4 and Table 2). These phenotypes are strikingly similar to those of MCH and MCH receptor knockout mice, which are also hypophagic, lean, and hyperactive (44, 45). In our model, MCH mRNA levels in the lateral hypothalamus were unaffected by genotype (Figure 6), but we cannot rule out effects on MCH protein levels or MCH receptor signals contributing to the hyperactive phenotype of FASKO mice.
FASKO animals also appeared to manifest decreased anxiety-like behavior, as demonstrated by their increased number of entries, time spent, and distance traveled in the center of an open-field arena (Figure 4, I–K). This behavioral change was unexpected, since anorexia is commonly associated with increased anxiety-like emotionality, as occurs with central infusion of corticotrophin-releasing factor (46) or glucagon-like peptide 1 (47). Rimonabant, a cannabinoid receptor 1 receptor antagonist, causes weight loss in humans, complicated by anxiety and depression (48). Unlike these interventions, interrupting the hypothalamic FAS-PPARα axis suppresses appetite and increases physical activity without producing concomitant increases in anxiety-like behaviors, ideal side effects for treating human obesity.
In summary, FAS is not required for pancreatic β cell function but is critical for the regulation of feeding behavior through the activation of PPARα, likely in the hypothalamus. It might seem paradoxical that PPARα, a transcription factor that evolved to respond to starvation, is regulated by FAS, an enzyme activated by feeding. We speculate that it is precisely because of their opposite roles that these factors coordinate feeding behavior by forming a negative feedback loop between availability of nutrients and their metabolism. The FAS-PPARα axis (Figure 12) may thus represent an evolutionary adaptation to maintain energy homeostasis in response to 2 of the most primordial stimuli, feeding and starvation.
Methods
Animals.
FAS-floxed mice have been described (24). RIPCre mice were obtained from The Jackson Laboratory. We used 4- to 5-month-old male and female littermate FASKO (Cre positive with the floxed allele) and WT (Cre negative with the floxed allele) mice in a mixed (BL/6 and 129) background for experiments. FAS gene rearrangement was confirmed using both PCR and Southern blotting, and mice were genotyped using FAS- and Cre-specific primer sets (24). Animals were housed in temperature-controlled rooms with a 12-hour light/dark cycle with free access to standard mouse chow (Purina 5053) and water, unless otherwise specified. Protocols followed NIH guidelines and were approved by the Washington University Animal Studies Committee.
Locomotor activity and open-field behavior experiments.
To determine normal cage activity in WT and FASKO mice, we used infrared sensors to detect body-heat image and its spatial displacement over time (InfraMot; TSE Systems). Sensors were mounted on standard mouse cage covers and the data analyzed using the InfraMot software (version 1.3) to obtain duration and intensity of activity over several days. To evaluate locomotor activity and possible alterations in emotionality, mice were studied over a 1-hour period while ambulations were measured over 24 hours in transparent (47.6 × 25.4 × 20.6 cm) polystyrene enclosures as described (49). Each chamber was surrounded by a frame containing a 4 × 8 matrix of photocell pairs, the output of which was analyzed by MotorMonitor software (Hamilton-Kinder). The software was used to define a 33 × 11 cm central zone and a peripheral or surrounding zone that was 5.5 cm wide with the sides of the enclosure being the outermost boundary. This peripheral area extended along the entire perimeter of the chamber. Variables that were analyzed included the total number of beam breaks, ambulations (whole-body movements), rearings, entries made, time spent, and the distance traveled in the center arena as well as the distance traveled in the periphery surrounding the center. All behavioral experiments were performed between 8:00 am and noon by an observer blinded to genotype.
Feeding studies.
For acute experiments, we measured food intake and body weight over a 24-hour period in mice deprived of food for 24 hours that were habituated to the experimental setting (individually housed mice in metabolic chambers) for at least 7 days. Freely fed experimental mice were also studied in these metabolic chambers to quantify food and water intake and body weight after the acclimatization period. Another set of WT mice received an amount of food identical to that consumed by the FASKO mice (pair fed) for a period of 7 days. At the end of each experiment, animals were sacrificed, blood collected, and brains removed and processed. Ad libitum–feeding studies were also performed using a high-fat Western diet (fat content of 42%, TD88137; Harlan Teklad) (50). Food-intake data are expressed as a function of lean body mass (g0.75).
Analytical and biochemical analyses.
Measurements of serum glucose, free fatty acids, triglycerides, cholesterol, insulin, and leptin concentrations, body composition, and indirect calorimetry as well as glucose and insulin tolerance tests were performed as described (24, 50). FAS enzyme activity from freshly harvested tissues and malonyl-CoA content from rapidly harvested, flash-frozen hypothalamus were assayed as described (24, 33).
Quantitative RT-PCR–based gene expression.
RNA isolation, cDNA preparation, and real-time quantitative PCR were performed as described (24). Previously published oligonucleotide primer and TaqMan (Applied Biosystems) probe sequences for ribosomal protein L32, glucokinase, Glut2, PPARα, ACO, and CPT-1a were used (24). The following primer-probe sets were used: Cre (forward: tgttgccgcgccatctg; reverse: ttgcttcaaaaatcccttcca; probe: caccagccagctatcaactcgcg), FAS (forward: TCCTGGAACGAGAACACGATCT; reverse: GAGACGTGTCACTCCTGGACTTG; probe: CTCACGCTGCGGAAACTTCAGGA-AATG), MCD (forward: AACATCCAGGGCATTGTGAAG; reverse: gcggcgatcctgttcct; probe: agtgccctccgactgaaaccga), and Pdx-1 (forward: CGGCTGAGCAAGCTAAGGTT; reverse: TGGAAGAAGCGCTCTCTTTGA; probe: AGAATAACGAAAGGCGGCTGTT-GGAGG). Coamplification of the mRNA for the mouse ribosomal protein L32, an invariant internal control, was performed in all samples. Assays were performed in triplicate, and results normalized to L32 mRNA levels.
In situ hybridization.
Coronal hypothalamic sections (16 μm) were cut on a cryostat and immediately stored at –80°C until hybridization. Oligos specific for FAS (5′-GGGTCCATTGTGTGTGCCTGCTTGGGGTG-3′), AgRP (5′-CGACGCGGAGAACGAGACTCGCGGTTCTGTGGATCTAGCACCTC -3′), NPY (5′-GGGCGTTTTCTGTGCTTTCCTTCATTAAGAGGTCTG-3′), CART (5′-ACAGTCACACAGCTTCCCGATCCTGGCCCCTTTC-3′), POMC (5′-CTTGATGATGGCGTTCTTGAAGAGCGTCACCAGGGGCGTCTGGCTCTT-3′), MCH (5′-CCAACAGGGTCGGTAGACTCGTCCCAGCAT-3′), and orexin (5′-TTCGTAGAGACGGCAGGAACACGTCTTCTGGCGACA-3′) detection were used. These probes were 3′ end labeled with [α-35S] 2′-deoxyadenosine-5′-0-(1-thiotriphosphate) using terminal deoxynucleotidyl transferase (Amersham Biosciences). In situ hybridization was performed as described (32), using 8 animals per experimental group from 2 independent experiments.
Stereotaxic surgery and microinjection.
Cannulae were implanted i.c.v. under ketamine-xylazine anesthesia in WT and FASKO mice in the lateral ventricle (32). In other experiments, we implanted cannulae that were targeted bilaterally to the ventral hypothalamus directed to stereotaxic coordinates 1.6 mm posterior to the bregma, ± 0.4 mm lateral to the midline, and 5.8 mm below the surface of the skull as previously described (6). After surgery, animals were caged individually and allowed to recover for at least a week prior to any experiments to ensure their body weight and food intake had returned to baseline. Before Wy14,643 (Biomol) administration, 1 set of animals was fasted for 23.5 hours (6:00 pm to 5:30 pm) and another maintained under ad libitum feeding conditions.
Previously 23.5-hour–fasted WT and FASKO mice received a single i.c.v. injection of either Wy14,643 (15 μg dissolved in 2 μl of 20% dimethyl sulfoxide in artificial cerebrospinal fluid) or vehicle alone using a Hamilton syringe. Thirty minutes after injection, at the start of the dark cycle, chow was returned to the cages and food intake measured at 1, 2, 4, 12, and 24 hours. Body weight was measured immediately before the injection and at each of the above time points. At the end of the 24-hour refeeding period, each animal received an i.c.v. injection of 1 μl Evans blue dye (0.05% in artificial CSF) just before sacrifice. Only animals in which the dye was visualized within the third ventricle were included. We performed the study twice with a crossover design in which animals that received the drug initially also received a vehicle injection a week later.
Freely fed WT and FASKO mice received a single injection through bilaterally implanted cannulae of either Wy14,643 (10 μg dissolved in a total volume of 2 μl, i.e., 1 μl per side, of 20% dimethyl sulfoxide and 0.05% Evans blue dye in artificial CSF) or vehicle alone using a Hamilton syringe. Thirty minutes after injection, at the onset of the dark cycle, chow was returned to the cages and food intake measured at 4, 12, and 24 hours. Body weight was measured immediately before the injection and at each of the above time points. At the end of the 24-hour feeding period, animals were sacrificed, and the location of the cannulae was verified by noting the presence of Evans blue dye in the ventral hypothalamus. Only animals in which the dye was visualized in the hypothalamus were included in subsequent analyses.
β-galactosidase staining.
FAS-floxed mice with and without Cre were crossed with ROSA26 animals (The Jackson Laboratory) to assess the distribution of Cre recombinase. Animals were deeply anesthetized with i.p. injection of xylazine/ketamine cocktail and perfused with cold PBS, followed by cold 0.1 M PBS containing 4% paraformaldehyde. Brain and pancreas were dissected and fixed in 4% paraformaldehyde for 2 hours, then washed in PBS. Pancreata were frozen in Tissue-Tex OCT (Triangle Biomedical Sciences Inc.) compound. Brains were placed in 30% sucrose overnight, then frozen in OCT. Coronal cryostat sections (10 μm) were thaw mounted on slides, washed for 2 minutes in cold PBS, then placed in detergent buffer (2 mM MgCl2, 0.01% sodium deoxycholate, 0.02% IGEPAL [Calbiochem] in PBS, pH 7.4) for 15 minutes at room temperature, followed by staining solution (2 mM MgCl2, 0.01% sodium deoxycholate, 0.02% IGEPAL, 5 mM potassium ferricyanide, 5 mM potassium ferrocyanide in PBS, pH 7.4, containing 1 mg/ml of galactopyranoside dissolved in dimethyl formamide) overnight at 37°C. Cells positive for β-galactosidase indicated the presence of Cre.
Pancreas histomorphometry.
From euthanized FASKO and WT animals, the pancreas was dissected, fixed overnight in Bouin solution, embedded in paraffin, and sectioned, and 5-μm sections were mounted on slides. Dual immunofluorescence staining with anti-insulin (1:500; Sigma-Aldrich) and a mixture of anti-glucagon (1:800; Chemicon International), anti-pancreatic polypeptide (1:40; Chemicon International), and anti-somatostatin (1:200; Dako) antibodies was performed and visualized using the appropriate FITC and Texas red secondary antibodies (51). The β cell mass was calculated by point-counting morphometry from a minimum of 6 insulin-stained sections (5 μm) separated by 200 μm from 3–4 animals per genotype using the BIOQUANT Classic98 software package (version 3.50.6; BIOQUANT Image Analysis Corp.) as described (51).
Islet isolation and insulin secretion.
Pancreatic islets from WT and FASKO mice were isolated by collagenase digestion (52) and hand picked under a microscope. Ten islets per condition were cultured with 3 mM or 20 mM glucose, and insulin secreted in the medium was determined (52). Measurement of islet and whole pancreas insulin content was performed by acid-ethanol extraction (51, 52).
Fatty acid oxidation.
Finely minced (~0.5 mm thick) liver slices (150 mg) from freshly harvested livers of WT and FASKO mice were placed in 25-ml glass vials fitted with center wells containing 2 N NaOH and circular filter paper (1822-024; Whatman). Tissues were placed at the bottom of the vials in 2 ml of Krebs-Ringer buffer (pH 7.4) with 0.4% BSA and 1 μCi (57 mCi/mmol) of 14C-palmitate (CFA-23; Amersham Biosciences). Vials were capped with a rubber septum, and contents of the vial were gassed with 100% O2 for 10 minutes and incubated at 37°C for 2 hours on a rotatory shaker (100 strokes/min). Then, 2 ml of 6 N HCl was injected to release 14CO2. To ensure adequate transfer of 14CO2 to the NaOH-soaked filter paper in the center well, vials were left undisturbed overnight at room temperature. The filter paper was then transferred to scintillation fluid and counted. The rates of fatty acid oxidation were calculated as pmoles of 14C-palmitate oxidized per hour per mg of tissue.
Statistics.
Values are expressed as mean ± SEM. Statistical comparisons were performed using an unpaired, 2-tailed Student’s t test (when 2 groups were analyzed) or ANOVA. If the overall F value was found to be significant for the latter, comparisons between means were made using appropriate post-hoc tests.
Acknowledgments
We thank Kirk Pappan and Michael McDaniel for advice regarding pancreatic islet studies. This work was supported by NIH grants DK076729, P50 HL083762, AG20091, and NS057105; the Washington University Clinical Nutrition Research Unit (DK56341); and the Diabetes Research and Training Center (DK20579). Funding was also provided by the Marie Curie Program (QLK6-CT-2002-51671 to M. López) and by Astellas Pharma Inc., Tsukuba, Japan, and the Astellas USA Foundation (to M.D. Lane).
Footnotes
Nonstandard abbreviations used: ACO, acyl-CoA oxidase; AgRP, agouti-related protein; CART, cocaine-amphetamine–related transcript; CPT-1, carnitine palmitoyltransferase-1; FAS, fatty acid synthase; FASKO mice, mice lacking FAS in pancreatic β cells and a diffuse neuronal population within the hypothalamus; Glut2, glucose transporter 2; MCD, malonyl-CoA decarboxylase; MCH, melanin-concentrating hormone; NPY, neuropeptide Y; Pdx-1, pancreatic duodenal homeobox-1; POMC, proopiomelanocortin; RIPCre mice, mice expressing Cre under the control of the rat insulin 2 promoter.
Conflict of interest: C.F. Semenkovich has received lecture fees from Merck and Bristol-Myers Squibb.
Citation for this article: J. Clin. Invest. 117:2539–2552 (2007). doi:10.1172/JCI31183
References
- 1.Morton G.J., Cummings D.E., Baskin D.G., Barsh G.S., Schwartz M.W. Central nervous system control of food intake and body weight. Nature. 2006;443:289–295. doi: 10.1038/nature05026. [DOI] [PubMed] [Google Scholar]
- 2.Seeley R.J., Woods S.C. Monitoring of stored and available fuel by the CNS: implications for obesity. Nat. Rev. Neurosci. 2003;4:901–909. doi: 10.1038/nrn1245. [DOI] [PubMed] [Google Scholar]
- 3.Adams K.R., et al. Overweight, obesity, and mortality in a large prospective cohort of persons 50 to 71 years old. N. Engl. J. Med. 2006;355:763–778. doi: 10.1056/NEJMoa055643. [DOI] [PubMed] [Google Scholar]
- 4.Gelber R.P., Kurth T., Manson J.E., Buring J.E., Gaziano J.M. Body mass index and mortality in men: evaluating the shape of the association. Int. J. Obes. (Lond.). 2007 doi: 10.1038/sj.ijo.0803564. In press. [DOI] [PubMed] [Google Scholar]
- 5.Bouchard C. Inhibition of food intake by inhibitors of fatty acid synthase. N. Engl. J. Med. 2000;343:1888–1890. doi: 10.1056/NEJM200012213432511. [DOI] [PubMed] [Google Scholar]
- 6.Hu Z., Dai Y., Prentki M., Chohnan S., Lane M.D. A role for hypothalamic malonyl-CoA in the control of food intake. J. Biol. Chem. 2005;280:39681–39683. doi: 10.1074/jbc.C500398200. [DOI] [PubMed] [Google Scholar]
- 7.Obici S., Feng Z., Arduini A., Conti R., Rossetti L. Inhibition of hypothalamic carnitine palmitoyltransferase-1 decreases food intake and glucose production. Nat. Med. 2003;9:756–761. doi: 10.1038/nm873. [DOI] [PubMed] [Google Scholar]
- 8.Semenkovich C.F.Regulation of fatty acid synthase (FAS). 1997. . Prog. Lipid Res. 3643–53. [DOI] [PubMed] [Google Scholar]
- 9.Loftus T.M., et al. Reduced food intake and body weight in mice treated with fatty acid synthase inhibitors. Science. 2000;288:2379–2381. doi: 10.1126/science.288.5475.2379. [DOI] [PubMed] [Google Scholar]
- 10.Cha S.H., Hu Z., Chohnan S., Lane M.D. Inhibition of hypothalamic fatty acid synthase triggers rapid activation of fatty acid oxidation in skeletal muscle. Proc. Natl. Acad. Sci. U. S. A. 2005;102:14557–14562. doi: 10.1073/pnas.0507300102. [DOI] [PMC free article] [PubMed] [Google Scholar]
- 11.Cha S.H., Rodgers J.T., Puigserver P., Chohnan S., Lane M.D. Hypothalamic malonyl-CoA triggers mitochondrial biogenesis and oxidative gene expression in skeletal muscle: role of PGC1alpha. Proc. Natl. Acad. Sci. U. S. A. 2006;103:15410–15415. doi: 10.1073/pnas.0607334103. [DOI] [PMC free article] [PubMed] [Google Scholar]
- 12.Wortman M.D., Clegg D.J., D’Alessio D., Woods S.C., Seeley R.J. C75 inhibits food intake by increasing CNS glucose metabolism. Nat. Med. 2003;9:483–485. doi: 10.1038/nm0503-483. [DOI] [PubMed] [Google Scholar]
- 13.Woods S.C., Lotter E.C., McKay L.D., Porte D., Jr. Chronic intracerebroventricular infusion of insulin reduces food intake and body weight of baboons. Nature. 1979;282:503–505. doi: 10.1038/282503a0. [DOI] [PubMed] [Google Scholar]
- 14.Lin X., et al. Dysregulation of insulin receptor substrate 2 in β cells and brain causes obesity and diabetes. J. Clin. Invest. 2004;114:908–916. doi: 10.1172/JCI200422217. [DOI] [PMC free article] [PubMed] [Google Scholar]
- 15.Choudhury A.I., et al. The role of insulin receptor substrate 2 in hypothalamic and β cell function. J. Clin. Invest. 2005;115:940–950. doi: 10.1172/JCI200524445. [DOI] [PMC free article] [PubMed] [Google Scholar]
- 16.Herrero L., et al. Alteration of the malonyl-CoA/carnitine palmitoyltransferase I interaction in the beta cell impairs glucose-induced insulin secretion. Diabetes. 2005;54:462–471. doi: 10.2337/diabetes.54.2.462. [DOI] [PubMed] [Google Scholar]
- 17.Pocai A., et al. Restoration of hypothalamic lipid sensing normalizes energy and glucose homeostasis in overfed rats. J. Clin. Invest. 2006;116:1081–1091. doi: 10.1172/JCI26640. [DOI] [PMC free article] [PubMed] [Google Scholar]
- 18.Fukuda H., Iritani N., Sugimoto T., Ikeda H. Transcriptional regulation of fatty acid synthase gene by insulin/glucose, polyunsaturated fatty acid and leptin in hepatocytes and adipocytes in normal and genetically obese rats. Eur. J. Biochem. 1999;260:505–511. doi: 10.1046/j.1432-1327.1999.00183.x. [DOI] [PubMed] [Google Scholar]
- 19.Dudek S.M., Semenkovich C.F. Essential amino acids regulate fatty acid synthase expression through an uncharged transfer RNA-dependent mechanism. J. Biol. Chem. 1995;270:29323–29329. doi: 10.1074/jbc.270.49.29323. [DOI] [PubMed] [Google Scholar]
- 20.Semenkovich C.F., Coleman T., Goforth R. Physiologic concentrations of glucose regulate fatty acid synthase activity in HepG2 cells by mediating fatty acid synthase mRNA stability. J. Biol. Chem. 1993;268:6961–6970. [PubMed] [Google Scholar]
- 21.Shillabeer G., et al. Fatty acid synthase and adipsin mRNA levels in obese and lean JCR:LA-cp rats: effect of diet. J. Lipid Res. 1992;33:31–39. [PubMed] [Google Scholar]
- 22.Kovacs P., et al. A novel missense substitution (Val1483Ile) in the fatty acid synthase gene (FAS) is associated with percentage of body fat and substrate oxidation rates in nondiabetic Pima Indians. Diabetes. 2004;53:1915–1919. doi: 10.2337/diabetes.53.7.1915. [DOI] [PubMed] [Google Scholar]
- 23.Chirala S.S., et al. Fatty acid synthesis is essential in embryonic development: fatty acid synthase null mutants and most of the heterozygotes die in utero. Proc. Natl. Acad. Sci. U. S. A. 2003;100:6358–6363. doi: 10.1073/pnas.0931394100. [DOI] [PMC free article] [PubMed] [Google Scholar]
- 24.Chakravarthy M.V., et al. “New” hepatic fat activates PPARalpha to maintain glucose, lipid, and cholesterol homeostasis. Cell Metab. 2005;1:309–322. doi: 10.1016/j.cmet.2005.04.002. [DOI] [PubMed] [Google Scholar]
- 25.Pizer E.S., Wood F.D., Pasternack G.R., Kuhajda F.P. Fatty acid synthase (FAS): a target for cytotoxic antimetabolites in HL60 promyelocytic leukemia cells. Cancer Res. 1996;56:745–751. [PubMed] [Google Scholar]
- 26.Postic C., et al. Dual roles for glucokinase in glucose homeostasis as determined by liver and pancreatic beta cell-specific gene knock-outs using Cre recombinase. J. Biol. Chem. 1999;274:305–315. doi: 10.1074/jbc.274.1.305. [DOI] [PubMed] [Google Scholar]
- 27.Cui Y., et al. Essential role of STAT3 in body weight and glucose homeostasis. Mol. Cell. Biol. 2004;24:258–269. doi: 10.1128/MCB.24.1.258-269.2004. [DOI] [PMC free article] [PubMed] [Google Scholar]
- 28.Zambrowicz B.P., et al. Disruption of overlapping transcripts in the ROSA beta geo 26 gene trap strain leads to widespread expression of beta-galactosidase in mouse embryos and hematopoietic cells. Proc. Natl. Acad. Sci. U. S. A. 1997;94:3789–3794. doi: 10.1073/pnas.94.8.3789. [DOI] [PMC free article] [PubMed] [Google Scholar]
- 29.Gannon M., et al. Analysis of the Cre-mediated recombination driven by rat insulin promoter in embryonic and adult mouse pancreas. Genesis. 2000;26:139–142. doi: 10.1002/(sici)1526-968x(200002)26:2<139::aid-gene12>3.0.co;2-7. [DOI] [PubMed] [Google Scholar]
- 30.Lee J.Y., et al. RIP-Cre revisited, evidence for impairments of pancreatic beta-cell function. . J. Biol. Chem. 2006;281:2649–2653. doi: 10.1074/jbc.M512373200. [DOI] [PubMed] [Google Scholar]
- 31.Kim E.-K., et al. Expression of FAS within hypothalamic neurons: a model for decreased food intake after C75 treatment. Am. J. Physiol. Endocrinol. Metab. 2002;283:E867–E879. doi: 10.1152/ajpendo.00178.2002. [DOI] [PubMed] [Google Scholar]
- 32.López M., et al. Tamoxifen-induced anorexia is associated with fatty acid synthase inhibition in the ventromedial nucleus of the hypothalamus and accumulation of malonyl-CoA. Diabetes. 2006;55:1327–1336. doi: 10.2337/db05-1356. [DOI] [PubMed] [Google Scholar]
- 33.Hu Z., Cha S.H., Chohnan S., Lane M.D. Hypothalamic malonyl-CoA as a mediator of feeding behavior. Proc. Natl. Acad. Sci. U. S. A. 2003;100:12624–12629. doi: 10.1073/pnas.1834402100. [DOI] [PMC free article] [PubMed] [Google Scholar]
- 34.Moreno S., Farioli-Vecchioli S., Ceru M.P. Immunolocalization of peroxisome proliferator-activated receptors and retinoid X receptors in the adult rat CNS. Neuroscience. 2004;123:131–145. doi: 10.1016/j.neuroscience.2003.08.064. [DOI] [PubMed] [Google Scholar]
- 35.Xu Y., et al. The PPAR-alpha activator fenofibrate fails to provide myocardial protection in ischemia and reperfusion in pigs. Am. J. Physiol. Heart Circ. Physiol. 2006;290:H1798–H1807. doi: 10.1152/ajpheart.00631.2005. [DOI] [PMC free article] [PubMed] [Google Scholar]
- 36.Lee G.Y., Kim N.H., Zhao Z.S., Cha B.S., Kim Y.S. Peroxisomal-proliferator-activated receptor alpha activates transcription of the rat hepatic malonyl-CoA decarboxylase gene: a key regulation of malonyl-CoA level. Biochem. J. 2004;378:983–990. doi: 10.1042/BJ20031565. [DOI] [PMC free article] [PubMed] [Google Scholar]
- 37.Fu J., et al. Oleoylethanolamide regulates feeding and body weight through activation of the nuclear receptor PPAR-alpha. Nature. 2003;425:90–93. doi: 10.1038/nature01921. [DOI] [PubMed] [Google Scholar]
- 38.Brun T., et al. Evidence for an anaplerotic/malonyl-CoA pathway in pancreatic beta cell nutrient signaling. Diabetes. 1996;45:190–198. doi: 10.2337/diab.45.2.190. [DOI] [PubMed] [Google Scholar]
- 39.Osei-Hyiaman D., et al. Endocannabinoid activation at hepatic CB1 receptors stimulates fatty acid synthesis and contributes to diet-induced obesity. J. Clin. Invest. 2005;115:1298–1305. doi: 10.1172/JCI200523057. [DOI] [PMC free article] [PubMed] [Google Scholar]
- 40.Obici S., et al. Central administration of oleic acid inhibits glucose production and food intake. Diabetes. 2002;51:271–275. doi: 10.2337/diabetes.51.2.271. [DOI] [PubMed] [Google Scholar]
- 41.Lunzer M.A., Manning J.A., Ockner R.K. Inhibition of rat liver acetyl coenzyme A carboxylase by long-chain acyl coenzyme A and fatty acid. J. Biol. Chem. 1977;252:5483–5487. [PubMed] [Google Scholar]
- 42.Qian S., et al. Neither agouti-related protein nor neuropeptide Y is critically required for the regulation of energy homeostasis in mice. Mol. Cell. Biol. 2002;22:5027–5035. doi: 10.1128/MCB.22.14.5027-5035.2002. [DOI] [PMC free article] [PubMed] [Google Scholar]
- 43.Lee Y., et al. PPAR alpha is necessary for the lipopenic action of hyperleptinemia on white adipose and liver tissue. Proc. Natl. Acad. Sci. U. S. A. 2002;99:11848–11853. doi: 10.1073/pnas.182420899. [DOI] [PMC free article] [PubMed] [Google Scholar]
- 44.Shimada M., et al. Mice lacking melanin-concentrating hormone are hypophagic and lean. Nature. 1998;396:670–674. doi: 10.1038/25341. [DOI] [PubMed] [Google Scholar]
- 45.Marsh D.J., et al. Melanin-concentrating hormone 1 receptor-deficient mice are lean, hyperactive, and hyperphagic and have altered metabolism. Proc. Natl. Acad. Sci. U. S. A. 2002;99:3240–3245. doi: 10.1073/pnas.052706899. [DOI] [PMC free article] [PubMed] [Google Scholar]
- 46.Momose K., et al. Intracerebroventricularly administered corticotrophin-releasing factor inhibits food intake and produces anxiety-like behavior at very low doses in mice. Diabetes Obes. Metab. 1999;1:281–284. doi: 10.1046/j.1463-1326.1999.00033.x. [DOI] [PubMed] [Google Scholar]
- 47.Moller C., Sommer W., Thorsell A., Rimondini R., Heilig M. Anxiogenic-like action of centrally administered glucagon-like peptide-1 in a punished drinking test. Prog. Neuropsychopharmacol. Biol. Psychiatry. 2002;26:119–122. doi: 10.1016/s0278-5846(01)00223-8. [DOI] [PubMed] [Google Scholar]
- 48.Despres J.P., Golay A., Sjostrom L. Effects of rimonabant on metabolic risk factors in overweight patients with dyslipidemia. N. Engl. J. Med. 2005;353:2121–2134. doi: 10.1056/NEJMoa044537. [DOI] [PubMed] [Google Scholar]
- 49.Wozniak D.F., et al. Apoptotic neurodegeneration induced by ethanol in neonatal mice is associated with profound learning/memory deficits in juveniles followed by progressive functional recovery in adults. Neurobiol. Dis. . 2004;17:403–414. doi: 10.1016/j.nbd.2004.08.006. [DOI] [PubMed] [Google Scholar]
- 50.Tordjman K., et al. PPARα deficiency reduces insulin resistance and atherosclerosis in apoE-null mice. J. Clin. Invest. 2001;107:1025–1034. doi: 10.1172/JCI11497. [DOI] [PMC free article] [PubMed] [Google Scholar]
- 51.Bernal-Mizrachi E., Wen W., Stahlhut S., Welling C., Permutt M.A. Islet β cell expression of constitutively active Akt1/PKB induces striking hypertrophy, hyperplasia, and hyperinsulinemia. J. Clin. Invest. . 2001;108:1631–1638. doi: 10.1172/JCI200113785. [DOI] [PMC free article] [PubMed] [Google Scholar]
- 52.Pappan K.L., et al. Pancreatic beta-cell lipoprotein lipase independently regulates islet glucose metabolism and normal insulin secretion. J. Biol. Chem. 2005;280:9023–9029.. doi: 10.1074/jbc.M409706200. [DOI] [PubMed] [Google Scholar]


