Abstract
Cultures of neuroblasts that generate abundant neurons were established from Drosophila embryos to study silencing of genes by RNA interference (RNAi). Cultured cells expressed ELAV, a marker of neurons, Futsch, a marker of neurites, and Synapsin, Synaptobrevin, and Synaptogamin, proteins involved in neurotransmitter secretion. Conditions were found for efficient transfection of cells with siRNAs for ELAV or the insulin-like receptor, which resulted in marked decreases in neurons that express ELAV and Futsch. Cells also were successfully transfected with long-chain Sox-Neuro dsRNA resulting in a 55% reduction of neurons expressing Futsch. The results suggest that this cultured neural cell system can be used to study RNAi-dependent silencing of genes involved in many kinds of neural functions.
Keywords: ELAV, insulin receptor, neurites
Genome-wide RNAi screens using clonal lines of cultured Drosophila cells have been used to identify genes involved in cell growth and viability (1), signaling pathways (2–12), and factors required for bacterial infection (13). RNAi screens in intact Drosophila embryos also have been used to identify genes that play roles in neural development (14–15) and cardiac development (16).
We have been using RNAi to find genes that are involved in the assembly of the Drosophila embryonic nervous system. It is much easier and faster to screen tissue culture cells by RNAi by transfecting cells with double-stranded oligoribonucleotides (siRNA) or long-chain dsRNA than to laboriously inject embryos with RNA preparations. However, well differentiated, well characterized clonal lines of Drosophila neural cells are needed. As an alternative, we have dissociated neuroblasts (NBs) from Drosophila embryos and cultured them under conditions that result in an enriched population of NBs that generate abundant neurons in vitro and that can be transfected with siRNA or long-chain dsRNA with relatively high efficiency. Cultures enriched in NBs and neurons provide a means of studying molecular and cellular events during nervous system development (17). NB cultures have been used successfully to study gene expression during NB lineage development (18) and to explore mechanisms controlling asymmetric cell division and protein localization (19). Cultured Drosophila motor neurons also have been shown to form synapses with striated muscle cells (20). Specific cells have been removed from embryos with capillaries and have been grown in culture to study their development state (21), ion channels and responses to neurotransmitters, neuronal morphology, and action potential-dependent synaptic activity (22). K. Sepp also has screened cultured fluorescent Drosophila embryo neurons by RNAi (http://flyrnai.org).
Our main objective in this study has been to devise conditions that enable mass cultures of Drosophila neural cells to be used for RNAi-induced silencing of genes.
Results and Discussion
Drosophila embryos ≈5 h after fertilization (stage 10) were used to establish highly enriched NB cultures by a slight modification of published procedures (17–18) as described in Materials and Methods and in more detail in supporting information (SI) Materials and Methods. These NBs have been shown to express Hunchback, Pou-domain proteins 1 and 2 and Castor (17). An anti-ELAV monoclonal antibody and an anti-Futsch mAb, 22C10 (23), were used routinely to immunostain the cells. Embryonic lethal abnormal vision (ELAV) is localized predominantly within the nucleus, is expressed by all neurons, and is required for mRNA splicing, neuron differentiation, and maintenance (24). MAb 22C10 stains Futsch, which is expressed by a subset of neurons in the CNS and by all neurons in the peripheral nervous system (25). Futsch is found in dendrites, cell body cytoplasm, and axons, where it is associated with the cytoskeleton. Cells were stained with DAPI to visualize nuclei.
ELAV and Futsch Expression in Cultured Cells.
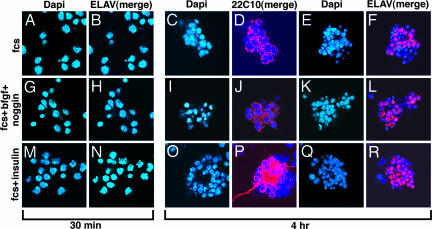
Shown in Fig. 1 are dissociated cells cultured for 30 min or 4 h in FCS; FCS, bFGF, and noggin; or FCS and insulin. After 30 min of culture, most of the cells were dispersed as single cells, and no cells expressed ELAV. After 4 h in culture, many cells remained as single cells, some cells underwent mitosis (data not shown), and a few cell aggregates or putative clones had formed. Most cells expressed Futsch and were stained with 22C10 (Fig. 1 D, J, and P); however, long neurites were extended only by neurons cultured in the presence of FCS and insulin (Fig. 1P). Most cells expressed ELAV, a marker of neurons (Fig. 1 F, L, and R). Cells cultured for 30 min represent the beginning of stage 11, and cells cultured 4 h represent stages 12 and 13. These data indicate that cultured cells express markers of neurons.
Fig. 1.
Expression of ELAV and Futsch in NBs after 30 min or 4 h in culture. A total of 280,000 cells in 0.1 ml of growth medium were plated on each coverslip, kept in 35-mm Petri dishes, and incubated for 30 min as described in Materials and Methods and SI Materials and Methods. Growth medium (1.9 ml) was added to each dish, followed, where indicated, by bFGF (40 ng/ml) and noggin (500 ng/ml) or insulin (5 μg/ml). After 30 min or 4 h incubation, cells were visualized by immunostaining with antibody to ELAV (1:100) or to Futsch, 22C10 (1:100), and nuclei were stained with DAPI (1 μg/ml). The secondary antibody used was Cy3 conjugated anti-mouse IgG (1:150).
ELAV Expression After Culture for 18 h.
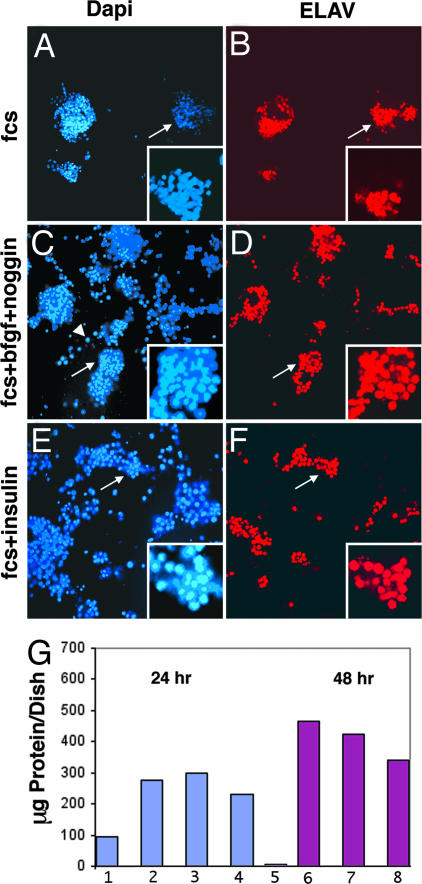
Shown in Fig. 2 are cells cultured for 18 h with FCS (Fig. 2 A and B); with FCS, bFGF, and noggin (Fig. 2. C and D); or with FCS and insulin (Fig. 2 E and F). Nuclei were stained with DAPI (Fig. 2 A, C, and E) and with an antibody directed against ELAV (Fig. 2 B, D, and F). The Inset in each image shows an enlarged view of the cell aggregate or clone indicated by an arrow. Cells cultured for 18 h with FCS formed few cell aggregates/clones (Fig. 2A); two large aggregates consisted of 94 and 69 DAPI-stained cells. Eighty to ninety percent of the cells were ELAV-positive; whereas, in a small aggregate with ≈35 DAPI-stained cells, only 50% were positive for ELAV (Fig. 2B). In the presence of FCS, bFGF, and noggin, the number of cells increased, and many cell aggregates of varying size were seen with 60–90% ELAV-positive cells (Fig. 2 C and D). The arrowhead in Fig. 2C points to a multinucleated muscle cell, which did not express ELAV. Only 0–10% of the cells in many small aggregates expressed ELAV. These cells did not differentiate into neurons and therefore were negative for ELAV. In the presence of FCS and insulin, a marked increase in the number of cells and in the formation of cell aggregates/clones can be seen (Fig. 2E), and 60–70% of the cells were ELAV-positive (Fig. 2F). These results show that many cells divide and give rise to neurons when cells are cultured in medium containing FCS, bFGF, and noggin, or FCS and insulin, whereas relatively few cells cultured in medium containing only FCS survive and give rise to neurons.
Fig. 2.
NB-to-neuron transition in 18-h cultures. The experiment in Fig. 1 was extended to 18 h. (A–F) Insets show a high magnification of a cell aggregate indicated by the arrow. In the presence of FCS alone (A and B) few cell aggregates were seen. In the presence of FCS, bFGF, and noggin (C and D), more cell aggregates and larger aggregates were seen. In C the arrowhead indicates a polynucleated muscle cell that was not stained by antibody to ELAV. There were more single cells in C–F compared with A and B. (G) The amounts of total protein in Petri dishes after 24 (1–4) or 48 h (5–8) are shown. In this experiment, 3.2 × 10⁶ cells were plated in 0.5 ml of growth medium directly in each 35-mm dish. The growth medium in all Petri dishes contained 10% FCS, streptomycin, and penicillin. Bars 2 and 6, the medium was supplemented with insulin; bars 3 and 7, Schneider's medium was supplemented by N-2 medium, which contains insulin; bars 4 and 8, the medium was supplemented with insulin, bFGF, and noggin. Protein was determined by the BCA method (Pierce).
The amount of protein recovered per dish from cells cultured for 24 or 48 h is shown in Fig. 2G. Relatively little protein was recovered from the dish containing cells that had been cultured for 24 h in medium supplemented only with FCS, and almost no protein was recovered after culturing cells for 48 h in this medium because dying cells had detached from the substratum and were removed when the medium was changed. The increases in protein found with cells cultured in FCS and insulin; FCS and N-2 supplement, which contains insulin; or FCS, insulin, bFGF, and noggin for 24 or 48 h agree well with the demonstration that the number of cells and neurons increase with time in culture. Western blots demonstrate that ELAV protein was present in all but one of the protein samples (data not shown here). However, too little protein was recovered from cells grown 48 h with only FCS to use for a Western blot.
Quantitation of data is shown in Table 1. For cells cultured for 4 h with FCS, for every 200 single cells counted there were two aggregates, consisting of 20–30 cells per aggregate, with 70–80% ELAV-positive cells. In the presence of FCS, bFGF, and noggin, four cell aggregates were found with 9–20 cells per aggregate and 80–90% of ELAV-positive cells in each aggregate. However, in the presence of FCS and insulin, there were four cell aggregates with 35–40 cells per aggregate, and 70–80% were ELAV-positive cells.
Table 1.
ELAV Expression in 4- and 18-h cultures
| Growth conditions | Single cells | ELAV-positive single cells | Cell aggregates | No. of cells per aggregate | ELAV-positive cells in aggregates, % |
|---|---|---|---|---|---|
| 4-h cultures | |||||
| FCS | 200 | 0 | 2 | 20–30 | 70–80 |
| FCS, bFGF, Noggin | 210 | 3 | 4 | 9–20 | 80–90 |
| FCS, insulin | 212 | 6 | 4 | 35–40 | 70–80 |
| 18-h cultures | |||||
| FCS | 15* | 0 | 4 | 20–30 | 80–90 |
| FCS, bFGF, Noggin | 110 | 20 | 12 | 50–80 | 60–90 |
| FCS, insulin | 105 | 40 | 10 | 50–80 | 60–70 |
*In the presence of FCS alone, many cells were floating and dead. Numbers shown are cells attached to the dishes. This experiment was done with triplicate coverslips. The experiment was repeated eight times, each time with triplicate coverslips.
Futsch Expression in 18-h Cultures.
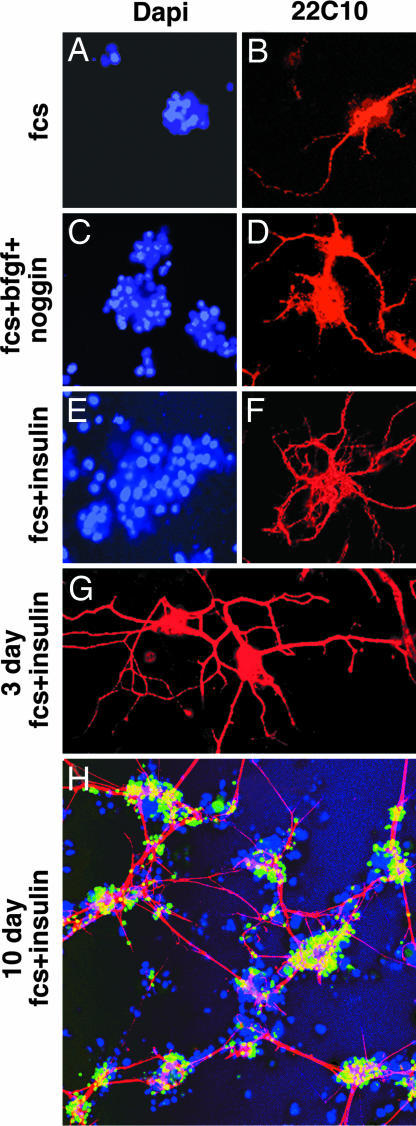
Most neurons cultured for 18 h lack neurites, but a few neurons did extend long processes (Fig. 3 A–F). Almost 60% of the cells cultured for 18 h in medium supplemented only with FCS were floating and dead. The remaining cell aggregates were small (Fig. 3A), and one or two long processes extended from some aggregates (Fig. 3B). In the presence of FCS, bFGF, and noggin, some cell aggregates (Fig. 3C) stained with mAB 22C10 and contained cells that extended long processes (Fig. 3D). However, more neurites were extended by cells cultured in the presence of FCS and insulin (Fig. 3 E and F). Neurons cultured 3 days in the presence of FCS and insulin extended long neurites that connected aggregates with one another (Fig. 3G). Cells cultured for 10 days in the presence of FCS and insulin exhibited striking neuronal morphology (Fig. 3H). Almost every cell aggregate contained neurons that extended neurites that connected the aggregates to one another. Many processes were thick and consisted of bundles of neurites. Cells were maintained in culture for up to 2 weeks and retained their long neurites and marked neuronal morphology. Longer time periods were not studied.
Fig. 3.
Morphological differentiation of neurons detected by immunostaining of Futsch with 22C10 antibody. The experiment is analogous to that of Fig. 2. Differences in the number and length of neurites were seen in cells cultured in different media. The amounts of additions were the same as stated in the legend to Fig. 1. (A–F) Compare cells grown in the presence of FCS alone (A and B), FCS, bFGF, and noggin (C and D), and FCS with insulin (E and F). (G and H) Three-day (G) and 10-day (H) cultures contained FCS and insulin. Growth medium with insulin was changed every 3rd day of culture. In A–G, mouse mAB 22C10 (1:100) and Cy3-conjugated anti-mouse secondary antibody were used. In the 10-day culture, the dilution of rat mAB directed against ELAV was 1:200, and mouse mAB 22C10 was 1:100. ELAV was detected by FITC-conjugated anti-rat IgG (1:150; green) and Futsch by Cy3-conjugated anti-mouse (1:150) secondary antibodies (red). Nuclei were stained blue with DAPI.
Characterization of Cultured Neurons.
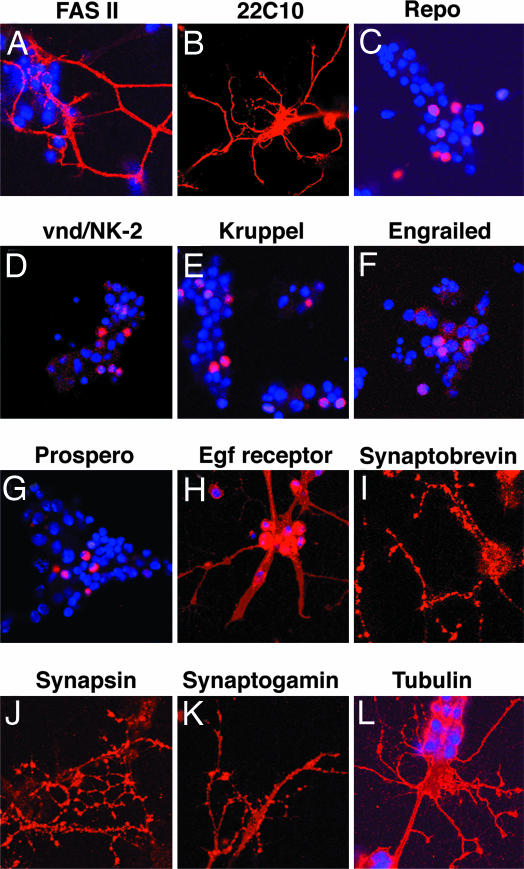
Shown in Fig. 4 are neural cells cultured for 24 h with FCS and insulin, stained with antibodies to different proteins. The cells were stained with DAPI and antibodies to various proteins, and positive cells were counted by confocal microscopy. Fas 2, which has been implicated in the adherence of growing axons to one another during neurite extension, stained some neurites (Fig. 4A). Futsch, stained by mAB 22C10, was expressed by many neurons in a cell aggregate (Fig. 4B). The presence of glial cells was shown by staining with Repo. Five percent of the cells expressed Repo (Fig. 4C). Expression of the vnd/NK-2 homeobox gene initiates neural development in the medial column of neuroectodermal cells that give rise mostly to medial NBs and neurons in the ventral nerve cord. Five percent of the cells expressed the Vnd/NK-2 homeodomain protein (Fig. 4D). Kruppel, a zinc-finger transcription factor, was expressed by 9% of the cells (Fig. 4E). Engrailed, a marker of posterior compartment cells, was expressed by 2% of the cells (Fig. 4F). Prospero, involved in the acquisition of cell polarity, was expressed by 10% of the cells (Fig. 4G). EGF receptors were detected on neurites and cell bodies as well as on a multinucleated muscle cell (Fig. 4H). Neurites and neuronal soma were stained with an antibody directed toward Synaptobrevin (Fig. 4I), a synaptic vesicle-associated membrane protein that is involved in vesicle transport and fusion of vesicles with the cell membrane. Synaptobrevin staining was punctuate on neurites. Synapsins are vesicle-associated proteins that can be phosphorylated and that participate in neurotransmitter release. Ninety to 100% of the neurites exhibited staining with anti-Synapsin antibody, with blebbing and button-like terminals stained on neurites (Fig. 4J). Another synaptic protein, Synaptotagmin (Fig. 4K), a major Ca2+ sensor protein for synaptic vesicle exocytosis also stained neurites. As shown in Fig. 4L, an antibody directed against β-tubulin stained neurites, neurite terminals, and cell soma. The results shown in Fig. 4 demonstrate that cultured cells express proteins characteristic of neurons, synapses, and glia.
Fig. 4.
Characterization of cultured neurons for the presence of cellular markers. A total of 200,000 cells in 100 μl of growth medium were plated on each coverslip and incubated as described in Materials and Methods and SI Materials and Methods. Insulin (5 μg/ml) was added, and after 24 h, coverslips were processed for immunostaining. Antibody dilutions are stated in Materials and Methods.
Shown in SI Fig. 7 are the effects of putative growth factors such as bFGF, noggin, BMP-4, EGF, putrescine, 20-0H-ecdysone, N2 supplement, or insulin on neurons cultured for 24 h.
Transfection with ELAV siRNA.
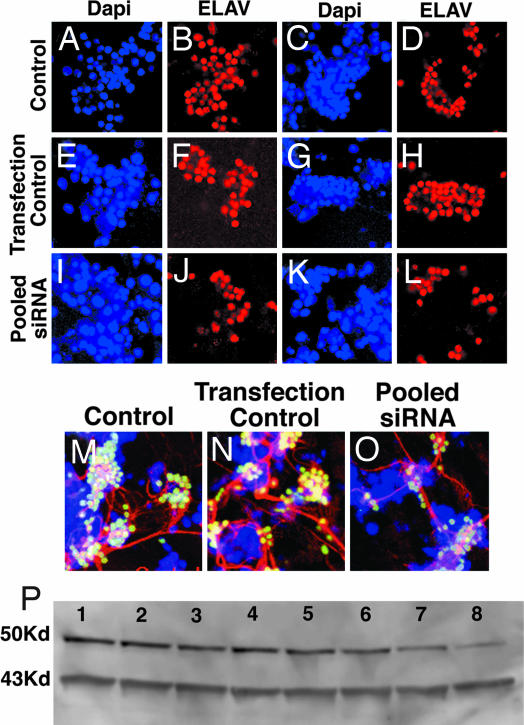
Cells were cultured with four pooled ELAV siRNAs to determine the effect of the siRNAs on ELAV expression by cells. Each siRNA duplex consisted of 19 nt of ELAV mRNA base-paired with a 19-nt antisense sequence. Each strand of siRNA had a 2-nt, single-stranded, 3′-overhang (26). The nucleotide sequences of ELAV siRNAs are shown in SI Materials and Methods. The results are shown in Fig. 5 and Table 2. In controls, 80–90% of DAPI-stained cells expressed ELAV (Fig. 5 A–D). There was a slight but insignificant decrease in ELAV-positive cells in transfection controls that contained Effectene but not siRNA (Fig. 5 E–H). We consistently observed a 45–50% decrease in ELAV-positive cells 48 h after transfection with four pooled species of ELAV siRNA (Fig. 5 I–L). Similar results were obtained when insulin was added at the time of transfection or 4 h after the start of transfection. The control and transfected control and four pooled siRNAs (Fig. 5 M–O, respectively) show the clusters of cells stained with a mAB rat antibody to ELAV and a secondary antibody, FITC-conjugated donkey anti-rat IgG (green). Futsch was stained with mouse mAB 22C10 and Cy3-conjugated goat anti-mouse IgG (red). Nuclei also were stained with DAPI (blue). There was a marked reduction in neurons expressing ELAV and neurites in cells transfected with four pooled species of siRNA (Fig. 5O) or with each single ELAV siRNA (data not shown). Western blots of ELAV from another experiment are shown in Fig. 5P. Cells (1.8 × 10⁶) were plated directly into each 35-mm Petri dish. The same amount of protein (35 μg) was applied to each lane. The Western blot data agrees well with the immunofluorescence data in Fig. 5 A–L. In the Western blot, a 37% reduction of ELAV protein was observed at a pooled siRNA concentration of 1.0 μg/ml, and further, progressive decreases in ELAV protein were found with 2 and 4 μg of ELAV siRNAs. Quantitation of the effect of pooled siRNAs on the percent of ELAV-positive cells (Fig. 5 A–G) is shown in Table 2. In the controls and transfection controls, 78–89% of cells expressed ELAV. Only 38–43% of the cells transfected with four pooled siRNAs expressed ELAV, an ≈50% decrease in cells that expressed ELAV. Quantitation of the effects of four pooled ELAV siRNAs on the percent of ELAV protein found by Western blot (Fig. 5P) is shown in Table 3. With 1, 2, and 4 μg of pooled ELAV siRNAs per ml, the percent of ELAV protein was 60%, 41%, and 30% of the control value, respectively.
Fig. 5.
Transfection of NBs with ELAV siRNA. A total of 200,000 cells in 100 μl of growth medium were plated on each coverslip and incubated for 30 min in the incubator as in Fig. 1. Growth medium (1.2 ml) was added to each dish, followed by the addition of 0.7 ml of transfection complex containing four pooled ELAV siRNAs at 100 nM, final concentration. Each dish was swirled to evenly spread the transfection agent. After 18 h, 1 ml of growth medium was removed and replaced with fresh medium. At 48 h after transfection, the coverslips were removed and processed for immunostaining. In the transfection control, Effectene was added but not siRNA. Cells were immunostained with antibody to ELAV alone (B, D, F, H, J, and L) or triple stained for ELAV (green), Futsch (red), and nuclei (blue) (M–O). In A, B, E, F, I, and J, insulin, was added after 30 min of incubation. In C, D, G, H, K, and L, insulin was added 4 h after transfection. Controls (A–D) and transfection controls (E–H) had growth medium with insulin, and transfection controls (E–H) had Effectene but not siRNA. Cells transfected with four pooled siRNA at 100 nM (1.3 μg/ml) final concentration are shown in I–L. A total of 1,800,000 cells in 500 μl of growth medium were plated directly in 35-mm Falcon dishes. A Western blot of ELAV protein after transfection with different concentrations of pooled ELAV siRNA is shown in P. Lane 1, control; lane 2, transfection control; (the rest of the lanes were from plates with pooled siRNAs) lane 3, 0.1 μg of siRNA; lane 4, 0.25 μg; lane 5, 0.5 μg; lane 6, 1 μg; lane 7, 2 μg; and lane 8, 4 μg/ml. After 30 min, the medium was decanted to remove floating cells, and 1.4 ml of growth medium with insulin (5 μg/ml) was added, followed by 600 μl of siRNA transfection complex. At 24 h transfection, 1 ml of medium was replaced with fresh growth medium and insulin. At 48 h after transfection, cells were collected and processed for Western blot as discussed in SI Materials and Methods. Equal amounts of protein (35 μg per well) were analyzed in each lane. ELAV, 50 Kd; actin, 43 Kd.
Table 2.
Effect of ELAV siRNAs on ELAV expression
| Addition | Total cells | ELAV-positive cells | ELAV-positive cells, % |
|---|---|---|---|
| Insulin added at start of transfection | |||
| Control | 54 | 48 | 89 |
| Transfection control | 45 | 35 | 78 |
| Four pooled ELAV siRNAs | 55 | 21 | 38 |
| Insulin added 4 h after start of transfection | |||
| Control | 50 | 40 | 87 |
| Transfection control | 45 | 39 | 87 |
| Four pooled ELAV siRNAs | 55 | 24 | 43 |
This experiment was done with triplicate coverslips. The experiment was repeated eight times, each time with triplicate coverslips.
Table 3.
Effect of ELAV siRNAs on ELAV protein
| Additions | ELAV protein, % |
|---|---|
| Control | 100 |
| Effectine, minus siRNA, control | 95 |
| 0.1 μg/ml pooled ELAV siRNAs | 76 |
| 0.25 μg/ml pooled ELAV siRNAs | 79 |
| 0.5 μg/ml pooled ELAV siRNAs | 80 |
| 1.0 μg/ml pooled ELAV siRNAs | 60 |
| 2.0 μg/ml pooled ELAV siRNAs | 41 |
| 4.0 μg/ml pooled ELAV siRNAs | 30 |
Transfection with Insulin Receptor siRNA.
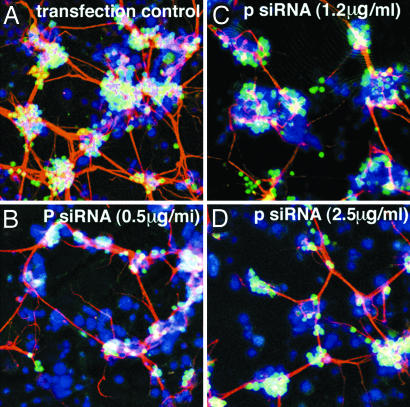
Insulin receptors in neural tissue have been implicated in normal and abnormal physiology (27). Drosophila has one insulin receptor tyrosine kinase, which is expressed throughout the fly life cycle and is required for viability and female fertility (28–30). Inr appears to be required because development of the cuticle, as well as the peripheral nervous system and CNS are affected by Inr mutations (29). The Drosophila insulin receptor has been shown to function in axon guidance and is required for photoreceptor cell axons to find their way from the retina to the brain during development of the visual system (31). The insulin receptor signaling pathway plays an important role in the differentiation of neurons. Our results, as well as those of others, show that Drosophila embryonic NBs do not survive in culture beyond 24 h in the absence of insulin (Fig. 2), and neurons in most aggregates do not extend long neurites. The transfection control is shown in Fig. 6A. Shown in Fig. 6 B–D are cells after transfection with 0.5, 1.2, or 2.5 μg/ml concentrations of four pooled insulin receptor siRNAs. Nuclei, ELAV, and Futsch are stained. The transfection procedure was the same as that for ELAV siRNA (Fig. 5). Considerable decreases in neurites were seen in the presence of different concentrations of pooled siRNA (Fig. 6 B–D) and also with individual siRNAs (data not shown). In some cases, the clusters of cell bodies were smaller, and the neurites were thinner compared with the transfection control.
Fig. 6.
Transfection of NBs with insulin receptor siRNA. Conditions were similar to those in Fig. 5. At 48 h after transfection, cells on coverslips were triple labeled as in Fig. 5.
Transfection with dsRNA.
Shown in SI Fig. 8 are pictures of neurons 48 h after transfection with long-chain dsRNA. Low-magnification (×10) pictures are shown to visualize a large field of cells. We observed an ≈50% decrease in cells immunostained for Futsch with 22C10 when dsRNA corresponding to Sox-Neuro (Fig. 2 C and D) or to Sox-Neuro and Dicheate (Fig. 2 G and H) were used. There was no significant decrease in neurons expressing Futsch due to the addition of dsRNA corresponding to Dicheate (Fig. 2 E and F), slit (Fig. 2 I and J) or Fra (Fig. 2 K and L).
Conclusions.
The great advantage of the neural culture system described in this report is that most genes normally expressed in the nervous system of the Drosophila embryo may also be expressed in these cultured cells. The cultured neurons were shown to express proteins such as Synapsin, Synaptobrevin, and Synaptogamin, which are involved in neurotransmitter secretion at synapses. We have shown that siRNA can be used to decrease the expression of neural proteins such as ELAV and Futsch by the cultured cells and that long-chain dsRNA can be used to decrease the expression of Futsch. The results suggest that these neural cultures can be used for RNAi screens for other genes involved in neural properties and can also be used to explore the functions of the corresponding proteins. A disadvantage of the system is that many types of neurons and glia are probably present, and an RNAi induced phenotype expressed by only a small fraction of the cells may not be detected. However, the cultured cell system should be useful for many types of RNAi screens.
Materials and Methods
Cell Culture.
Neuroblasts were dissociated from stage 10 Drosophila embryos and cultured by slight modifications of published procedures (17, 18). Details are described in SI Materials and Methods. Growth medium consisted of Schneider's medium (GIBCO–BRL, Carlsbad, CA), 10% FCS (HyClone, Logan, UT) unless specified otherwise, 5 μg/ml insulin (GIBCO-BRL) used where specified, 100 μg/ml streptomycin, and 100 units/ml penicillin (HyClone).
Transfection with siRNA.
Effectene transfection agent (Qiagen, Valencia, CA) was used as described in the manufacturer's instructions. In brief, 1–2 × 10⁵ cells in 100 μl of growth medium were plated on each glass coverslip (No. 1, 12-mm, round; Fisher, Pittsburgh, PA), and each coverslip was placed in a 35-mm Falcon Petri dish and incubated at 25°C for 30 min to allow the NBs to attach to the coverslip. Then 1.2 ml of growth medium was added to each dish, and the dish was rocked to remove nonadherent cells. siRNAs were dissolved in siRNA buffer (supplied by the manufacturer) at a concentration of 20 pmol/μl for pooled siRNA and 50 pmol/μl for single siRNAs. These were diluted further with buffer EC (Qiagen). Enhancer (Qiagen) (8.0 μl per 1.0 μg of siRNA) was added. The solution was mixed by vortexing for 1 sec and incubated for 3 min at room temperature. The final volume was 100 μl. The tubes were centrifuged for a few seconds, and 10 μl of Effectene transfection agent was added. Samples were mixed by pipetting up and down five times and incubated for 10 min at room temperature to allow the transfection complex to form. Immediately before addition to the dishes, 0.7 ml of growth medium was added to the complex, and the mixture was added drop-wise onto the cells on the coverslip in each dish containing 1.3 ml of medium with insulin. Each dish was gently swirled to mix the medium and incubated at 25°C in 95% air, 5% CO2 for 24 h, and then 1 ml of medium was replaced with fresh growth medium containing insulin. At 48 h after the start of transfection, coverslips were processed for indirect immunofluorescence. Conditions for transfection with long-chain dsRNA are given in the legend to SI Fig. 8.
Supplementary Material
Acknowledgments
We thank Dr. Christian A. Combs [Confocal Microscope Core Facility, National Heart, Lung, and Blood Institute (NHLBI)] for help with the confocal microscope and the Proteomics core facility of NHLBI for scanning of Western blots. The antibody to Kruppel was a gift from Drs. C. Alonso (University of Cambridge, Cambridge, U.K.) and J. Reinitz (Mt. Sinai School of Medicine, New York, NY) and antibodies to synapsin, synaptogamin, and synaptobrevin were gifts from Dr. H. Bellen (Baylor College of Medicine, Houston, TX). We thank Dr. Brian Mozer for dsRNAs and Dr. Ruth Johnsson Hegyeli and Dr. G. Morosco of the International Program of the NHLBI for financial assistance (to S.K.S.). We thank Ms. J. Povey for help in the preparation of the manuscript.
Abbreviations
- ELAV
embryonic lethal abnormal vision
- NB
neuroblasts.
Footnotes
The authors declare no conflict of interest.
This article contains supporting information online at www.pnas.org/cgi/content/full/0704299104/DC1.
References
- 1.Heidelberg Fly Consortium. Boutros M, Kiger AA, Armknecht S, Kerr K, Hild M, Koch B, Haas SA, Consortium HF, Paro R., Perrimon N. Science. 2004;303:832–835. doi: 10.1126/science.1091266. [DOI] [PubMed] [Google Scholar]
- 2.Clemens JC, Worby CA, Simonson-Leff N, Muda M, Maehama T, Hemmings BA, Dixon JE. Proc Natl Acad Sci USA. 2000;97:6499–6503. doi: 10.1073/pnas.110149597. [DOI] [PMC free article] [PubMed] [Google Scholar]
- 3.Caplen NJ, Fleenor J, Fire A, Morgan RA. Gene. 2000;252:95–105. doi: 10.1016/s0378-1119(00)00224-9. [DOI] [PubMed] [Google Scholar]
- 4.Lum L, Yao S, Mozer B, Rovescalli A, Von Kessler D, Nirenberg M, Beachy PA. Science. 2003;299:2039–2045. doi: 10.1126/science.1081403. [DOI] [PubMed] [Google Scholar]
- 5.Matsubayashi H, Sese S, Lee JS, Shirakawa T, Iwatsubo T, Tomita T, Yanagawa S. Mol Cell Biol. 2004;24:2012–2024. doi: 10.1128/MCB.24.5.2012-2024.2004. [DOI] [PMC free article] [PubMed] [Google Scholar]
- 6.Eggert US, Kiger AA, Richter C, Perlman ZE, Perrimon N, Mitchison TI, Field CM. PLOS Biology. 2004;2:2135–2143. doi: 10.1371/journal.pbio.0020379. [DOI] [PMC free article] [PubMed] [Google Scholar]
- 7.DasGupta R, Kaykas A, Moon RT, Perrimon N. Science. 2005;308:826–833. doi: 10.1126/science.1109374. [DOI] [PubMed] [Google Scholar]
- 8.Nybakken K, Vokes SA, Lin T-Y, McMahon AP, Perrimon N. Nat Genet. 2005;37:1323–1332. doi: 10.1038/ng1682. [DOI] [PMC free article] [PubMed] [Google Scholar]
- 9.Baeg G-H, Zhou R, Perrimon N. Genes Dev. 2005;19:1861–1870. doi: 10.1101/gad.1320705. [DOI] [PMC free article] [PubMed] [Google Scholar]
- 10.Friedman A, Perrimon N. Nature. 2006;444:230–234. doi: 10.1038/nature05280. [DOI] [PubMed] [Google Scholar]
- 11.March JC, Bentley WE. Biotechnol Bioeng. 2006;95:645–652. doi: 10.1002/bit.20951. [DOI] [PubMed] [Google Scholar]
- 12.Dorner S, Lum L, Kim M, Paro R, Beachy PA, Green R. Proc Natl Acad Sci USA. 2006;103:11880–11885. doi: 10.1073/pnas.0605210103. [DOI] [PMC free article] [PubMed] [Google Scholar]
- 13.Agaisse H, Burrack LS, Philips JA, Rubin EJ, Perrimon N, Higgins DE. Science. 2005;309:1248–1251. doi: 10.1126/science.1116008. [DOI] [PubMed] [Google Scholar]
- 14.Ivanov AI, Rovescalli AC, Pozzi P, Yoo S, Mozer B, Li HP, Yu SH, Higashida H, Guo V, Spencer M, Nirenberg M. Proc Natl Acad Sci USA. 2004;101:16216–16221. doi: 10.1073/pnas.0407188101. [DOI] [PMC free article] [PubMed] [Google Scholar]
- 15.Koizumi K, Higashida H, Yoo S, Islam MS, Ivanov AI, Guo V, Pozzi P, Yu S-H, Rovescalli AC, Tang D, Nirenberg M. Proc Natl Acad Sci USA. 2007;104:5626–5631. doi: 10.1073/pnas.0611687104. [DOI] [PMC free article] [PubMed] [Google Scholar]
- 16.Yong-Ou K, Park S-I, Balaban RS, Nirenberg M, Kim Y. Proc Natl Acad Sci USA. 2004;101:159–164. doi: 10.1073/pnas.0307205101. [DOI] [PMC free article] [PubMed] [Google Scholar]
- 17.Brody T, Odenwald WF. Dev Biol. 2000;226:34–44. doi: 10.1006/dbio.2000.9829. [DOI] [PubMed] [Google Scholar]
- 18.Broadus J, Doe CQ. Curr Biol. 1997;7:827–835. doi: 10.1016/s0960-9822(06)00370-8. [DOI] [PubMed] [Google Scholar]
- 19.Furst A, Mahowald AP. Dev Biol. 1985;109:184–192. doi: 10.1016/0012-1606(85)90359-8. [DOI] [PubMed] [Google Scholar]
- 20.Seecof RL, Teplitz RL, Gerson I, Ikeda K, Donady JJ. Proc Natl Acad Sci USA. 1972;69:566–570. doi: 10.1073/pnas.69.3.566. [DOI] [PMC free article] [PubMed] [Google Scholar]
- 21.Luer K, Technau GM. Development (Cambridge, UK) 1992;116:377–385. doi: 10.1242/dev.116.2.377. [DOI] [PubMed] [Google Scholar]
- 22.Kuppers-Munther B, Letzkus JJ, Luer K, Technau G, Schmidt H, Prokop A. Dev Biol. 2004;269:459–478. doi: 10.1016/j.ydbio.2004.01.038. [DOI] [PubMed] [Google Scholar]
- 23.Fujita SC, Zipursky SL, Benzer S, Ferrus A, Shotwell SL. Proc Natl Acad Sci USA. 1982;79:7929–7933. doi: 10.1073/pnas.79.24.7929. [DOI] [PMC free article] [PubMed] [Google Scholar]
- 24.Robinow S, White K. J Neurobiol. 1991;22:443–461. doi: 10.1002/neu.480220503. [DOI] [PubMed] [Google Scholar]
- 25.Hummel T, Krukkert K, Roos J, Davis G, Klambt C. Neuron. 2000;26:357–370. doi: 10.1016/s0896-6273(00)81169-1. [DOI] [PubMed] [Google Scholar]
- 26.Elbashir SM, Harborth J, Lendeckel W, Yalcin A, Weber K, Tuschl T. Nature. 2001:411–498. doi: 10.1038/35078107. [DOI] [PubMed] [Google Scholar]
- 27.Brogiolo W, Stocker H, Ikeya T, Rintelen F, Fernandez R, Hafen E. Curr Biol. 2001;11:213–222. doi: 10.1016/s0960-9822(01)00068-9. [DOI] [PubMed] [Google Scholar]
- 28.Stocker H, Hafen E. Curr Opin Genet Dev. 2000;10:529–535. doi: 10.1016/s0959-437x(00)00123-4. [DOI] [PubMed] [Google Scholar]
- 29.Fernandez R, Tabarini D, Azpiazu N, Frasch M, Schlessinger J. EMBO J. 1995;14:3373–3384. doi: 10.1002/j.1460-2075.1995.tb07343.x. [DOI] [PMC free article] [PubMed] [Google Scholar]
- 30.Kapahi P, Zid BM, Harper T, Koslover D, Sapin V, Benzer S. Curr Biol. 2004;14:885–890. doi: 10.1016/j.cub.2004.03.059. [DOI] [PMC free article] [PubMed] [Google Scholar]
- 31.Song J, Wu L, Chen Z, Kohanski RA, Pick L. Science. 2003;300:502–505. doi: 10.1126/science.1081203. [DOI] [PubMed] [Google Scholar]
Associated Data
This section collects any data citations, data availability statements, or supplementary materials included in this article.


