Abstract
The complex architecture of bacterial biofilms inevitably raises the question of their design. Microstructure of developing Escherichia coli biofilms was analyzed under static and laminar flow conditions. Cell attachment during early biofilm formation exhibited periodic density patterns that persisted during development. Several models for the origination of biofilm microstructure are considered, including an activator-inhibitor or Turing model.
Microbes colonize surfaces and form biofilms in a variety of natural and artificial systems, apparently to provide protection against deleterious conditions (5, 6, 24, 30, 35). As self-organized communities, bacterial biofilms exhibit complex structures consisting of cells embedded in an extracellular polysaccharide matrix (references 8, 13, and 24 and references therein). While protecting individual cells, the biofilm structure should permit efficient exchange of nutrients, waste products, and signaling molecules (25, 29, 33-35). Mass transfer between cells inside these structures and the environment is based primarily on diffusion. Thus, the complex three-dimensional structures observed in certain biofilms, including pillars, mushroom-like and tree-like structures, valleys and channels, or combinations thereof, may improve mass exchange based on hydrodynamic flow (25). Spatial features of the biofilm no doubt reflect the particular species and its environment and in part define the biofilm phenotype (24, 29, 35).
The present study analyzes the periodicity of the Escherichia coli biofilm microstructure. A stable csrA insertion mutant (TR1-5MG1655 [28]) of the wild-type strain MG1655 was primarily utilized in these studies because it exhibits accelerated, though structurally typical, biofilm formation (12, 13). The csrA gene encodes a small RNA binding protein that functions as a global regulator for E. coli and other bacteria (reviewed in reference 27). The primary effect of the csrA mutation on biofilm formation is to enhance glycogen biosynthesis at the transition to stationary-phase growth and subsequent glycogen catabolism (1, 28, 39), which may provide precursor(s) for adhesins and/or other components (13). Essentially identical patterns were seen with other E. coli strains, including the csrA wild-type strain; see below.
Patterns under static conditions.
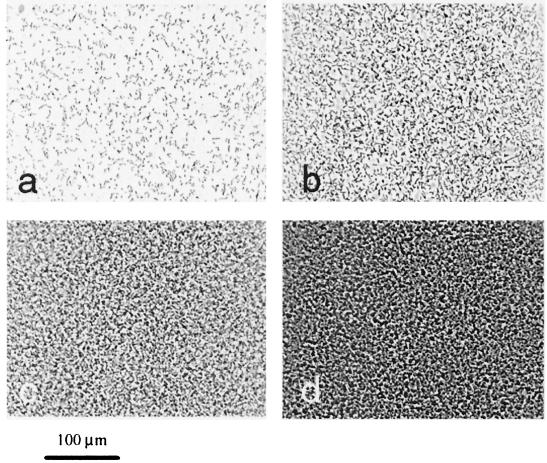
Bacteria were cultured in Luria-Bertani medium (19) overnight at 37°C with shaking and used to inoculate (1:100) biofilm cultures, which were grown at 26°C in colonization factor antigen (CFA) medium (per liter, 10 g of Casamino Acids [Difco, Detroit, Mich.], 1.5 g of yeast extract [Difco], 50 mg of MgSO4, 5 mg of MnCl2 [pH 7.4]) (13). Sterile poly-l-lysine-treated coverslips were placed into a petri dish containing 50 ml of a freshly inoculated medium. Poly-l-lysine is a widely used to improve adhesion of eucaryotic cells and tissues to substrates (e.g., see reference 11), and it was found to stabilize the attachment of E. coli biofilm to glass, without affecting the cell attachment patterns (data not shown). Attached cells were examined after removing the coverslips from the medium and gently rinsing with phosphate buffer. The coverslip was inverted over a Parafilm gasket on a microscope slide, and the cells were observed in phase contrast using an Olympus BX60 microscope (Thornwood, N.Y.). Images were recorded with a COHU-4910 CCD camera (COHU, Inc., Florence, Ky.) connected to a frame-grabber board (GMS500; Scion Corporation, Frederick, Md.), installed in a personal computer. All image processing used Image Pro-Plus 4.1 software (MediaCybernetics, Silver Spring, Md.). Figure 1 shows cell attachment to coverslips during biofilm development. After 2 h, many of the cells were attached to the glass surface, not to each other (Fig. 1a). Later, the cell distribution showed alternating sites of densely and sparsely attached bacteria (Fig. 1b). Finally, the surface became completely obscured (Fig. 1c to d).
FIG. 1.
Biofilm development on poly-l-lysine-treated glass supports. A csrA::kanR mutant of MG1655 was grown at 26°C in a petri dish containing CFA medium and allowed to attach to coverslips. Micrographs (×40 objective) of attached cells in panels a to d were taken after 2, 4, 8, and 16 h of growth, respectively.
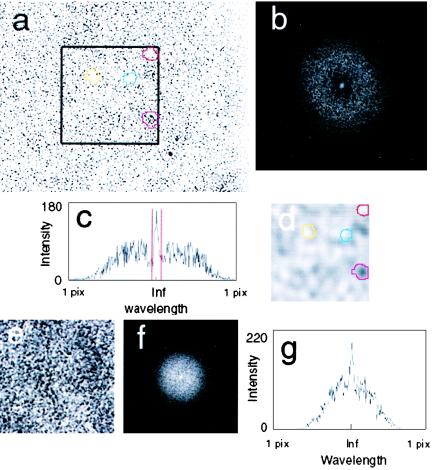
The pattern of cell attachment in a biofilm monolayer was quantitatively examined (Fig. 2). A digital image (Fig. 2a) was analyzed by two-dimensional fast Fourier transform (FFT) (Fig. 2b). The choice of this approach was dictated by the fact that periodic structures, regardless of their nature, can be characterized by a typical wavelength. Hence, spatial spectral analysis is an extremely powerful tool to quantify a spatial order. While FFT has not been used previously for the analysis of biofilm structure, it has been useful for analysis of the periodicity of bioconvection patterns of motile bacteria (3, 7). The FFT image (Fig. 2b) consisted of a bright spot at the center of the coordinate system, surrounded by a dispersed ring, representative of wavelengths existing in the system. The distance between each point of the transform field to the center of the coordinate system corresponds to the particular spatial frequency (inversely, the wavelength). A zero frequency point in the center of the coordinate system corresponds to the infinite wavelength (realistically, to the size of the entire image), and the most distal points correspond to the maximal frequency or minimal wavelength of a single pixel. The wide, bright, symmetrical ring on the FFT image of the biofilm microphotograph corresponds to distinct small-wavelength objects, i.e., bacterial cells. The symmetry of the spectrum reflects the fact that the cells are distributed isotropically. The central bright spot corresponds to the longer wavelengths present in the pattern. This part of FFT spectrum shows the spatial order in which cells are attached to the supporting glass surface. Note the relative lack of intermediate wavelengths between the average bacterial size and the characteristic spatial distribution length, evidenced by a dark circular band. This reveals that cell distribution is nonrandom; otherwise, a continuous spectrum would result. The intensity profile of the two-dimensional FFT spectrum, taken horizontally through its center, is shown in Fig. 2C. This panel also highlights, in red, the boundary for the low-pass operation (described below). For comparison, the FFT spectrum and its profile from a quasi-random pattern are shown (Fig. 2e, f, and g). The image for this analysis (Fig. 2e) was obtained by growing the biofilm until the surface of the coverslip was completely obscured, before the cells were photographed.
FIG. 2.
FFT analysis of cell distribution at the glass surface. (a) A digitized micrograph (×32 objective) of a biofilm at 4 h of growth. (b) Two-dimensional FFT spectrum of the data from panel a. (c) One-dimensional FFT spectrum, obtained from an intensity profile measured by a horizontal line that bisects the image of panel b. (d) The cell density pattern obtained by low-pass and reverse-transform operations. Note four distinct regions of cell density, highlighted in color, and the corresponding regions that are indicated in the micrograph of panel a. (e) An example of a quasi-random cell distribution: micrograph of the biofilm (×40 objective) obtained after 24 h of growth with obscured multiple layers of cells. (f) Two-dimensional FFT spectrum of data from panel e. (g) One-dimensional FFT spectrum obtained from an intensity profile of image of panel f, generated as in panel c.
To allow better visualization of the cell density pattern, the outer, high-frequency part of the FFT spectrum was eliminated by a low-pass operation. The boundary for the low-pass operation was set at 10% of the amplitude of the central bright spot after subtraction of background intensity. The filtered spectrum was then subjected to inverse transform (Fig. 2d). The resulting pattern directly reflects the density distribution of attached cells. It is similar to the electron density cloud of an atom or molecule, which shows the probability of finding an electron at a given position at any given time. Corresponding regions are marked in color to illustrate the direct correlation between areas of low or high cell attachment and low or high density distribution (Fig. 2a and d). The estimated characteristic wavelength of this pattern was 13 μm. Such patterns were typical of developing monolayer biofilms. Note that earlier attachment patterns exhibited longer wavelengths, e.g., ∼20 μm for the image in Fig. 1a (data not shown). FFT is not a unique way to derive cell density distribution. Any image-processing filter with a low-pass option capable of suppressing small details should produce a similar pattern.
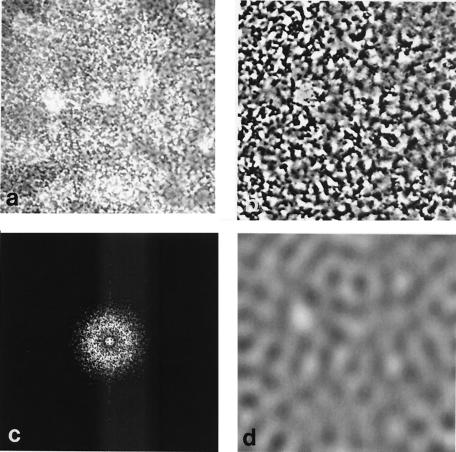
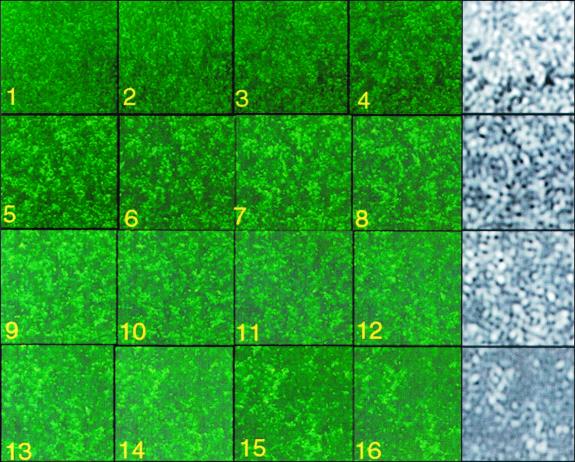
A periodic pattern of cell distribution also was observed in more mature, three-dimensional biofilms (Fig. 3). The uppermost cells of the image are in sharp focus and appear as distinct dark stripes on a gray, granular background of lower cells (3a). The former cells exhibit a surprisingly clear distribution pattern. Part of the image in Fig. 3a was magnified, and its contrast was enhanced to emphasize the uppermost cells (Fig. 3b). Then, FFT was applied (Fig. 3c), as described above. Subsequent low-pass operation and inverse transform revealed a pattern with a wavelength of 10.2 μm (Fig. 3d), close to that observed for a monolayer (Fig. 2). Next, the internal structure of a ∼30-μm-thick, 48-h biofilm was visualized by staining cells with acridine orange and examining the biofilm with confocal laser scanning microscopy (CLSM) using a Zeiss LSM 410 microscope containing a ×40 1.2-numerical aperture C-Apochromat objective lens. Excitation and emission wavelengths were 488 and 510 to 525 nm, respectively. Optical sections are shown in color in Fig. 4. Spatial Fourier transform analysis of a series of images from this biofilm showed a characteristic wavelength of 11.5 ± 1 μm from 2 μm up to a distance of 20 to 25 μm from the substrate, at which point the structure became more open. Cell densities after the low-pass operation are shown in black and white. These images resemble sections taken through a sponge; the wavelength of the pattern remains constant throughout most of the internal structure, although the precise density distribution varies.
FIG. 3.
Periodic cell patterns from a multilayer biofilm. (a) Transmission light micrograph (×40 objective) of a 24-h biofilm, grown as in Fig. 1. (b) A contrast-enhanced portion of the image in panel a. (c) FFT spectrum of the image in panel b. (d) Cell density pattern after applying the low-pass and reverse-transform operations.
FIG. 4.
CLSM images of the cell distribution within a thick biofilm. Color panels (1 to 16) show optical sections parallel to the substrate starting at a distance of 2 μm and proceeding at 2-μm increments. Density distribution after FFT and low-pass operation for panels 4, 8, 12, and 16 are shown immediately to the right, in black and white.
Essentially the same cell attachment patterns were obtained for the csrA wild-type strain (MG1655), a clinical isolate, E. coli P18, which was obtained from a biofilm-colonized urinary catheter (13, 16), and a nonmotile (ΔmotB) mutant of TR1-5MG1655 (13; also data not shown). These biofilms were analyzed only during early development, because of their relatively weaker attachment and slower growth. Similar patterns were also evident for the csrA mutant on both untreated or poly-l-lysine-treated glass, as well as polystyrene, indicating that they are not surface specific (data not shown).
Patterns under laminar flow.
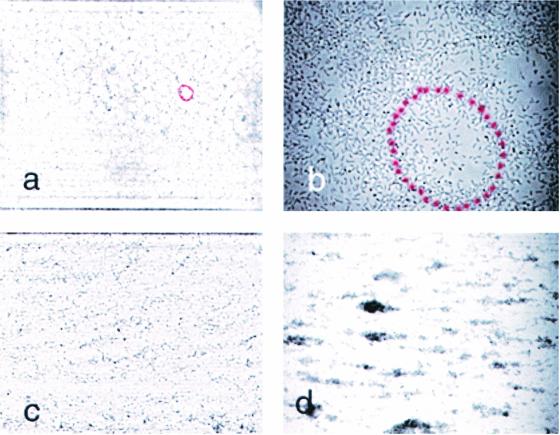
Biofilm formation in CFA medium under laminar flow conditions was investigated in a Stovall flow cell (Life Science, Inc., Greensboro, N.C.) fitted to the stage of the Olympus BX60 microscope. The channels (1 mm high by 4 mm wide by 40 mm long) of the flow cell are covered with a #1 glass coverslip attached to the cell with acrylic adhesive. The chamber was treated with poly-l-lysine to improve cell adhesion, and a 1:50 inoculum of the csrA mutant of MG1655 was used. Image acquisition, processing, and software remained the same as described above. Unlike Pseudomonas aeruginosa (29), E. coli attached to the flow cell only at relatively low flow rates. The biofilm grew at a flow rate not exceeding 50 ml/h through a single chamber of the Stovall cell, corresponding to a linear average flow speed of 3.5 mm/s (Reynolds number 3). Biofilm growth was slower than under static conditions and required ∼4 to 5 days before distinct structures were observed. Although laminar flow studies were conducted at ambient temperature (∼24°C) instead of at 26°C, this did not account for the much slower growth under flow, since static cultures grew well at ambient temperature (data not shown). Cell density patterns differed depending on the means of inoculation of the flow cell, i.e., under static versus continuous flow conditions. Figure 5a and b show cell density of biofilm after 96 h of growth. Inoculation was conducted under static conditions for 2 h, after which a flow of 15 ml/h (1.04 mm/s average linear speed) was maintained. The periodic pattern resembles a lattice structure, with a characteristic wavelength of ∼50 μm (Fig. 5a). No measurable anisotropy was observed for biofilms inoculated under static conditions. Upon further development, these patterns underwent a gradual decrease in size. After 144 h, structures that had originally been ∼50 μm became subdivided into smaller structures with a characteristic wavelength of 12 to 15 μm (data not shown), similar to that of statically grown biofilms. Figure 5c shows the biofilm pattern formed after 50 h of cultivation under the same flow rate, but with in-flow inoculation conditions. A diluted overnight culture was pumped through the flow cell during the first 2 h. Afterward, the feeding solution was switched to the pure cultivation medium. This pattern consists of a mixture of partial cells, similar to that shown in Fig. 5a, and streaks in the direction of the flow. The visible anisotropy of the pattern suggests the importance of the initial cell distribution in the later development of the biofilm. Figure 5d shows the biofilm patterns after 72 h of cultivation at a higher flow rate, 22 ml/h. No trace of the lattice structure was observed, only a pattern of quasi-periodic streaks.
FIG. 5.
Biofilm patterns in a flow cell. The csrA mutant of MG1655 was grown under laminar flow. The direction of the flow is from left to right in all panels. (a) Micrograph (×10 objective) at 96 h of growth at a flow rate of 15 ml/h of a culture that was inoculated under static conditions. The frame width of the image is 1,200 μm. (b) Same conditions (×100 objective) as in panel a, at a frame width of 120 μm. (c) Biofilm (×10 objective) after 50 h of cultivation at a flow rate of 15 ml/hour, with in-flow inoculation. The frame width of the image is 1,200 μm. (d) Biofilm (×10 objective) after 72 h of cultivation at a flow rate of 22 ml/h, with in-flow inoculation. The frame width of the image is 1,200 μm.
Conclusions and potential models.
Cell arrangements in certain bacterial biofilms have been previously suggested to be nonrandom based on visual appearance (reference 31 and references therein). However, to our knowledge this is the first study to quantitatively analyze this feature. Importantly, the cellular attachment pattern of statically grown two-dimensional biofilms exhibited a wavelength similar to that of the cell distribution pattern in more mature, thick biofilms. This suggests that the process responsible for their origination is translated upward as the biofilm grows.
The cause of these patterns is unknown, but they might originate by a number of possible mechanisms. (i) Randomly attached bacteria could serve as initiation sites and attract other cells through chemical signaling, i.e., chemotaxis. Nevertheless, the similar distribution patterns of motile and nonmotile strains would seem to eliminate this model. (ii) Current information indicates that under certain conditions, biofilm maturation depends upon intercellular communication, i.e., quorum sensing (2, 10, 14, 17, 26, 35, 38, 40). The essence of quorum sensing is that gene expression is regulated in response to cell density by a small diffusible molecule, which accumulates during growth. Quorum sensing requires the presence of sufficient numbers of bacteria for the signal to accumulate and appears not to be needed for the initial stage of biofilm development (10). P. aeruginosa rhamnolipid surfactant, which is regulated by quorum sensing, can help to maintain biofilm architecture by keeping channels open but is synthesized only in maturing biofilm and does not determine biofilm architecture (9). (iii) Mathematical models based on nutrient availability have been used to describe the origination of biofilm structure (e.g., see references 34 and 37). However, these models are inadequate to predict nonrandom cell attachment in early monolayers growing in rich medium. Such models also predict that under minimal sheer and limiting nutrients, pores proximal to the nutrient source should become constricted with growth relative to distal pores (34), which was not observed to occur in the present study (Fig. 4). (iv) Bioconvection patterns arise due to motions generated as a result of hydrodynamic instabilities, e.g., in suspensions of motile microorganisms, and have been extensively studied in recent years (3, 7, 15). Due to hydrodynamic limitations, the wavelengths of periodic structures in bioconvective patterns are in the range of a few millimeters, two orders of magnitude greater than the wavelengths of the biofilm patterns. (v) Periodicity in many biological systems, including excitable tissues, morphogenesis processes, and population dynamics, can be explained on the basis of models that involve two major variables, an activator and an inhibitor (4, 19-22). In one model for the generation of stationary periodic patterns, the Turing model, the activator-inhibitor system requires that the diffusion of the inhibitor is much faster than the diffusion of the activator (4, 21). In a growing bacterial system, the population density itself might be considered as the activator variable. The inhibitor should be a substance released by bacteria which prevents other bacteria from attaching. According to this model, the cluster of neighboring cells creates a chemical “inhibitory field,” protecting the surface from colonization at a certain distance from the cell clusters. Cells that are already included in the cluster should be indifferent to the “repellent.” Thus, the developing biofilm creates a potential barrier for cell attachment, exhibiting long-range repellant and short-range attractive forces. It should be emphasized that the repellent need not physically block cell attachment. As illustrated by bacterial chemotaxis (18), the capacity of a substance to alter the probability of a simple cellular activity (e.g., flagellum motor switching) can dramatically influence population behavior. We have observed that cells of monolayer biofilms often attach, disassociate, and then reattach to the substrate at a nearby location (unpublished data), and similar cell migration within biofilms has been documented previously (e.g., see references 23, 32, and 36). Such behavior might permit cells to sample the immediate environment before stable attachments are formed and thereby influence the attachment patterns. Finally, the anisotropy that is introduced by inoculation under flow is consistent with, but not proof of, the activator-inhibitor model.
Acknowledgments
We thank Julian Borejdo for help with CLSM and June Scott and Valentin Krinsky for critical reviews of the manuscript.
These studies were funded in part by the National Science Foundation (MCB-9726197) and Kane Biotech, Inc. Kane is developing applications related to the findings herein. T. Romeo serves as Chief Scientific Advisor for, owns equity in, and may receive royalties from this company. The terms of this arrangement have been reviewed and approved by Emory University in accordance with its conflict-of-interest policies.
REFERENCES
- 1.Baker, C. S., I. Morozov, K. Suzuki, T. Romeo, and P. Babitzke. 2002. CsrA regulates glycogen biosynthesis by preventing translation of glgC in Escherichia coli. Mol. Microbiol. 44:1599-1610. [DOI] [PubMed] [Google Scholar]
- 2.Bassler, B. L. 2002. Small talk: cell-to-cell communication in bacteria. Cell 109:421-424. [DOI] [PubMed] [Google Scholar]
- 3.Bees, M. A., and N. A. Hill. 1997. Wavelengths of bioconvection patterns. J. Exp. Biol. 200:1515-1526. [DOI] [PubMed] [Google Scholar]
- 4.Boissonade, J. 1994. Chemical patterns—long-range inhibition. Nature 369:188-189. [Google Scholar]
- 5.Brooun, A., S. Liu, and K. Lewis. 2000. A dose-response study of antibiotic resistance in Pseudomonas aeruginosa biofilms. Antimicrob. Agents Chemother. 44:640-646. [DOI] [PMC free article] [PubMed] [Google Scholar]
- 6.Costerton, J. W., P. S. Stewart, and E. P. Greenberg. 1999. Bacterial biofilms: a common cause of persistent infections. Science 284:1318-1322. [DOI] [PubMed] [Google Scholar]
- 7.Czirok, A., I. M. Janosi, and J. O. Kessler. 2000. Bioconvective dynamics: dependence on organism behaviour. J. Exp. Biol. 203:3345-3354. [DOI] [PubMed] [Google Scholar]
- 8.Danese, P. N., L. A. Pratt, and R. Kolter. 2000. Exopolysaccharide production is required for development of Escherichia coli K-12 biofilm architecture. J. Bacteriol. 182:3593-3596. [DOI] [PMC free article] [PubMed] [Google Scholar]
- 9.Davey, M. E., N. C. Caiazza, and G. A. O'Toole. 2003. Rhamnolipid surfactant production affects biofilm architecture in Pseudomonas aeruginosa PAO1. J. Bacteriol. 185:1027-1036. [DOI] [PMC free article] [PubMed] [Google Scholar]
- 10.Davies, D. G., M. R. Parsek, J. P. Pearson, B. H. Iglewski, J. W. Costerton, and E. P. Greenberg. 1998. The involvement of cell-to-cell signals in the development of a bacterial biofilm. Science 280:295-298. [DOI] [PubMed] [Google Scholar]
- 11.Hwang, J. J., and S. I. Stupp. 2000. Poly(amino acid) bioadhesives for tissue repair. J. Biomater. Sci. Polym. Ed. 11:1023-1038. [DOI] [PubMed] [Google Scholar]
- 12.Jackson, D. W., J. W. Simecka, and T. Romeo. 2002. Catabolite repression of Escherichia coli biofilm formation. J. Bacteriol. 184:3406-3410. [DOI] [PMC free article] [PubMed] [Google Scholar]
- 13.Jackson, D. W., K. Suzuki, L. Oakford, J. W. Simecka, M. E. Hart, and T. Romeo. 2002. Biofilm formation and dispersal under the influence of the global regulator CsrA of Escherichia coli. J. Bacteriol. 184:290-301. [DOI] [PMC free article] [PubMed] [Google Scholar]
- 14.James, G. A., D. R. Korber, D. E. Caldwell, and J. W. Costerton. 1995. Digital image-analysis of growth and starvation responses of a surface-colonizing Acinetobacter sp. J. Bacteriol. 177:907-915. [DOI] [PMC free article] [PubMed] [Google Scholar]
- 15.Janosi, I. M., A. Czirok, D. Silhavy, and A. Holczinger. 2002. Is bioconvection enhancing bacterial growth in quiescent environments? Environ. Microbiol. 4:525-531. [DOI] [PubMed] [Google Scholar]
- 16.Johnson, J. R., P. Delavari, and M. Azar. 1999. Activities of a nitrofurazone-containing urinary catheter and a silver hydrogel catheter against multidrug-resistant bacteria characteristic of catheter-associated urinary tract infection. Antimicrob. Agents Chemother. 43:2990-2995. [DOI] [PMC free article] [PubMed] [Google Scholar]
- 17.Kjelleberg, S., and S. Molin. 2002. Is there a role for quorum sensing signals in bacterial biofilms? Curr. Opin. Microbiol. 5:254-258. [DOI] [PubMed] [Google Scholar]
- 18.Macnab, R. M. 1999. The bacterial flagellum: reversible rotary propeller and type III export apparatus. J. Bacteriol. 181:7149-7153. [DOI] [PMC free article] [PubMed] [Google Scholar]
- 19.Miller, J. H. 1972. Experiments in molecular genetics. Cold Spring Harbor Laboratory, Cold Spring Harbor, N.Y.
- 20.Murray, J. D. 1982. Parameter space for Turing instability in reaction diffusion mechanisms—a comparison of models. J. Theor. Biol. 98:143-163. [DOI] [PubMed] [Google Scholar]
- 21.Murray, J. D. 1989. Mathematical Biology. Springer, Berlin, Germany.
- 22.Neubert, M. G., H. Caswell, and J. D. Murray. 2002. Transient dynamics and pattern formation: reactivity is necessary for Turing instabilities. Math. Biosci. 175:1-11. [DOI] [PubMed] [Google Scholar]
- 23.O'Toole, G. A., and R. Kolter. 1998. Flagellar and twitching motility are necessary for Pseudomonas aeruginosa biofilm development. Mol. Microbiol. 30:295-304. [DOI] [PubMed] [Google Scholar]
- 24.O'Toole, G., H. B. Kaplan, and R. Kolter. 2000. Biofilm formation as microbial development. Annu. Rev. Microbiol. 54:49-79. [DOI] [PubMed] [Google Scholar]
- 25.Picioreanu, C., M. C. M. van Loosdrecht, and J. J. Heijnen. 2000. Effect of diffusive and convective substrate transport on biofilm structure formation: a two-dimensional modeling study. Biotechnol. Bioeng. 69:504-515. [DOI] [PubMed] [Google Scholar]
- 26.Redfield, R. J. 2002. Is quorum sensing a side effect of diffusion sensing? Trends Microbiol. 10:365-370. [DOI] [PubMed] [Google Scholar]
- 27.Romeo, T. 1998. Global regulation by the small RNA-binding protein CsrA and the non-coding RNA molecule CsrB. Mol. Microbiol. 29:1321-1330. [DOI] [PubMed] [Google Scholar]
- 28.Romeo, T., M. Gong, M. Y. Liu, and A-M. Brun-Zinkernagel. 1993. Identification and molecular characterization of csrA, a pleiotropic gene from Escherichia coli that affects glycogen biosynthesis, gluconeogenesis, cell size, and surface properties. J. Bacteriol. 175:4744-4755. [DOI] [PMC free article] [PubMed] [Google Scholar]
- 29.Sauer, K., A. K. Camper, G. D. Ehrlich, J. W. Costerton, and D. G. Davies. 2002. Pseudomonas aeruginosa displays multiple phenotypes during development as a biofilm. J. Bacteriol. 184:1140-1154. [DOI] [PMC free article] [PubMed] [Google Scholar]
- 30.Stewart, P. S., and J. W. Costerton. 2001. Antibiotic resistance of bacteria in biofilms. Lancet 358:135-138. [DOI] [PubMed] [Google Scholar]
- 31.Stoodley, P., K. Sauer, D. G. Davies, and J. W. Costerton. 2002. Biofilms as complex differentiated communities. Annu. Rev. Microbiol. 56:187-209. [DOI] [PubMed] [Google Scholar]
- 32.Tolker-Nielsen, T., U. C. Brinch, P. C. Ragas, J. B. Andersen, C. S. Jacobsen, and S. Molin. 2000. Development and dynamics of Pseudomonas sp. biofilms. J. Bacteriol. 182:6482-6489. [DOI] [PMC free article] [PubMed] [Google Scholar]
- 33.Wasche. S., H. Horn, and D. C. Hempel. 2000. Mass transfer phenomena in biofilm systems. Water Sci. Technol. 41:357-360. [Google Scholar]
- 34.van Loosdrecht, M. C., J. J. Heijnen, H. Eberl, J. Kreft, and C. Picioreanu. 2002. Mathematical modelling of biofilm structures. Antonie Leeuwenhoek 81:245-256. [DOI] [PubMed] [Google Scholar]
- 35.Watnick, P., and R. Kolter. 2000. Biofilm, city of microbes. J. Bacteriol. 182:2675-2679. [DOI] [PMC free article] [PubMed] [Google Scholar]
- 36.Watnick, P. I., and R. Kolter. 1999. Steps in the development of a Vibrio cholerae El Tor biofilm. Mol. Microbiol. 34:586-595. [DOI] [PMC free article] [PubMed] [Google Scholar]
- 37.Wimpenny, J. W. T., and R. Colasanti. 1997. A unifying hypothesis for the structure of microbial biofilms based on cellular automaton models. FEMS Microbiol. Ecol. 22:1-16. [Google Scholar]
- 38.Winzer, K., K. R. Hardie, and P. Williams. 2002. Bacterial cell-to-cell communication: sorry, can't talk now—gone to lunch! Curr. Opin. Microbiol. 5:216-222. [DOI] [PubMed] [Google Scholar]
- 39.Yang, H., M. Y. Liu, and T. Romeo. 1996. Coordinate genetic regulation of glycogen catabolism and biosynthesis in Escherichia coli via the CsrA gene product. J. Bacteriol. 178:1012-1017. [DOI] [PMC free article] [PubMed] [Google Scholar]
- 40.Yoon, S. S., R. F. Hennigan, G. M. Hilliard, U. A. Ochsner, K. Parvatiyar, M. C. Kamani, H. L. Allen, T. R. DeKievit, P. R. Gardner, U. Schwab, J. J. Rowe, B. H. Iglewski, T. R. McDermott, R. P. Mason, D. J. Wozniak, R. E. Hancock, M. R. Parsek, T. L. Noah, R. C. Boucher, and D. J. Hassett. 2002. Pseudomonas aeruginosa anaerobic respiration in biofilms: relationships to cystic fibrosis pathogenesis. Dev. Cell 3:593-603. [DOI] [PubMed] [Google Scholar]


