

Abstract
We evaluated the usefulness of loop-mediated isothermal amplification (LAMP) in detecting specific gene sequences of Mycobacterium avium subsp. paratuberculosis (MAP). A total of 102 primer sets for LAMP was designed to amplify the IS900, HspX, and F57 gene sequences of MAP. Using each of two primer sets (P-1 and P-2) derived from the IS900 fragment, it was possible to detect MAP in a manner similar to that used with nested PCR. The sensitivity of LAMP with P-1 was 0.5 pg/tube, which was more sensitive than nested PCR. When P-2 was used, 5 pg/tube could be detected, which was the same level of sensitivity as that for nested PCR. LAMP with P-1 was specific. Although only 2 Mycobacterium scrofulaceum strains out of 43 non-MAP mycobacterial strains were amplified, the amplification reaction for these strains was less efficient than for MAP strains, and their products could be distinguished from MAP products by restriction digestion. LAMP with P-2 resulted in very specific amplification only from MAP, the same result obtained with nested PCR. Our LAMP method was highly specific, and the white turbidity of magnesium pyrophosphate, a by-product of the LAMP reaction, allowed simple visual detection. Our method is rapid, taking only 2 h, compared with 4 h for nested PCR. In addition, the LAMP method is performed under isothermal conditions and no special apparatus is needed, which makes it more economical and practical than nested PCR or real-time PCR. These results indicate that LAMP can provide a rapid yet simple test for the detection of MAP.
Mycobacterium avium subsp. paratuberculosis (MAP) causes Johne's disease, a chronic progressive enteritis in ruminants (4, 12, 13, 21, 26). Cattle, sheep, goats, deer, alpaca, llamas, rhinoceros, rabbits, bison, and other herbivores have been diagnosed with paratuberculosis (3, 10, 11, 22). The organism has also been isolated from primates, including humans (7, 9). The disease is economically important in the cattle industry but its control is hampered by the lack of accurate rapid diagnostic tests. This necessitates the development of high-throughput, sensitive diagnostic methods for the detection of infected animals and animal products. Accurate diagnostic tests for Johne's disease are important in enabling the culling or segregation of infected animals as well as the identification of disease-free animals to maintain the economic viability of dairy farming. Bacterial isolation has to date been considered the most reliable test for detecting MAP infection in cattle (25, 26, 31). Fecal culturing for MAP is technically simple and semiquantitative, detecting as few as 10 CFU/g (31). In addition, fecal culturing requires little investment in equipment. However, because of the slow growth of MAP, it takes more than 8 weeks for colony formation. This prolonged test period favors the growth of bacterial and fungal contaminants that are able to survive the decontamination process.
Several PCR protocols to rapidly detect MAP have been published (2, 7, 15, 17, 20, 23, 24, 28, 29). The targets of these methods are the sequences specific to MAP: IS900, HspX, and F57. Among them, IS900 is an insertion sequence that is unique to MAP, and approximately 10 to 20 copies of the sequence are present in the MAP genome (9). It has been reported that IS900-based PCR is highly sensitive and that nested PCR is more sensitive and specific for the detection of MAP than conventional PCR (5). However, these methods require several operations, such as an electrophoresis step, and the risk of contamination is very real. Recently, a real-time PCR method was developed (33). The sensitivity of this method is equal to that of fecal culturing and can detect the amplified products without electrophoresis. However, real-time PCR requires a special apparatus to monitor the amplification of DNA. Loop-mediated isothermal amplification (LAMP), which amplifies target nucleic acids with high specificity, efficiency, and rapidity under isothermal conditions, was developed by Notomi and coworkers (17, 18, 19). LAMP sensitivity is not significantly influenced by the presence of nontarget DNA. This method relies on auto-cycling strand displacement DNA synthesis performed by a DNA polymerase with high strand displacement activity. A specially designed set of two inner and two outer primers is used, but later during the cycling reaction only the inner primers are used for strand displacement DNA synthesis. The reaction is highly specific for the target sequence; this specificity is attributable to recognition of the target sequence by six independent sequences in the initial stage and by four independent sequences during the later stages of the LAMP reaction. LAMP is simple and easy to perform once the appropriate primers are prepared, requiring only four primers, DNA polymerase, and a regular laboratory heat block for the reaction. No special apparatus is needed, which makes it more economical and practical than nested PCR or real-time PCR. Thus, LAMP has several advantages and could be a novel method to replace conventional PCR methods.
One of the characteristics of LAMP is its ability to synthesize an extremely large amount of DNA. Accordingly, a large amount of by-product, pyrophosphate ion, is produced, yielding a white precipitate of magnesium pyrophosphate in the reaction mixture. The presence of this white precipitate allows easy detection of nucleic acids amplified by the LAMP method (16). In addition, the amplification products generated by LAMP can be detected with gel electrophoresis in the same way as for PCR. The LAMP reaction produces many bands of different sizes, forming a ladder of DNA fragments of 100 bp and larger. Production of the bands depends on the presence of the inner primers, the template, and the DNA polymerase. Specific amplification can be distinguished from nonspecific amplification by the difference in the ladder pattern. Digestion with restriction enzymes is also useful in confirming the structure of the amplified product(s) (19). The present study reports the usefulness of the LAMP method for detection of MAP.
MATERIALS AND METHODS
Mycobacterial strains.
The mycobacterial strains used in this study are shown in Table 1; a total of 62 were examined. Strain number 1 was used as a template for examining the efficiency of LAMP. Strain numbers 2 to 20 of MAP were isolated from the intestinal lymph nodes of diseased cows. Strain numbers 21 to 43 were obtained from the original collection of W. B. Schaefer (23), and strain numbers 44 to 54 came from an authenticated collection of A. Y. Tsang and coworkers (27). Strain numbers 55 to 58 were identified by IS1245 PCR. Mycobacterial strains other than those of MAP were cultured on 1% Ogawa medium (Nissui, Tokyo, Japan), and the MAP strains were cultured on Herrold's egg yolk medium supplemented with mycobactin. Genomic DNA was extracted from mycobacterial strains as follows. (i) First, an isolated colony was selected and resuspended in 1 ml of autoclaved water in a microtube and centrifuged for 1 min at 10,000 × g, and the supernatants were removed. (ii) The pellets were suspended in 200 μl of InstaGene matrix (Bio-Rad, Tokyo, Japan), and the tubes were incubated at 56°C for 15 to 30 min. (iii) After high-speed vortex mixing for 10 s, the tubes were placed in a heat block at 100°C for 8 min. (iv) After vortex mixing again, the tubes were subjected to centrifugation at 10,000 × g for 2 to 3 min. The supernatant was then used for the examinations.
TABLE 1.
Comparison of the specificities of nested PCR and LAMPd
| Strain no. | Mycobacterial strain | Nested PCR resulta (>17b) | LAMP result
|
||
|---|---|---|---|---|---|
| P-1
|
P-2
|
||||
| (>17b) | (<0.1b) | (>17b) | |||
| 1 | M. avium subsp. paratuberculosisc ATCC 19698 | + | + | + | + |
| 2 | M. avium subsp. paratuberculosisc TO-O187 | + | + | + | + |
| 3 | M. avium subsp. paratuberculosisc TA-G185 | + | + | + | + |
| 4 | M. avium subsp. paratuberculosisc RI-M194 | + | + | + | + |
| 5 | M. avium subsp. paratuberculosisc O-A196 | + | + | + | + |
| 6 | M. avium subsp. paratuberculosisc RI-S272 | + | + | + | + |
| 7 | M. avium subsp. paratuberculosisc MA-O77 | + | + | + | + |
| 8 | M. avium subsp. paratuberculosisc MA-O78 | + | + | + | + |
| 9 | M. avium subsp. paratuberculosisc O-Y116 | + | + | + | + |
| 10 | M. avium subsp. paratuberculosisc RI-S273 | + | + | + | + |
| 11 | M. avium subsp. paratuberculosisc A-I285 | + | + | + | + |
| 12 | M. avium subsp. paratuberculosisc I-K49 | + | + | + | + |
| 13 | M. avium subsp. paratuberculosisc A-K30 | + | + | + | + |
| 14 | M. avium subsp. paratuberculosisc O-Yyanai | + | + | + | + |
| 15 | M. avium subsp. paratuberculosisc ME-Jtanaka | + | + | + | + |
| 16 | M. avium subsp. paratuberculosisc RI-H250 | + | + | + | + |
| 17 | M. avium subsp. paratuberculosisc OB-Y255 | + | + | + | + |
| 18 | M. avium subsp. paratuberculosisc TA-S263 | + | + | + | + |
| 19 | M. avium subsp. paratuberculosisc SHI-E260 | + | + | + | + |
| 20 | M. avium subsp. paratuberculosisc TA-S265 | + | + | + | + |
| 21 | M. avium serotype 1 ATCC 15769 | − | − | − | − |
| 22 | M. avium serotype 2 14141-1395 | − | − | − | − |
| 23 | M. avium serotype 3 6195 | − | − | − | − |
| 24 | M. intracellulare serotype 4 13528-1079 | − | − | − | − |
| 25 | M. intracellulare serotype 5 4443-1237 | − | − | − | − |
| 26 | M. intracellulare serotype 6 34540 | − | − | − | − |
| 27 | M. intracellulare serotype 7 Manten 157 | − | − | − | − |
| 28 | M. intracellulare serotype 8 14658-1686 | − | − | − | − |
| 29 | M. intracellulare serotype 9 6450-204 | − | − | − | − |
| 30 | M. intracellulare serotype 10 1602-1965 | − | − | − | − |
| 31 | M. intracellulare serotype 11 14186-1424 | − | − | − | − |
| 32 | M. intracellulare serotype 12 P42 | − | − | − | − |
| 33 | M. intracellulare serotype 13 Chance | − | − | − | − |
| 34 | M. intracellulare serotype 14 P39 | − | − | − | − |
| 35 | M. intracellulare serotype 15 Simpson | − | − | − | − |
| 36 | M. intracellulare serotype 16 ATCC15987 | − | − | − | − |
| 37 | M. intracellulare serotype 17 Comell | − | − | − | − |
| 38 | M. intracellulare serotype 18 Melnick | − | − | − | − |
| 39 | M. intracellulare serotype 20 P40 | − | − | − | − |
| 40 | M. avium serotype 1 11907-300 | − | − | − | − |
| 41 | M. avium serotype 3 128-Germany | − | − | − | − |
| 42 | M. intracellulare serotype 19 Darden | − | − | − | − |
| 43 | M. intracellulare serotype 20 TMC1419 | − | − | − | − |
| 44 | M. intracellulare serotype 21 2993 | − | − | − | − |
| 45 | M. intracellulare serotype 22 5154O'Conner | − | − | − | − |
| 46 | M. intracellulare serotype 23 CDC1214 | − | − | − | − |
| 47 | M. intracellulare serotype 24 12645 | − | − | − | − |
| 48 | M. intracellulare serotype 25 CDC1195 | − | − | − | − |
| 49 | M. intracellulare serotype 27 Lane3081 | − | − | − | − |
| 50 | M. intracellulare serotype 28 Matthews9055 | − | − | − | − |
| 51 | M. scrofulaceum Bridge | − | + | − | − |
| 52 | M. scrofulaceum CDC1198 | − | + | − | − |
| 53 | M. scrofulaceum Underson | − | − | − | − |
| 54 | M. smegmatis 155 | − | − | − | − |
| 55 | M. avium serotype 8 Kumamotoc | − | − | − | − |
| 56 | M. avium FKS 1-1c | − | − | − | − |
| 57 | M. avium FKS 10-1c | − | − | − | − |
| 58 | M. avium FMS 11-1c | − | − | − | − |
| 59 | M. bovis BCG | − | − | − | − |
| 60 | M. bovis B-10 | − | − | − | − |
| 61 | M. tuberculosis Aoyama B | − | − | − | − |
| 62 | M. kansasii S-55322 | − | − | − | − |
Nested PCR was performed as described previously (9).
The amount of DNA contained in a reaction mixture (nanograms per tube).
Field strain isolated from cows.
+, PCR or LAMP amplification; −, no PCR or no LAMP amplification.
Plasmid DNA.
IS900 fragments (9) were obtained by PCR amplification from a MAP strain (ATCC 19698). The 1,451-bp amplified fragments from IS900 were digested with SalI and EcoRI and cloned into pBluescript II (TOYOBO, Tokyo, Japan) plasmid vectors (pIS900) according to standard protocols.
Primer design for LAMP.
Four primers were used for LAMP reactions, two inner primers and two outer primers (Fig. 1). The two inner primers are called the forward inner primer (FIP) and the backward inner primer (BIP), and each contains two distinct sequences corresponding to the sense and antisense sequences of the target DNA, one for priming in the first stage and the other for self-priming in later stages. For ease of explanation, the sequences (typically 23 to 24 nt) inside both ends of the region targeted for amplification in a DNA fragment are designated F2c and B2. Two inner sequences (typically 23 to 24 nt) 40 nt from the ends of F2c and B2 are designated F1c and B1, and two sequences (17 to 21 nt) outside the ends of F2c and B2 are designated F3c and B3. Given this structure, the sequences of FIP and BIP were designed as follows. FIP contains the sequence (F1c) complementary to F1 and F2. BIP contains B1 and the sequence (B2c) complementary to B2. The two outer primers consist of F3 and the sequence (B3c) complementary to B3. The gene sequences of IS900 (accession no. X16293), HspX (accession no. AF069754), and F57 (accession no. X70277) were obtained from GenBank. The primers for LAMP were designed to amplify the gene fragments of IS900, HspX (1), and F57 (20) of MAP with the Primer Designing Support software (FUJITSU, Tokyo, Japan).
FIG. 1.

Design of LAMP primers.
LAMP.
LAMP was carried out in a 25-μl (total volume) reaction mixture containing 2.4 μM (each) FIP and BIP, 0.2 μM concentrations of the forward outer primer (F3) and backward outer primer (B3), 400 μM deoxynucleoside triphosphates (dNTPs), 0.8 M betaine (Sigma, St. Louis, Mo.), 20 mM Tris-HCl (pH 8.8), 10 mM KCl, 10 mM (NH4)2SO4, 4 mM MgSO4, 0.1% Triton X-100 (Sigma), 8 U of Bst DNA polymerase (New England Biolabs, Beverly, Mass.), and the template DNA. Amplification was undertaken in 0.2-ml microtubes in a thermal cycler at isothermal conditions of 65°C for 90 to 120 min. When an amplification result was tested by real-time monitoring of the turbidity by using LA-200 (Teramecs, Kyoto, Japan), the absorbance of the reaction mixture at 650 nm was measured sequentially, and the composition of 400 mM dNTPs-4 mM MgSO4-0.1% Triton X-100 changed to 1.4 mM dNTPs-8 mM MgSO4-0.1% Tween 20. Seven microliters of LAMP products was electrophoresed at 100 V in 3% agarose gels (1× Tris-acetate-EDTA), followed by staining with ethidium bromide, using appropriate size markers (100-base pair [bp] ladder; New England Biolabs). In addition, to confirm the structure, the amplified products were digested with several restriction endonucleases and their sizes were analyzed by electrophoresis. AflIII cuts between B1 and B2 of P-1, and PvuII cuts between B1 and B2 of P-2. If the amplification occurred as expected, the amplified products would be fragmented into 107-, 131-, and 197-bp fragments by AflIII digestion, and 184-, 201-, and 289-bp fragments by PvuII digestion. Aliquots (5 μl) of LAMP products and 2 μl of the products digested with restriction enzymes were also subjected to electrophoresis on 3% agarose gels.
Nested PCR.
To compare LAMP with nested PCR, we tested the sensitivity and specificity of nested PCR with the same template DNA at identical concentrations as were used in the LAMP test. Two-microliter samples were added to 20-μl reaction mixtures containing HotStar Taq Master Mix Kit (1× PCR buffer, 200 μM [each] dNTP, 2.5 U of HotStar Taq DNA polymerase; QIAGEN, Tokyo, Japan) and 1 μM (each) primer in a 0.2-ml microtube. Nested PCR with primers and thermal-cycle conditions as described previously was performed (16). The primary PCR amplification was performed with 30 cycles of denaturation at 97°C for 30 s and combined annealing and extension at 65°C for 30 s in a thermal cycler (TaKaRa, Tokyo, Japan). A second PCR was performed by using 0.4 μl of the first PCR solution in 19.6 μl of fresh reaction buffer containing a second set of primers nested inside the first set. The second PCR was performed for 20 cycles with the same conditions as before but with an extension time of 10 min for the last cycle. Samples of PCR amplification products (10 μl) were subjected to electrophoresis on a 3% agarose gel.
RESULTS
A total of 102 LAMP primer sets was designed and tested, based on three gene sequences reported to be specific to MAP, IS900, HspX, and F57. Only two primer sets based on IS900 were sensitive enough to specifically amplify MAP DNA by the LAMP method. Eight primer sets derived from each of the two gene sequences (HspX and F57) did not amplify or did not show acceptable sensitivity and specificity (data not shown). Thus, two sets of LAMP primers (P-1 and P-2) designed from IS900 were selected (Fig. 2; Table 2), and the following results were obtained. pIS900 and genomic DNAs of MAP were used to ascertain the detection limit of the IS900 gene by using LAMP. P-1 showed a sensitivity of 0.05 pg/tube when plasmid DNA in 90-min reactions was used. In the case of MAP genomic DNA, the detection limit was 0.5 pg/tube under the same conditions. The LAMP with P-1 had a sensitivity equal to or greater than that of the nested PCR techniques (Table 3). P-2 showed a detection limit of 0.1 pg/tube when plasmid DNA in a 120-min reaction was used. In the case of MAP genomic DNA, the sensitivity was 5 pg/tube under the same conditions (Table 3).
FIG. 2.

Positions of LAMP primers on IS900.
TABLE 2.
Sequence of LAMP primers
| Primer set | Primer | Sequence |
|---|---|---|
| P-1 | F3 | GGG TAT GGC TTT CAT GTG GT |
| F2 | GTT GGA TGG CCG AAG GAG AT | |
| F1c | TCA ATT AGC GGT CGA GTC GTC | |
| B1 | TGC GAT TGG ATC GCT GTG TA | |
| B2c | TCC AGA TCA ACC CAG CAG AC | |
| B3 | CAC CTC CGT AAC CGT CAT T | |
| FIP | TCA ATT AGC GGT CGA GTC GTC GTT GGA TGG CCG AAG GAG AT | |
| BIP | TGC GAT TGG ATC GCT GTG TAT CCA GAT CAA CCC AGC AGA C | |
| P-2 | F3 | CGA TCA TCG CCG ATC AG |
| F2 | CCA CGA CTT GCA GCC TCT G | |
| F1c | GTC AGG ATG CGC AGC TCG A | |
| B1 | CGA TCG AAC CGA ATG CGC G | |
| B2c | GGC TCT TGT TGT AGT CGA AGG | |
| B3 | GCC AGT AAG CAG GAT CAG C | |
| FIP | GTC AGG ATG CGC AGC TCG ACC ACG ACT TGC AGC CTC TG | |
| BIP | CGA TCG AAC CGA ATG CGC GGG CTC TTG TTG TAG TCG AAG G |
TABLE 3.
Comparison of the detection sensitivities of PCR and LAMP
The specificity of LAMP with P-1 and P-2 was examined with various mycobacterial DNA samples (Table 1). Both primer sets showed the same positive results with 20 field strains isolated from cows infected with MAP. P-1 gave negative results with all 43 mycobacterial strains except for Mycobacterium scrofulaceum strains (no. 51 and 52), which gave positive reactions but with lower amplification efficiencies than with MAP. P-2 did not give a positive reaction with any of the 43 mycobacterial strains; only MAP was specifically amplified with this primer set.
LAMP amplified extremely large amounts of target DNA and produced magnesium pyrophosphate as a by-product. As shown in Fig. 3, white turbidity was visible; therefore, it was possible to detect the amplification products by the white precipitate of magnesium pyrophosphate in the reaction mixture without gel electrophoresis.
FIG. 3.
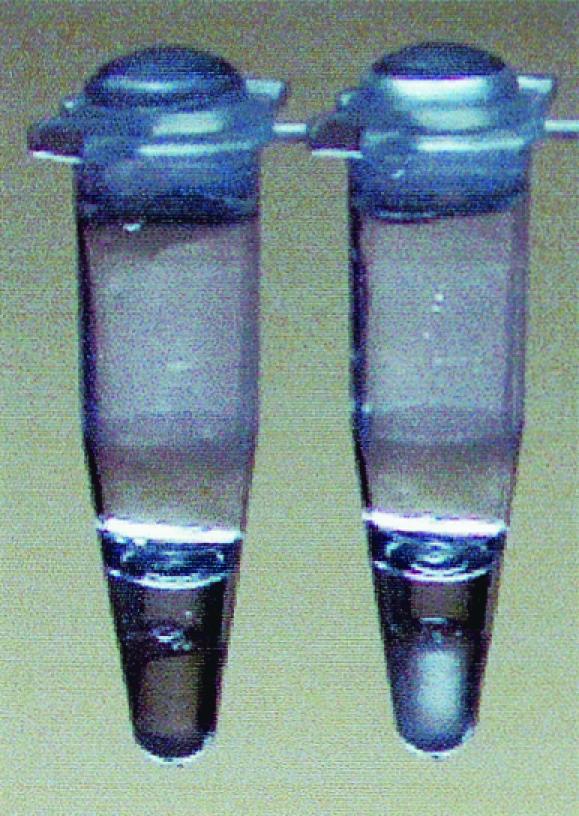
Detection of turbidity for the LAMP method. Left tube, negative; right tube, positive.
Figure 4A shows the results of turbidity measurements for the LAMP reaction with P-1 for 90 min at 65°C. The detection limit of the turbidity was 0.5 pg/tube for MAP. Turbidities were not observed when other DNA templates, except for those for M. scrofulaceum strains (no. 51 and 52), were used. However, for M. scrofulaceum strains (no. 51 and 52), there was an increase in turbidity following LAMP in reaction mixtures containing more than 100 pg of DNA of each strain per tube. Figure 4B shows the results of the electrophoretic analysis of the LAMP reaction mixture using P-1. The ladder pattern confirmed the specific amplification of the target sequence.
FIG. 4.

(A) Turbidity measurements of LAMP reaction mixtures for MAP detection using P-1. (B) Electrophoretic analysis of LAMP reaction mixtures for MAP detection using P-1. Lane 1, 5 pg of MAP per μl; lane 2, 0.5 pg of MAP per μl; lane 3, 500 pg of strain number 51 per μl; lane 4, 50 pg of strain number 51 per μl; lane 5, 500 pg of strain number 52 per μl; lane 6, 50 pg of strain number 52 per μl; lane 7, 0.05 pg of plasmid DNA of IS900 per μl; lane 8, negative control; lane M, 100-bp ladder. Abs., absorbance.
Figure 5A shows the results of turbidity measurements for the LAMP reaction mixture using P-2, conducted for 120 min at 65°C. An increase in turbidity was observed in specimens containing template DNA from MAP. In cases where MAP template DNA was not present or was less than 5 pg/tube, the turbidity of the reaction mixture did not increase. Other template DNAs besides MAP did not show turbidity. Figure 5B shows the results of electrophoretic analysis of the LAMP reaction mixture using P-2. The amplification of the target sequence was confirmed by the detection of the appropriate ladder pattern.
FIG. 5.

(A) Turbidity measurements of LAMP reaction mixtures for MAP detection using P-2. (B) Electrophoretic analysis of LAMP reaction mixtures for MAP detection using P-2. Lane 1, 50 pg of MAP per μl; lane 2, 20 pg of MAP per μl; lane 3, 10 pg of MAP per μl; lane 4, 5 pg of MAP per μl; lane 5, 1 pg of MAP per μl; lane 6, 0.1 pg of plasmid DNA per μl; lane 7, negative control; lane M, 100-bp ladder. Abs., absorbance.
To confirm the structure, the amplified products were digested with several restriction enzymes and their sizes were analyzed by electrophoresis. As shown in Figure 6, the sizes of the fragments generated were approximately 107, 131, and 197 bp for AflIII digestion and 184, 201, and 289 bp for PvuII digestion, in good agreement with the predicted sizes. The products of strain numbers 51 and 52 were not digested by the restriction enzymes. The sequences of these amplification products demonstrated that several mutations were present, including some located within restriction enzyme sites (data not shown).
FIG. 6.

Restriction analysis of LAMP products using P-1 (A) and P-2 (B). (A) Lane 1, amplified products of pIS900; lane 2, pIS900 digested with AflIII; lane 3, amplified products of MAP; lane 4, MAP digested with AflIII. (B) Lane 1, amplified products of pIS900; lane 2, pIS900 digested with PvuII; lane 3, amplified products of MAP; lane 4, MAP digested with PvuII; lane M, 100-bp ladder.
DISCUSSION
The growth of MAP in culture is so slow that it takes two to three months for diagnosis of Johne's disease. Therefore, a rapid diagnostic test for Johne's disease has been anxiously awaited. This report describes the development of LAMP for the rapid detection of IS900, a gene sequence specific to MAP. Two primer sets specific to MAP were selected for LAMP. These primers bind in a region similar to that of previously described PCR primers (15, 29), which indicates that the specificity of the IS900 sequence is located in the first half of the sequence. It has been reported that sequences similar to IS900 are present in other mycobacteria (6, 14, 32), and sequences in which homology is 94% with IS900 were recently reported (8). In the present study, LAMP with P-1 amplified M. scrofulaceum and the sequences of the amplified products are similar to that of MAP. However, since several mutations had occurred in the restriction enzyme site, it was possible to distinguish these sequences from that of MAP. Moreover, LAMP has the ability to distinguish target bacteria from similar bacteria by monitoring the difference in amplification efficiency between them. As shown by the results with P-2, although there are many insertion sequences similar to IS900, by using the LAMP method based on the region of IS900 specific to MAP, it is possible to specifically detect MAP.
Two primer sets for LAMP were able to detect 0.5 to 5 pg of DNA per tube. This detection sensitivity was greater than that for conventional PCR, which can detect 100 pg of DNA/tube (28), and was similar to that of nested PCR, which can detect 1 pg of DNA/tube (5, 15). Designing appropriate primers for LAMP is one of the most important key points in optimizing the LAMP reaction because LAMP uses four primers that recognize six distinct regions on the target DNA. While, therefore, the design of LAMP primers is much more complex than that for conventional PCR, the use of Primer Designing Support Software enabled us to efficiently design candidate primers. The previously described reaction time for LAMP (19) is 60 min, but the two primer sets used in this experiment required a longer reaction time (90 to 120 min). Examination and further improvement of the primers for LAMP may improve the speed of the reaction and the sensitivity of detection in the future.
The LAMP method was quicker, taking only 2 h, compared with 4 h for nested PCR.
Newer techniques such as real-time PCR are as rapid as LAMP; results can be obtained in a short time, and electrophoresis is unnecessary. In addition to being rapid, LAMP is easy to perform and is suitable for processing many samples at the same time.
This report presents the results of LAMP using cultures of mycobacteria, so it is necessary to consider detection from fecal samples. Many PCR methods for detecting MAP from fecal samples have been reported (5, 15, 23, 28, 30). When attempting to detect MAP by these methods, PCR inhibitors, which are present in fecal samples, cause a problem, and various devices to reduce PCR inhibitors are required. LAMP seems less sensitive to the presence of nonspecific DNA than does PCR. The presence of 100 ng of human genomic DNA in a LAMP reaction mixture to detect six copies of hepatitis B virus target did not adversely affect the amplification efficiency or result in significant background (19). Moreover, LAMP was not inhibited by blood serum and plasma in heparin, which are known to inhibit PCRs (data not shown).
In conclusion, the LAMP method showed high specificity with IS900 primer sets and MAP cultures. In addition, we demonstrated the possibility of a simple visual detection strategy based on the production of the white turbidity of magnesium pyrophosphate, a by-product of the LAMP reaction. For application in the field, further experiments will be necessary to develop a procedure for obtaining DNA from fecal samples.
REFERENCES
- 1.Bannantine, J. P., and J. R. Stable. 2000. HspX is present within Mycobacterium paratubercurosis-infected macrophages and is recognized by sera from some infected cattle. Vet. Microbiol. 76:343-358. [DOI] [PubMed] [Google Scholar]
- 2.Baurfeind, R., S. Benazzi, R. Weiss, T. Schliesser, H. Willems, and G. Baljer. 1996. Molecular characterization of Mycobacterium paratuberculosis isolates from sheep, goats, and cattle by hybridization with a DNA probe to insertion element IS900. J. Clin. Microbiol. 34:1617-1621. [DOI] [PMC free article] [PubMed] [Google Scholar]
- 3.Beard, P. M., D. Henderson, M. J. Daniels, A. Pirie, D. Buxton, A. Greig, M. R. Hutchings, I. McHendrick, S. Rhind, K. Stevenson, and J. M. Sharp. 1999. Evidence of paratuberculosis in fox (Vulpes vulpes) and stoat (Mustelaerminea). Vet. Rec. 145:612-613. [Google Scholar]
- 4.Chiodini, R. J., H. J. Van Kruiningen, and R. S. Merkal. 1984. Ruminant paratuberculosis (Johne's disease): the current status and future prospect. Cornell Vet. 74:218-262. [PubMed] [Google Scholar]
- 5.Collins, D. M., D. M. Stephens, and G. W. De Lisle. 1993. Comparison of polymerase chain reaction tests and fecal culture for detecting Mycobacterium paratuberculosis in bovine feces. Vet. Microbiol. 36:289-299. [DOI] [PubMed] [Google Scholar]
- 6.Cousins, D. V., R. J. Whittington, I. Marsh, A. Masters, R. J. Evans, and P. Kluver. 1999. Mycobacteria distinct from Mycobacterium avium subsp. paratuberculosis isolated from the feces of ruminants possess IS900-like sequences detectable by IS900 polymerase chain reaction: implications for diagnosis. Mol. Cell. Probes 14:431-442. [DOI] [PubMed] [Google Scholar]
- 7.Dell'Isola, B., C. Poyart, O. Goulet, J. F. Mougenot, E. Sadoun-Journo, N. Brousse, J. Schmitz, C. Ricour, and P. Berche. 1994. Detection of Mycobacterium paratuberculosis by polymerase chain reaction in children with Crohn's disease. J. Infect. Dis. 169:449-451. [DOI] [PubMed] [Google Scholar]
- 8.Englund, S., G. Bolske, and K.-E. Johansson. 2002. An IS900-like sequence found in a Mycobacterium sp. other than Mycobacterium avium subsp. paratuberculosis. FEMS Microbiol. Lett. 209:267-271. [DOI] [PubMed] [Google Scholar]
- 9.Green, E. P., M. L. Tizard, M. T. Moss, J. Thompson, D. J. Winterborne, J. J. McFadden, and J. Hermon-Taylor. 1989. Sequence and characteristics of IS900, an insertion sequence element identified in a human Crohn's isolate of Mycobacterium paratuberculosis. Nucleic Acids Res. 17:9063-9073. [DOI] [PMC free article] [PubMed] [Google Scholar]
- 10.Greig, A., K. Stevenson, V. Perez, A. A. Pirie, J. M. Grant, and J. M. Sharp. 1997. Paratuberculosis in wild rabbits (Oryctolagus cuniculus). Vet. Rec. 140:141-143. [DOI] [PubMed] [Google Scholar]
- 11.Greig, A., K. Stevenson, D. Henderson, V. Hughes, I. Pavlik, M. E. Hines II, I. McKendrick, and J. M. Sharp. 1999. Epidemiological study of paratuberculosis in wild rabbits in Scotland. J. Clin. Microbiol. 37:1746-1751. [DOI] [PMC free article] [PubMed] [Google Scholar]
- 12.Larsen, A. B., R. S. Merkal, and R. C. Cutlip. 1975. Age of cattle as related to resistance to infection with Mycobacterium paratuberculosis. Am. J. Vet. Res. 36:255-257. [PubMed] [Google Scholar]
- 13.Lawrence, W. E. 1956. Congenital infection with Mycobacterium johnei in cattle. Vet. Rec. 68:312-314. [Google Scholar]
- 14.Marsh, I., R. Whittington, and D. Cousins. 1999. PCR-restriction endonuclease analysis for identification and strain typing of Mycobacterium avium subsp. paratuberculosis and Mycobacterium avium subsp. avium based on polymorphisms in IS1311. Mol. Cell. Probes 13:115-126. [DOI] [PubMed] [Google Scholar]
- 15.Miki, T., et al. 1996. Detection and identification of Mycobacterium avium subsp. paratuberculosis by PCR using rapid DNA extract agents. J. Clin. Vet. Med. 14:28-34. (In Japanese.) [Google Scholar]
- 16.Mori, Y., K. Nagamine, N. Tomita, and T. Notomi. 2001. Detection of loop-mediated isothermal amplification reaction by turbidity derived from magnesium pyrophosphate formation. Biochem. Biophys. Res. Commun. 289:150-154. [DOI] [PubMed] [Google Scholar]
- 17.Nagamine, K., K. Watanabe, K. Ohtsuka, T. Hase, and T. Notomi. 2001. Loop-mediated isothermal amplification reaction using a nondenatured template. Clin. Chem. 47:1742-1743. [PubMed] [Google Scholar]
- 18.Nagamine, K., T. Hase, and T. Notomi. 2002. Accelerated reaction by loop-mediated isothermal amplification using loop primers. Mol. Cell. Probes 16:223-229. [DOI] [PubMed] [Google Scholar]
- 19.Notomi, T., H. Okayama, H. Masubuchi, T. Yonekawa, K. Watanabe, N. Amino, and T. Hase. 2000. Loop-mediated isothermal amplification of DNA. Nucleic Acids Res. 28:E63. [DOI] [PMC free article] [PubMed] [Google Scholar]
- 20.Poupart, P., M. Coene, H. Van Heuverswyn, and C. Cocito. 1993. Preparation of a specific RNA probe for detection of Mycobacterium paratuberculosis and diagnosis of Johne's disease. J. Clin. Microbiol. 31:1601-1605. [DOI] [PMC free article] [PubMed] [Google Scholar]
- 21.Rankin, J. D. 1959. Johne's disease in cattle. IV. Experimental infection. Vet. Rec. 71:1157-1160. [Google Scholar]
- 22.Riemann, H., M. R. Zaman, R. Ruppanner, O. Aalund, J. B. Jorgensen, H. Worsaae, and D. Behymer. 1979. Paratuberculosis in cattle and free-living exotic deer. J. Am. Vet. Med. Assoc. 174:841-843. [PubMed] [Google Scholar]
- 23.Schaefer, W. B. 1965. Serologic identification and classification of atypical mycobacteria by their agglutination. Am. Rev. Respir. Dis. 92(Suppl.):85-93. [DOI] [PubMed] [Google Scholar]
- 24.Secott, T. E., A. M. Ohme, S. Barton, C. C. Wu, and F. A. Rommel. 1999. Mycobacterium paratuberculosis detection in bovine feces is improved by coupling agar culture enrichment to an IS900-specific polymerase chain reaction. J. Vet. Diagn. Investig. 11:441-447. [DOI] [PubMed] [Google Scholar]
- 25.Sockett, D. C., T. A. Conrad, C. B. Thomas, and M. T. Collins. 1992. Evaluation of four serological tests for bovine paratuberculosis. J. Clin. Microbiol. 30:1134-1139. [DOI] [PMC free article] [PubMed] [Google Scholar]
- 26.Sweeney, R. W., R. H. Whitlock, A. E. Rosenberger, and S. A. Herr. 1992. Isolation of Mycobacterium paratuberculosis after oral inoculation in uninfected cattle. Am. J. Vet Res. 53:1312-1314. [PubMed] [Google Scholar]
- 27.Tsang, A. Y., I. Drupa, M. Goldberg, J. K. McClatchy, and P. J. Brennan. 1983. Use of serology and thin-layer chromatography for the assembly of an authenticated collection of serovars within the Mycobacterium avium-Mycobacterium intracellulare-Mycobacterium scrofulaceum complex. Int. J. Syst. Bacteriol. 33:285-292. [Google Scholar]
- 28.Van der Giessen, J. W. B., R. M. Haring, E. Vauclare, A. Eger, J. Haagsma, and B. A. M. van der Zeijst. 1992. Evaluation of the abilities of three diagnostic tests based on the polymerase chain reaction to detect Mycobacterium paratuberculosis in cattle: application in a control program. J. Clin. Microbiol. 30:1216-1219. [DOI] [PMC free article] [PubMed] [Google Scholar]
- 29.Vary, P. H., P. R. Andersen, E. Green, J. Hermon-Taylor, and J. J. McFadden. 1990. Use of highly specific DNA probes and the polymerase chain reaction to detect Mycobacterium paratuberculosis in Johne's disease. J. Clin. Microbiol. 28:933-937. [DOI] [PMC free article] [PubMed] [Google Scholar]
- 30.Whipple, D. L., D. R. Callihan, and J. L. Jarnagin. 1991. Cultivation of Mycobacterium paratuberculosis from bovine fecal specimens and a suggested standardized procedure. J. Vet. Diagn. Investig. 3:368-373. [DOI] [PubMed] [Google Scholar]
- 31.Whitlock R. H., and A. E. Rosenberger. 1990. Fecal culture protocol for Mycobacterium paratuberculosis: a recommended procedure, p. 280-285. In Proceedings of the 94th Annual Meeting of the U.S. Animal Health Association. U.S. Animal Health Association, Richmond, Va.
- 32.Whittington, R. J., A. F. Hope, D. J. Marshall, C. A. Taragel, and I. Marsh. 2000. Molecular epidemiology of Mycobacterium avium subsp. paratuberculosis: IS900 restriction fragment length polymorphism analyses of isolates from animals and a human in Australia. J. Clin. Microbiol. 38:3240-3248. [DOI] [PMC free article] [PubMed] [Google Scholar]
- 33.Ying Fang, W.-H. Wu, J. L. Pepper, J. L. Larsen, S. A. E. Marras, E. A. Nelson, W. B. Epperson, and J. Christopher-Hennings. 2002. Comparison of real-time, quantitative PCR with molecular beacons to nested PCR and culture methods for detection of Mycobacterium avium subsp. paratuberculosis in bovine fecal samples. J. Clin. Microbiol. 40:287-291. [DOI] [PMC free article] [PubMed] [Google Scholar]