

Abstract
Objective
Obesity is common in women and associated with a number of adverse health outcomes including cardiovascular disease, infectious diseases, and cancer. We explore the relationship between obesity and immune cell counts in women.
Design
Longitudinal study of 322 women from 1999 through 2003 enrolled as HIV-negative comparators in the Women’s Interagency HIV Study.
Methods
Body mass index (BMI) was categorized as normal weight (BMI 18.5 - 24.9), overweight (BMI 25 - 29.9), obese (BMI 30 - 34.9), and morbid obesity (BMI ≥35). CD4 and CD8 counts and percents, total lymphocyte and white blood cell (WBC) counts were measured annually using standardized techniques. A mixed model repeated measures analysis was performed using an autoregressive correlation matrix.
Results
At the index visit, 61% of women were African-American; mean age was 35 years, and median BMI was 29 kg/m2. Immunologic parameters were in the normal range (median CD4 count: 995 cells/mm3; CD8 count: 488 cells/mm3; total lymphocyte count: 206 cells/mm3; median WBC: 6 × 10³ cells/mm3). In multivariate analyses, being overweight, obese or morbidly obese were independently associated with higher CD4, total lymphocyte, and WBC counts than being normal weight; morbid obesity was associated with a higher CD8 count. The strongest associations between body weight and immune cell counts were demonstrated in the morbidly obese.
Conclusion
Increasing body weight is associated with higher CD4, CD8, total lymphocyte, and WBC counts in women. Investigation into the impact of obesity on immune function and long term adverse outcomes is needed.
Introduction
The prevalence of obesity has increased markedly in the last two decades in the United States (1; 2). Recent data suggest that 65% of adults in the U.S. are overweight, with 30% of these being obese and 5% extremely obese (1). Disparities in the prevalence of obesity exist by gender, race, and ethnicity. Women are more likely to be obese than men, and Mexican-Americans and non-Hispanic Blacks are more likely to be obese than non-Hispanic Whites (1; 2).
These trends are of particular concern as obesity is associated with many adverse health conditions including type 2 diabetes (T2DM), cardiovascular disease (CVD), hypertension (HTN), dyslipidemia, asthma, arthritis, and poor health in general (2-7). Obesity has also been associated with a higher incidence of infections in acutely ill (8) and post-surgical populations (9; 10) as well as with an excess incidence of cancer (6), which raises the possibility that altered immune cell count or function may be one of the links between obesity and disease.
Research into the effect of obesity on lymphocytes and T-lymphocyte subsets has produced conflicting results. Potential reasons for these inconsistencies include the cross-sectional nature of these studies as well as small sample size. One small study (11) found reduced CD4+ and CD8+ T lymphocyte subsets in 34 obese subjects as compared to 50 non-obese subjects, while another found elevations in CD4+ T lymphocytes and no change in CD8+ T lymphocytes in 116 obese women as compared to 41 non-obese women (12). Others have demonstrated an increase in CD4+ T cells and a decrease in CD8+ T cells in morbidly obese women compared to healthy, normal weight controls (13), while still others demonstrate no difference between either CD4+ or CD8+ T cell counts in obese and normal weight patients (14).
We investigate the longitudinal relationship between body mass index (BMI) and white blood cell (WBC) count, total lymphocyte count, and T cell subsets including CD4+ and CD8+ cell counts and percents, as well as CD4:CD8 ratio, in a large, ethnically diverse cohort of women.
Methods
Participants and study design
HIV-uninfected women enrolled in the Women’s Interagency HIV Study (WIHS), an ongoing multicenter longitudinal cohort study of the characteristics and progression of HIV infection in women, were studied in this analysis. The WIHS enrolled 2059 HIV-infected and 569 HIV-uninfected women from six sites across the U.S.: New York (Bronx/Manhattan), Washington D.C., Chicago, Los Angeles, and the San Francisco Bay Area from October 1994 through November 1995. At baseline, the HIV-uninfected women had sociodemographic and HIV risk factors similar to the HIV-infected women. The recruitment methods and baseline characteristics of enrollees have been reported elsewhere (15; 16). Women were studied at semiannual visits which include a structured interview, a physical examination, including measures of height and weight, and the collection of blood, urine, and cervico-vaginal fluid samples.
Measurement of BMI
Weight was measured at baseline and at semiannual visits, while height was measured at the baseline visit only. BMI was calculated using the formula: (body weight in kg)/ (height in meters)2.
Measurement of white blood cells, lymphocytes, CD4 and CD8
CD4+ and CD8+ T cell counts and percents were measured annually in HIV-uninfected women using standard flow cytometry performed in laboratories certified by National Institute of Allergies and Infectious Diseases (NIAID) Flow Cytometry Quality Assessment Program. In keeping with the NIAID guidelines, three-color immunophenotyping is used. The monoclonal antibody combinations used include CD3/CD4/CD45 as well as CD3/CD8/CD45 to determine CD4+ T cells, and CD8+ T cells, respectively. Using low side scatter and gating on “bright” CD45 for each tube helped ensure inclusion of only lymphocytes, and eliminated the need to correct for gate purity (17). A complete blood count (CBC), including WBC count, with automated differential was measured annually at these same visits. The total lymphocyte count was calculated by multiplying the WBC count by the automated percent lymphocytes.
Covariates
Covariates that have an independent effect on immune cell function and number were selected through a review of the literature and included: age, race/ethnicity, HCV seropositivity, and self report measures of current injection drug use (IDU), current smoking, diabetes, menopausal status and use of post-menopausal hormone replacement therapy (HRT), and use of hormonal birth control. The HCV 2.0 enzyme-linked immuno-assay (EIA) (Abbott Labs, Abbott Park, IL) and the recombinant immunoblot assay (RIBA) determined HCV status. Use of post-menopausal hormone replacement therapy (HRT) was evaluated, but as data were available only from April 2002 on, those women who self-reported using HRT were removed from the analysis, and only post-menopause women not on hormone replacement were evaluated.
Statistical analysis
Of the 569 HIV-uninfected women enrolled in the original cohort, 322 were included in the analysis and were followed between April 1999 and March 2003. Data on the covariates of interest were routinely collected at the beginning of the 10th semiannual WIHS visit in April 1999, which will be referred to as the index visit. Compared to those women not included in this study at the index visit, the women included had similar CD4, WBC, and lymphocyte counts, but higher BMI and lower CD8 count and CD8 percent (data not shown). The differences observed in BMI, CD8 count and CD8 percent did not appear to be clinically significant. No other differences in the outcome variables were found between the two groups.
Univariate analyses indicated non-normal distribution for some of the variables. Appropriate transformations were performed and used in the model analyses. However, as the transformed variables did not lead to any differences in the final models, the results from the original variables are reported here.
Bivariate analyses on index visit data were conducted to identify potentially confounding relationships between the covariates and the dependent and independent variables. These analyses demonstrated a non-linear relationship between BMI and all of the immunologic variables. Therefore, BMI was categorized using National Heart, Lung, and Blood Institute (NHLBI) guidelines: underweight, BMI < 18.5; normal weight, BMI 18.5 - 24.9; overweight, BMI 25 - 29.9; obese, BMI 30 - 34.9; morbidly obese (classes II and III obesity) BMI ≥ 35. For the purposes of the multivariate analyses, dummy variables were created for each of the BMI categories. The normal weight group served as the reference group.
Mixed model analyses using an autoregressive correlation matrix were performed for the multivariate, longitudinal analyses. Initial analyses demonstrated that the assumption of compound symmetry was violated in all models, thus the autoregressive correlation matrix was used. To select the best predictive model of the immunologic outcomes, BMI, along with all covariates and interaction terms, were entered into the model. Through backward selection using null model likelihood, the best, most parsimonious model was selected. In cases where the best fit model included non-significant covariates, multicollinearity, defined conservatively as Pearson’s correlation coefficient between predictor variables of greater than 0.60, was evaluated, but did not play a role in these models. An alpha of 0.05 was used to determine significance. Least squares means were used to compare the impact of BMI, body composition, and the covariates on the immunologic outcomes. Analyses were carried out in SAS® 9.1, using proc GLM and proc Mixed.
Results
Of the 322 women included in the analyses, 61% were Black. The mean age was 35 ± 8 years (Table 1). Over two-thirds had an annual income of less than $18,000 and two-thirds had completed 12 or fewer years of education. A history of IDU was reported in one quarter of women, but only 5% reported current IDU. More than one quarter of the women were HCV-seropositive. The majority of women reported currently smoking. A diagnosis of diabetes was reported by 3% of women at or before the index visit. Table 2 shows the body composition and immunologic parameters. The median BMI fell into the overweight category (Table 2). Four percent of the sample was underweight, 27% normal weight, 26% overweight, 18% obese and 24% morbidly obese. Median immunologic indices were within laboratory-defined normal ranges at the index visit.
Table 1.
Sociodemographic characteristics of the 322 women at the index visit
| Characteristic | N (%)* |
|---|---|
| Racea | |
| Non-Hispanic White | 37 (11) |
| Hispanic White | 6 (2) |
| Black | 196 (61) |
| Native American | 76 (24) |
| Other | 7 (2) |
| Ageb (years), mean ± SD | 35 ± 8 |
| Marital statusb | |
| Living with partner | 100 (31) |
| Separated/divorced/widowed | 86 (27) |
| Never married | 114 (35) |
| Other | 2 (1) |
| Income per yearb | |
| ≤$18,000 | 216 (67) |
| >$18,000 | 85 (26) |
| Educationb | |
| High school or less | 216 (67) |
| College or greater | 106 (33) |
| Employedb | 147 (46) |
| Current alcohol consumptionb | |
| Abstain or < 3 drinks/week | 236 (73) |
| > 3 drinks / week | 86 (27) |
| Current intravenous drug use | 17 (5) |
| Current smoking | 194 (60) |
| HCV seropositive | 88 (27) |
| Self-reported diabetes | 11 (3) |
| Menopausal | 52 (16) |
| Use hormonal birth control | 22 (7) |
Data from baseline
Data from visit 10
Percents may not sum to 100 due to missing data and rounding
Table 2.
Median weight and immunologic parameters at the index visit
| Characteristic | Median (IQR) |
|---|---|
| BMI (kg/m2) | 29.2 (24.7, 35.1) |
| CD4 count (cells/mm3) | 995.0 (792.0, 1264.5 |
| CD4 percent | 48.0 (43.0, 53.0) |
| CD8 count (cells/mm3) | 487.5 (383.0, 653.0) |
| CD8 percent | 23.5 (19.2, 28.3) |
| CD4:CD8 ratio | 2.0 (1.6, 2.6) |
| Total lymphocyte count (cells/mm3) | 206.4 (168.8, 255.4) |
| WBC count (× 103 cells/mm3) | 6.1 (4.9, 7.5) |
Bivariate analyses demonstrated that BMI was a significant predictor of WBC count, total lymphocyte count, CD8 count and CD4 count, but did not predict CD4%, CD8% or CD4:CD8 ratio. None of the models demonstrated a significant interaction between BMI and time.
In the unadjusted model, overweight, obese and morbidly obese women had significantly higher CD4 counts than normal weight women (Table 3). CD4 counts in underweight women did not differ significantly from those of normal weight women. The association between weight and CD4 count was strengthened by the addition of current smoking, current IDU, and self-reported DM into the model, even though neither current IDU nor self-reported DM were significantly associated. Current smokers had a higher CD4 count than those not reporting current smoking (1240 cells/mm3 vs. 1145 cells/mm3, p=0.0006). Those who reported IDU had a trend toward a lower CD4 count than those who did not (1136 cells/mm3 vs. 1250 cells/mm3, p=0.07). Those who self-reported DM appeared to have a higher CD4 count than those who did not (1224 cells/mm3 vs. 1162 cells/mm3, p=0.22). A significant interaction between morbid obesity and self-reported DM was noted, where in morbidly obese women, the CD4 count was higher in those who self-reported DM than in those who did not. The mean CD4 count in each BMI category at each visit after adjustment are shown in the figure.
Table 3.
Unadjusted and adjusted models for the association between BMI category and CD4 count
| Variables | CD4 count | CD8 count | ||||||
|---|---|---|---|---|---|---|---|---|
| Unadjusted model | Adjusted model | Unadjusted model | Adjusted model | |||||
| F value | p value | F value | p value | F value | p value | F value | p value | |
| Visit | 2.48 | 0.04 | 2.43 | 0.04 | 1.82 | 0.12 | 1.81 | 0.12 |
| Underweight | 2.10 | 0.19 | 2.21 | 0.18 | 2.53 | 0.15 | 2.56 | 0.15 |
| Normal weight | Ref | - | Ref | - | Ref | - | Ref | - |
| Overweight | 7.18 | 0.009 | 8.20 | 0.005 | 1.91 | 0.17 | 2.01 | 0.16 |
| Obese | 11.26 | 0.001 | 12.40 | <0.001 | 2.20 | 0.14 | 2.29 | 0.13 |
| Morbid obesity | 22.69 | <0.001 | 26.63 | <0.001 | 12.18 | 0.001 | 12.75 | <0.001 |
| Current smoking | 12.92 | <0.001 | 0.96 | 0.33* | ||||
| Current IDU | 3.88 | .07* | --** | |||||
| Self-reported DM | 1.58 | 0.22* | --** | |||||
| Self-reported DM × morbid obesity | 10.06 | 0.002 | --** | |||||
Variable is not significant, but removal significantly changes fit of the model
Covariate does not contribute significantly to the adjusted model and therefore is not included.
Figure.
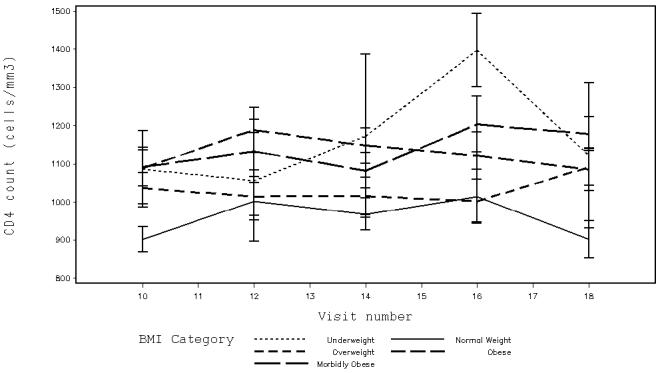
Adjusted mean CD4 counts with standard errors by BMI category at semiannual WIHS visits from April 1999 (index visit corresponds to WIHS visit 10) through March 2003 (visit 18) for the 322 study participants. Women who are overweight, obese or morbidly obese have significantly higher CD4 counts than do normal weight women (overweight women: 1169 cells/mm3 vs. normal weight women: 1079 cells/mm3, p=0.006; obese women: 1190 cells/mm3 vs. normal weight women: 1058 cells/mm3, p=0.001; morbidly obese women: 1215 cells/mm3 vs. normal weight women 1034 cells/mm3, p<0.001).
As noted earlier, the model with the best fit included covariates that were not significantly associated with CD4 count (e.g. current IDU and self-reported DM). When we included only the significant covariates in the model, the associations between weight and CD4 count remained the same.
When we studied the association between BMI category and CD8 count, only morbidly obese women had significantly higher CD8 counts than normal weight women (Table 3). CD8 counts in underweight, overweight, and obese women did not differ significantly from those of normal weight women. The addition of current smoking into the model strengthened the association between morbid obesity and CD8 count. As with the adjusted CD4 model, the association remained the same when only significant covariates were included in the model. Current smokers had CD8 counts similar to non-smokers (609 cells/mm3 vs. 594 cells/mm3; p=0.33).
Table 4 shows that overweight, obese and morbidly obese women had a total lymphocyte count that was significantly higher than that found in normal weight women. The addition of current smoking, self-reported menopause, and self-reported DM into the model strengthened the association, even though the latter two covariates and the outcome were not significantly associated. We observed an interaction between morbid obesity and self-reported DM that was similar to that observed in the CD4 model and an interaction between time and self-reported DM. We found that over time, those who reported DM had a rise in lymphocyte counts 2 years after the index visit followed by a decline back to baseline in the last year of the study, whereas in women who did not report DM, the lymphocyte count remained constant over the duration of the study. Current smokers had a higher mean total lymphocyte count than those not reporting current smoking (263 cells/mm3 vs. 252 cells/mm3, p<0.04). Women who reported being menopausal had a total lymphocyte count similar to those who did not (252 cells/mm3 vs. 262 cells/mm3, p=0.12). Those who self-reported DM had a total lymphocyte count similar to those who did not (268 cells/mm3 vs. 247 cells/mm3, p=0.99).
Table 4.
Unadjusted and adjusted models for the association between BMI category and total lymphocyte count and WBC count
| Variables | Total lymphocyte count | WBC count | ||||||
|---|---|---|---|---|---|---|---|---|
| Unadjusted model | Adjusted model | Unadjusted model | Adjusted model | |||||
| F value | p value | F value | p value | F value | p value | F value | p value | |
| Visit | 1.75 | 0.14 | 3.03 | 0.02 | 1.05 | 0.38 | 0.84 | 0.50 |
| Underweight | 4.41 | 0.07 | 4.43 | 0.07 | 1.92 | 0.20 | 1.97 | 0.20 |
| Normal weight | Ref | - | Ref | - | Ref | - | Ref | - |
| Overweight | 7.03 | 0.01 | 7.88 | 0.006 | 4.39 | 0.04 | 4.53 | 0.04 |
| Obese | 15.11 | <0.001 | 16.53 | <0.001 | 9.30 | 0.003 | 10.65 | 0.002 |
| Morbid obesity | 27.16 | <0.001 | 23.70 | <0.001 | 22.71 | <0.001 | 29.59 | <0.001 |
| Current smoking | 4.35 | 0.04 | 9.42 | 0.003 | ||||
| Menopause | 2.63 | 0.11* | 4.45 | 0.04 | ||||
| Self-reported DM | 0.00 | 0.99 | **-- | |||||
| Self-reported DM × visit | 3.88 | 0.004 | **-- | |||||
| Self-reported DM × morbid obesity | 6.42 | 0.01 | **-- | |||||
| Race | **-- | 3.31 | 0.01 | |||||
| HCV | **-- | 15.27 | <0.001 | |||||
Variable is not significant, but removal significantly changes fit of the model.
Covariate does not contribute significantly to the adjusted model and therefore is not included.
Similarly, overweight, obese and morbidly obese women had significantly higher WBC counts than normal weight women (Table 4). The addition of self-reported menopause, race, and HCV seropositivity into the model strengthened the association. Non-Hispanic Whites had the highest WBC count and Blacks the lowest (6.99 × 10³ cells/mm3 vs. 6.09 × 10³ cells/mm3, p=0.01). Those who were HCV seropositive had a higher WBC count than those who were seronegative (7.26 × 10³ cells/mm3 vs. 6.52 × 10³ cells/mm3, p<001). Current smokers had a higher WBC count than non-smokers (7.11 × 10³ cells/mm3 vs. 6.67 × 10³ cells/mm3, p=0.003), and those who self-reported menopause had a lower WBC count that those who did not (6.71 × 10³ cells/mm3 vs. 7.07 × 10³ cells/mm3, respectively, p=0.04)
Because the underweight group comprised only 3% of all of the BMI observations (N=11 at the index visit), the small sample size may be insufficient to provide a reliable analysis. Therefore, all BMI analyses were repeated without this group. No differences in the results were observed.
Discussion
In our large cohort of ethnically diverse women, we found that being overweight or obese was associated with higher CD4, total lymphocyte and WBC counts. Being morbidly obese was associated with these outcomes, as well as with a higher CD8 count. The associations between weight and immune cell counts became stronger with each successive increase to the next weight category. It is noteworthy that cigarette smoking was associated with increases in immune cell number across cell types, which is consistent with previous findings in the WIHS cohort (18) as well as in the wider literature (19; 20). When we adjusted for cigarette smoking, the association between obesity and immune cell number was further strengthened.
A potential mechanism for the association between body weight and immune cell count may be via the production of the adipokine leptin from adipose tissue. . Obesity in humans is characterized by high circulating levels of leptin, consistent with a leptin-resistant state (21; 22). Immunologically, leptin supports proliferation and prevents apoptosis in a variety of immune cell types, especially TH1 CD4 subsets (23; 24). It also stimulates the production of pro-inflammatory cytokines (25). The role of leptin in the association between body weight and immune cell counts needs study in our cohort.
The relationship between weight and CD8 count invites additional consideration. Our data demonstrated a relationship between morbid obesity and CD8 count, but not overweight and obesity when compared to normal weight. These results are consistent with findings from other studies (14; 26). It may be that fat has a more direct effect on CD4 count, total lymphocyte count, and WBC count than on CD8 count. Naïve CD8+ T cells require more co-stimulatory activity than do naïve CD4+ T cells (27), possibly because CD8+ T cells are more destructive once activated. CD4 subtypes are directly stimulated by various cytokines including TNF-a, which is responsible for differentiation of CD4+ T cells into the TH1 subset (28-31), and leptin. In contrast, while cytokines produced by fat are not central to CD8 activation, an increase in CD4+ T cell count is. Therefore, while fat, via the action of various adipokines, directly influences CD4 count, it may influence CD8 counts only via its ability to activate CD4+ T cells, and thus its influence on CD8 counts may only be seen in the most extreme comparisons.
The strengths of our study include a large sample size compared to previous investigations, along with a longitudinal study design. We have also included several measures of body fat, as well as CD4 percent, CD8 percent, and CD4:CD8 ratio, which may provide a better estimation of immune system function than cell counts alone. The depth and breadth of the database used also allowed for an evaluation of these various measures of weight/fat and immune function in the context of a variety of covariates that have a documented impact on immune cell counts.
The primary limitation of our study was that our current analysis did not include an evaluation of CD4+ and CD8+ T cell activity, and therefore we are unable to comment on the impact of fat on CD4 subsets and activation and on CD8+ T cell activation. In general, functional analyses of the cell types included in this study would provide important additional information as cell counts do not necessarily reflect function.
Our data should be interpreted with caution since the women studied were enrolled into the WIHS based upon behaviors that put them at risk for HIV. These women were also impressively obese, more than is reported in the general population. Nevertheless our findings of an association between obesity and a higher CD4 count correspond closely to those found by Nieman and colleagues (26) who studied a community-based sample of generally healthy obese white women (mean BMI: 33 kg/m2) compared to normal weight white women. Our results differed from those found in other groups (11; 13; 14), possibly because those studies were smaller and included both men and women.
In conclusion, we found strong evidence of an association between obesity and increased CD4 counts, total lymphocyte counts, and WBC counts in a population of women at risk for HIV-infection. The increased number of immune cells associated with obesity may be the result of a chronic inflammatory state due to increased cytokine production by adipose tissue. Future research is needed to understand the association between obesity, immune function and long term morbidity and mortality outcomes in women.
Acknowledgement
Data in this manuscript were collected by the Women′s Interagency HIV Study (WIHS) Collaborative Study Group with centers (Principal Investigators) at New York City/Bronx Consortium (Kathryn Anastos); Brooklyn, NY (Howard Minkoff); Washington DC Metropolitan Consortium (Mary Young); The Connie Wofsy Study Consortium of Northern California (Ruth Greenblatt); Los Angeles County/Southern California Consortium (Alexandra Levine); Chicago Consortium (Mardge Cohen); Data Coordinating Center (Stephen Gange). The WIHS is funded by the National Institute of Allergy and Infectious Diseases with supplemental funding from the National Cancer Institute, and the National Institute on Drug Abuse (UO1-AI-35004, UO1-AI-31834, UO1-AI-34994, UO1-AI-34989, UO1-AI-34993, and UO1-AI-42590). Funding is also provided by the National Institute of Child Health and Human Development (grant UO1-HD-23632) and the National Center for Research Resources (grants MO1-RR-00071, MO1-RR-00079, MO1-RR-00083).
Footnotes
Publisher's Disclaimer: This is a PDF file of an unedited manuscript that has been accepted for publication. As a service to our customers we are providing this early version of the manuscript. The manuscript will undergo copyediting, typesetting, and review of the resulting proof before it is published in its final citable form. Please note that during the production process errors may be discovered which could affect the content, and all legal disclaimers that apply to the journal pertain.
References
- 1.Hedley AA, Ogden CL, Johnson CL, Carroll MD, Curtin LR, Flegal KM. Prevalence of overweight and obesity among US children, adolescents, and adults, 1999-2002. Jama. 2004;291:2847–2850. doi: 10.1001/jama.291.23.2847. [DOI] [PubMed] [Google Scholar]
- 2.Mokdad AH, Ford ES, Bowman BA, Dietz WH, Vinicor F, Bales VS, Marks JS. Prevalence of obesity, diabetes, and obesity-related health risk factors, 2001. Jama. 2003;289:76–79. doi: 10.1001/jama.289.1.76. [DOI] [PubMed] [Google Scholar]
- 3.Must A, Spadano J, Coakley EH, Field AE, Colditz G, Dietz WH. The disease burden associated with overweight and obesity. Jama. 1999;282:1523–1529. doi: 10.1001/jama.282.16.1523. [DOI] [PubMed] [Google Scholar]
- 4.Caterson ID, Hubbard V, Bray GA, Grunstein R, Hansen BC, Hong Y, Labarthe D, Seidell JC, Smith SC., Jr. Prevention Conference VII: Obesity, a worldwide epidemic related to heart disease and stroke: Group III: worldwide comorbidities of obesity. Circulation. 2004;110:e476–483. doi: 10.1161/01.CIR.0000140114.83145.59. [DOI] [PubMed] [Google Scholar]
- 5.Bray GA. Medical consequences of obesity. J Clin Endocrinol Metab. 2004;89:2583–2589. doi: 10.1210/jc.2004-0535. [DOI] [PubMed] [Google Scholar]
- 6.Wolk A, Gridley G, Svensson M, Nyren O, McLaughlin JK, Fraumeni JF, Adam HO. A prospective study of obesity and cancer risk (Sweden) Cancer Causes Control. 2001;12:13–21. doi: 10.1023/a:1008995217664. [DOI] [PubMed] [Google Scholar]
- 7.Garfinkel L. Overweight and cancer. Ann Intern Med. 1985;103:1034–1036. doi: 10.7326/0003-4819-103-6-1034. [DOI] [PubMed] [Google Scholar]
- 8.Yaegashi M, Jean R, Zuriqat M, Noack S, Homel P. Outcome of morbid obesity in the intensive care unit. J Intensive Care Med. 2005;20:147–154. doi: 10.1177/0885066605275314. [DOI] [PubMed] [Google Scholar]
- 9.Zacharias A, Habib RH. Factors predisposing to median sternotomy complications. Deep vs superficial infection. Chest. 1996;110:1173–1178. doi: 10.1378/chest.110.5.1173. [DOI] [PubMed] [Google Scholar]
- 10.Myles TD, Gooch J, Santolaya J. Obesity as an independent risk factor for infectious morbidity in patients who undergo cesarean delivery. Obstet Gynecol. 2002;100:959–964. doi: 10.1016/s0029-7844(02)02323-2. [DOI] [PubMed] [Google Scholar]
- 11.Tanaka S, Isoda F, Ishihara Y, Kimura M, Yamakawa T. T lymphopaenia in relation to body mass index and TNF-alpha in human obesity: adequate weight reduction can be corrective. Clin Endocrinol (Oxf) 2001;54:347–354. [PubMed] [Google Scholar]
- 12.Nieman DC, Henson DA, Nehlsen-Cannarella SL, Ekkens M, Utter AC, Butterworth DE, Fagoaga OR. Influence of obesity on immune function. J Am Diet Assoc. 1999;99:294–299. doi: 10.1016/S0002-8223(99)00077-2. [DOI] [PubMed] [Google Scholar]
- 13.O′Rourke RW, Kay T, Scholz MH, Diggs B, Jobe BA, Lewinsohn DM, Bakke AC. Alterations in T-cell subset frequency in peripheral blood in obesity. Obes Surg. 2005;15:1463–1468. doi: 10.1381/096089205774859308. [DOI] [PubMed] [Google Scholar]
- 14.Fink S, Eckert E, Mitchell J, Crosby R, Pomeroy C. T-lymphocyte subsets in patients with abnormal body weight: longitudinal studies. in anorexia nervosa and obesity. Int J Eat Disord. 1996;20:295–305. doi: 10.1002/(SICI)1098-108X(199611)20:3<295::AID-EAT9>3.0.CO;2-J. [DOI] [PubMed] [Google Scholar]
- 15.Barkan SE, Melnick SL, Preston-Martin S, Weber K, Kalish LA, Miotti P, Young M, Greenblatt R, Sacks H, Feldman J. The Women′s Interagency HIV Study. WIHS Collaborative Study Group. Epidemiology. 1998;9:117–125. [PubMed] [Google Scholar]
- 16.Bacon MC, von Wyl V, Alden C, Sharp G, Robison E, Hessol N, Gange S, Barranday Y, Holman S, Weber K, Young MA. The Women′s Interagency HIV Study: an Observational Cohort Brings Clinical Sciences to the Bench. Clin Diagn Lab Immunol. 2005;12:1013–1019. doi: 10.1128/CDLI.12.9.1013-1019.2005. [DOI] [PMC free article] [PubMed] [Google Scholar]
- 17.Nicholson J, Kidd P, Mandy F, Livnat D, Kagan J. Three-color supplement to the NIAID DAIDS guideline for flow cytometric immunophenotyping. Cytometry. 1996;26:227–230. doi: 10.1002/(SICI)1097-0320(19960915)26:3<227::AID-CYTO8>3.0.CO;2-B. [DOI] [PubMed] [Google Scholar]
- 18.Nowicki M, Karim R, Mack W, Minkoff H, Anastos K, Cohen M, Greenblatt R, Young M, Gange S, Levine A. Correlates of CD4+ and CD8+ lymphocyte counts in HIV-negative women: Women′s Interagency HIV Study (WIHS) 2006 doi: 10.1016/j.humimm.2007.01.007. in press
- 19.Tollerud DJ, Clark JW, Brown LM, Neuland CY, Mann DL, Pankiw-Trost LK, Blattner WA, Hoover RN. The effects of cigarette smoking on T cell subsets. A population-based survey of healthy caucasians. Am Rev Respir Dis. 1989;139:1446–1451. doi: 10.1164/ajrccm/139.6.1446. [DOI] [PubMed] [Google Scholar]
- 20.Schaberg T, Theilacker C, Nitschke OT, Lode H. Lymphocyte subsets in peripheral blood and smoking habits. Lung. 1997;175:387–394. doi: 10.1007/pl00007585. [DOI] [PubMed] [Google Scholar]
- 21.Kershaw EE, Flier JS. Adipose tissue as an endocrine organ. J Clin Endocrinol Metab. 2004;89:2548–2556. doi: 10.1210/jc.2004-0395. [DOI] [PubMed] [Google Scholar]
- 22.Dyck DJ, Heigenhauser GJ, Bruce CR. The role of adipokines as regulators of skeletal muscle fatty acid metabolism and insulin sensitivity. Acta Physiol (Oxf) 2006;186:5–16. doi: 10.1111/j.1748-1716.2005.01502.x. [DOI] [PubMed] [Google Scholar]
- 23.Otero M, Lago R, Gomez R, Dieguez C, Lago F, Gomez-Reino J, Gualillo O. Towards a pro-inflammatory and immunomodulatory emerging role of leptin. Rheumatology (Oxford) 2006;45:944–950. doi: 10.1093/rheumatology/kel157. [DOI] [PubMed] [Google Scholar]
- 24.Papathanassoglou E, El-Haschimi K, Li XC, Matarese G, Strom T, Mantzoros C. Leptin receptor expression and signaling in lymphocytes: kinetics during lymphocyte activation, role in lymphocyte survival, and response to high fat diet in mice. J Immunol. 2006;176:7745–7752. doi: 10.4049/jimmunol.176.12.7745. [DOI] [PubMed] [Google Scholar]
- 25.Lord GM, Matarese G, Howard JK, Bloom SR, Lechler RI. Leptin inhibits the anti-CD3-driven proliferation of peripheral blood T cells but enhances the production of proinflammatory cytokines. J Leukoc Biol. 2002;72:330–338. [PubMed] [Google Scholar]
- 26.Nieman DC, Nehlsen-Cannarella SI, Henson DA, Butterworth DE, Fagoaga OR, Warren BJ, Rainwater MK. Immune response to obesity and moderate weight loss. Int J Obes Relat Metab Disord. 1996;20:353–360. [PubMed] [Google Scholar]
- 27.Janeway C, Travers P, Walport M, Shlomchik M. Immunobiology: the immune system in health and disease. Garland Science; New York: 2005. [Google Scholar]
- 28.Rudin E, Barzilai N. Inflammatory peptides derived from adipose tissue. Immun Ageing. 2005;2:1. doi: 10.1186/1742-4933-2-1. [DOI] [PMC free article] [PubMed] [Google Scholar]
- 29.Kotler DP, Ionescu G, Johnson JA, Inada Y, He Q, Engelson ES, Albu JB. Studies of adipose tissue metabolism in human immunodeficiency virus-associated lipodystrophy. Clin Infect Dis. 2003;37(Suppl 2):S47–51. doi: 10.1086/375891. [DOI] [PubMed] [Google Scholar]
- 30.Hotamisligil GS. Inflammatory pathways and insulin action. Int J Obes Relat Metab Disord. 2003;27(Suppl 3):S53–55. doi: 10.1038/sj.ijo.0802502. [DOI] [PubMed] [Google Scholar]
- 31.Peraldi P, Spiegelman B. TNF-alpha and insulin resistance: summary and future prospects. Mol Cell Biochem. 1998;182:169–175. [PubMed] [Google Scholar]