

Abstract
Several structural brain abnormalities have been reported in patients with Attention Deficit Hyperactivity Disorder (ADHD). However, the aetiology of these brain changes is still unclear. To investigate genetic and environmental influences on ADHD related neurobiological changes we performed Voxel Based Morphometry on MRI scans from monozygotic (MZ) twins selected from a large longitudinal population database to be highly concordant or highly discordant for ratings on the Child Behavior Checklist Attention Problem scale (CBCL-AP). Children scoring low on the CBCL-AP are at low risk for ADHD, whereas children scoring high on this scale are at high risk for ADHD. Brain differences between concordant high risk twin pairs and concordant low risk twin pairs likely reflect the genetic risk for ADHD; brain differences between the low risk and high risk twins from discordant MZ twin pairs reflect the environmental risk for ADHD. A major difference between comparisons of high and low risk twins from concordant pairs and high/low twins from discordant pairs was found for the prefrontal lobes. The concordant high risk pairs showed volume loss in orbitofrontal subdivisions. High risk members from the discordant twin pairs exhibited volume reduction in the right inferior dorsolateral prefontal cortex. In addition, the posterior corpus callosum was compromised in concordant high risk pairs, only. Our findings indicate that inattention and hyperactivity symptoms are associated with anatomical abnormalities of a distributed action-attentional network. Different brain areas of this network appear to be affected in inattention/hyperactivity caused by genetic (i.e., high concordant MZ pairs) versus environmental (i.e., high-low discordant MZ pairs) risk factors. These results provide clues that further our understanding of brain alterations in ADHD.
Keywords: Twin study, anatomical MRI, VBM, attention and hyperactivity problems, ADHD, genetic risk factors, environmental risk factors
INTRODUCTION
In this report we present an MRI study in monozygotic (MZ) twins carefully selected from a large database of longitudinal surveys on problem behavior to investigate genetic and environmental influences on structural brain changes underlying symptoms of inattentiveness and hyperactivity. Twins were selected based on extreme scores on the attention problem (AP) scale of the Child Behavior Checklist (CBCL4/18: Verhulst et al., 1996). Despite its name, this widely used inventory for the assessment of childhood behavioral disturbances contains not only items on attention problems but also questions related to hyperactivity/impulsivity. The CBCL-AP scale has been shown to correlate well with the clinical evaluation of Attention Deficit Hyperactivity Disorder (ADHD) according to the Diagnostic and Statistical Manual of Mental Disorders-4th edition (DSM-IV: American Psychiatric Association, 1994). Recently, in a population of 1006 Dutch twins, a correlation between CBCL-AP and DSM-IV ADHD scores of 0.6 was found (Derks et al., 2006b). Twins with high CBCL-AP scores may therefore be considered at risk for ADHD and we expect that our work provides clues for understanding structural brain abnormalities observed in children at risk for ADHD as well as in clinical samples of patients diagnosed with ADHD.
ADHD is a common neuropsychiatric disorder characterized by developmentally inappropriate symptoms of inattention, impulsivity and hyperactivity (American Psychiatric Association, 1994). ADHD is generally referred to as a childhood onset disorder with prevalence estimated at about 3–5% of the child population (Goldman et al., 1998; Hudziak et al., 2000). Recent follow up studies have indicated that the behavioral abnormalities in ADHD may persist into adulthood, although symptoms at later ages may not be persistent enough to meet a DSM-IV diagnosis (Faraone et al., 2006).
Results from multiple twin studies, in many countries, indicate that the major influence (80%: Hudziak et al., 2005; Neuman et al., 1999; Rietveld et al., 2004; up to 90%: Thapar et al., 1999) on attention problems and ADHD is genetic. There are a variety of theories about the neurobiology of ADHD currently in the literature. One theory that many consider central to ADHD pathophysiology is that ADHD symptoms reflect a deficit in executive function subserved by the frontal lobes and striatal brain regions (Barkley, 1997; Pennington and Ozonoff, 1996; Sergeant et al., 2002; Zametkin et al., 1990), with possibly the cerebellum playing a role in modulations (Giedd et al., 2001c). The dopamine hypothesis of ADHD is based on the prediction that individuals with ADHD have impaired dopamine function in the mesolimbic dopamine system. Dopamine plays an important role in prefrontal-subcortical connectivity and furthermore, medicines shown to be effective in the treatment of ADHD such as methylphenidate enhances activity of frontal and striatal brain regions (Lou et al., 1989; Vaidya and Gabrieli, 1999). Because of these putative relations, multiple candidate gene studies of the dopamine system (dopamine transporter, dopamine 4 receptor, dopamine 5 receptor) have been investigated. These reveal conflicting results with the strongest evidence of a relation between the DAT gene and ADHD, with a more complicated picture for DRD4 (Auerbach et al., 2001; Durston et al., 2005). In addition to dopamine, other studies have also implicated genes for regulation of norepinephrine, nicotine, and others, involved in arousal and attentive behavior (for an overview see Voeller, 2004). As promising as the genetic findings have been, it is true that no clear relation between a single gene and the pathophysiology of ADHD has been discovered. The field has settled on a point, that ADHD is most likely an example of a complex disorder influenced in part by multiple genetic and environmental factors.
The study of environmental factors or of the interaction of genetic and environmental factors, presents an important step forward for our field. However, it is difficult to define what exactly an environmental factor is, partly because they have been poorly studied, but also because many so called environmental factors are themselves influenced by genetic factors (Eaves et al., 2005). Environmental risks may include those that disrupt normal fetal brain development such as maternal alcohol abuse or smoking during pregnancy (Huizink and Mulder, 2006; Linnet et al., 2003). There is also evidence that maternal alcohol and smoking increases the risk for ADHD through an interaction with the DAT1 genotype (Brookes et al., 2006; Kahn et al., 2003). Premature birth combined with low birth weight also constitutes an increased risk for ADHD (Bhutta and Anand, 2001).
The dopamine system, particularly in the basal ganglia is highly susceptible to hypoxia and relations of ADHD behavior and hypoxia at birth have been reported (Lou et al., 2004). In addition, ADHD symptoms are seen after childhood stroke, particularly with lesions in the basal ganglia, especially the putamen (Max et al., 2002), and orbitofrontal and mesial prefrontal cortices (Max et al., 2005a), and traumatic brain injury affecting basal ganglia and orbitofrontal regions (Gerring et al., 2000; Herskovits et al., 1999; Max et al., 2005b). Pheno-copies can also result from epilepsy (Schubert, 2005), and various other neurological insults such as meningitis and autoimmune disorders (Peterson et al., 2000; Wait et al., 2002).
Information on the contribution of environmental influences to ADHD risk comes from twin studies. To date, although contribution of shared environmental factors have shown to be important in a wide variety of human emotion, behavior, and activities (Hudziak et al., 2003), there have been no twin studies that provide evidence for the contribution of shared environment on ADHD. Rather, all unique, or non-shared environmental influences, defined as environmental factors that ‘lead twins to be different’ have been identified in most studies. Thus, much of the focus on the study of environmental mediators of ADHD must necessarily focus on unique insults. For example, despite general knowledge about environmental risk factors contributing to ADHD, except for cases with clear brain lesions, the exact neurobiological injuries or pathways mediating environmentally driven ADHD are still unclear. In addition, it is largely unknown whether environmental adversity affects brain structure and function in a similar way as genetic risk factors do, or whether the genetic and environmental etiologies follow partly different pathways. Also, environmental risk factors may act indirectly through the genome, for example by post-genomic modifications via methylation processes (Fraga et al., 2005). To date there is only one study that employed a twin design to examine brain areas linked to ADHD of environmental origin with specific control of genetic factors. In this study by Castellanos and colleagues (Castellanos et al., 2003) anatomic brain magnetic resonance images (MRI) were collected from monozygotic (MZ) twins discordant for ADHD. Since MZ twins are genetically identical, the presence of ADHD in one twin but not the co-twin must originate from differential exposure to environmental risk factors, either directly or through environmental modification of gene expression. Interestingly, after computing volumes of brain areas selected from the MR images, it was found that the affected twins had smaller caudate volumes than their unaffected co-twins. This is in line with the current working hypothesis of a deficit in frontal-striatal processing with ADHD and furthermore suggests that the causal pathways leading to ADHD of environmental origin may, partially, overlap with those in ADHD of genetic origin.
To further our understanding of the genetic and environmental influence on brain defects in ADHD, we present a structural brain imaging study on a sample of twin pairs discordant for the risk of ADHD compared to pairs concordant for high risk of ADHD and pairs concordant for low risk of ADHD. Twin pairs were recruited based on longitudinal data on the CBCL-AP scale available at ages 7, 10 and 12 years. For the concordant groups, twin pairs were selected in which both members scored at either high or low extremes of the CBCL-AP. Inattention and hyperactivity traits are highly heritable and an influence of shared family environment has hardly ever been found (Rietveld et al., 2003). Therefore, these groups of concordant twins likely represent subjects with either high or low genetic vulnerability for ADHD and differences between these groups are expected to highlight brain structures related to the genetically mediated risk for ADHD. The discordant group consisted of twin pairs in which one member scored high and the other low on the CBCL-AP. Intrapair differences for these twins are expected to indicate brain structures modified by adverse environmental exposure for the twins at high risk for ADHD but not their low risk twin counterparts (de Geus et al., 2006). Instead of a region-of-interest approach we assessed differences in anatomy across the whole gray and white matter of the brain on a voxel by voxel basis using Voxel-Based Morphometry (VBM: Ashburner and Friston, 2000; Ashburner and Friston, 2001).
METHODS
Participants
All twins were recruited from the Netherlands Twin Register (NTR: Boomsma et al., 2002). The sample consisted of twins whose mothers had completed the NTR surveys at ages 0, 2, 3, 5, 7, 10, and/or 12 years (n = 6150 pairs). At ages 3, 7, 10 and 12 years the surveys included the CBCL/4–18. For the current purposes, we considered only twins with maternal CBCL-AP ratings from at least two time-points (n = 2887 pairs) at ages 7, 10 or 12 who were classified as monozygotic with a questionnaire method (n = 1058 pairs). Each child was classified as either at high risk or low risk for ADHD based on his/her standardized CBCL-AP T-scores (mean = 50, SD = 10) at ages 7, 10, and 12. T-scores were calculated separately in boys and girls. High risk children had a T-score above 60 at all available time-points and a T-score above 65 at least once. Low risk children had a T-score below 55 at all available time-points. Prior research by our groups and others have shown this to be a sensitive and specific technique to identify children at risk for clinical ADHD (Chen et al., 1994; Derks et al., 2006a; Hudziak et al., 2004; Lehn et al., 2007). Using the CBCL-AP data we identified twin pairs who were concordant high (both twins high CBCL-AP scores), concordant low (both twins low CBCL-AP scores) and discordant (one twin high and co-twin low CBCL-AP score). Two concordant low twin pairs were selected for each discordant pair, matched on sex, zygosity, parental socio-economic status, date of birth, handedness and maternal age. This selection yielded a total of 82 MZ twin pairs; 27 AP concordant high, 37 concordant low and 18 discordant. After the selection, the family of one discordant twin pair discontinued participation. This twin pair and the two associated concordant pairs were excluded. The remaining 79 twin families were invited for an interview with the mother of the twins, to which 72 families agreed (20 concordant high, 35 concordant low, 17 discordant), giving a response rate of 90%. Non-participants included families who could not be contacted (n = 2), declined (n = 3), or were unable to take part for practical reasons (n = 2). Data obtained with the interview and from NTR surveys (collected at ages 0, 2, 3, 5, 7, 10 and 12 years) were examined to determine the twins’ suitability for participation in the MRI-experiments. Twins were excluded with chronic medical or neurological disorders (n = 5; spastic disorder, congenital abnormalities, epilepsy, mitochondrial encephalomyopathy), mental disabilities (n = 3; pervasive developmental disorder, mental retardation), conditions that presumably would make participation too demanding (n = 2; combinations of various mental and physical problems), and use of psychotropic drugs (n = 2; Ritalin, anti-depressants). Concordant pairs who matched non-participating discordant pairs were also excluded (n = 6). This left 54 MZ twin pairs; 11 concordant high, 29 concordant low and 14 discordant twin pairs.
The families of 31 twin pairs (3 concordant high, 17 concordant low, 11 discordant) agreed to participate in the MRI experiments. The remaining declined (n = 12), could not participate due to orthodontic braces (n = 4) or could not be contacted (n = 1). Of these 31 pairs, 28 completed the MRI protocol (see below). All twins were asked to provide buccal cell samples (using mouth swabs) for DNA extraction. Zygosity testing included Polymerase Chain Reaction (PCR) of eleven highly polymorphic genetic markers. Three discordant twin pairs appeared dizygotic and were excluded, which leaves 25 pairs. The final study population included 3 concordant high, 17 concordant low and 5 discordant MZ twin pairs. To assess ADHD status, the mothers of the twins also completed a phone interview, administered by trained medical students, based on the Dutch version of the DISC-IV Parent Version (DISC-IV-P; Lehn et al 2007). None of the twins in our final population met the criteria for an ADHD diagnosis according to this clinical interview. Demographics and AP status of the twin sample are summarized in Table 1. All twins and their parents provided written informed consent and the study was approved by the university ethical review board.
TABLE 1. Twin sample demographics.
List of twin sample demographics. AP status: attention/hyperactivity status of twin pair; Twin pair: twin pair number; Age: age at time of MRI exam (in years); Sex: M = male, F = Female; AP scores: attention and hyperactivity problems for both twins measured with Child Behavior Checklist, AP high = T-score ≥ 60 at all available time points and ≥ 65 at least once; AP low = T-score ≤ 55 at all available time points; Mean AP T-score: mean AP T-scores across 2 or 3 time points (7, 10 and 12 years), computed separately for boys and girls; Aggression T-score: aggression T-scores from CBCL at age 12, separately for boys and girls. Anxious Depressed T-score: anxious depression T-scores from CBCL at age 12, separately for boys and girls; Birth weight: birth weight of each twin in grams; Incubation time: number of days spend in incubator; Comorbidities: at the time of MRI scanning, interview data were obtained from the mothers of the twins on items regarding dyslexia, social phobia, separation anxiety disorder, specific phobia, generalized anxiety disorder, depression, dysthymia, oppositional defiant disorder, and conduct disorder. For twin pairs 11 – 17 of the concordant CBCL-AP low controls interview data were not collected.
| AP status | Twin pair | Age | Sex | AP scores | Mean AP T-score | Aggression T-score | Anxious Depressed T-score | Birth weight | Incubation time | Comorbidities |
|---|---|---|---|---|---|---|---|---|---|---|
| Concordant high | 1 | 14.22 | F | high/high | 66.48/75.53 | 70.70/69.54 | 67.18/72.31 | 3270/2840 | - | dyslexia/dyslexia |
| 2 | 18.35 | F | high/high | 67.51/73.16 | 66.36/60.67 | 57.87/65.65 | 1535/1430 | 28/28 | no/no | |
| 3 | 13.60 | F | high/high | 75.69/83.23 | 66.36/45.01 | 48.56/45.68 | 2350/2540 | - | dyslexia/no | |
|
| ||||||||||
| mean sd | 15.39 | 3F | 69.89/77.31 | 67.80/61.41 | 57.87/61.21 | 2385/2270 | ||||
| 2.58 | 5.05/5.26 | 2.51/7.79 | 9.31/13.86 | 868/743 | ||||||
|
| ||||||||||
| Concordant low | 1 | 17.27 | M | low/low | 39.45/39.81 | 39.46/39.57 | 45.70/46.03 | 2950/3045 | - | no/no |
| 2 | 17.41 | M | low/low | 41.63/41.88 | 39.46/43.16 | 42.69/42.79 | 2500/2560 | -/1.5 | no/no | |
| 3 | 15.93 | F | low/low | 44.52/40.83 | 40.33/40.70 | 42.35/45.68 | 3200/2830 | - | no/no | |
| 4 | 15.84 | M | low/low | 47.97/44.05 | 44.43/44.96 | 42.69/46.03 | 2580/2600 | - | no/no | |
| 5 | 15.47 | F | low/low | 49.78/48.73 | 44.67/47.36 | 48.56/45.68 | 1230/1590 | 32/25 | no/no | |
| 6 | 15.09 | M | low/low | 39.54/39.81 | 39.46/39.57 | 42.69/42.79 | 3000/2690 | -/3 | no/no | |
| 7 | 14.84 | M | low/low | 42.71/39.81 | 42.77/41.37 | 42.69/42.79 | 3000/2800 | - | no/no | |
| 8 | 14.23 | F | low/low | 42.05/40.83 | 40.33/47.36 | 45.46/42.35 | 2830/2600 | - | no/no | |
| 9 | 14.64 | F | low/low | 40.65/40.65 | 53.34/47.36 | 42.35/42.35 | 2460/2680 | - | dyslexia/dyslexia | |
| 10 | 13.24 | M | low/low | 42.20/44.04 | 39.46/39.57 | 45.70/42.79 | 2670/2630 | - | no/no | |
| 11 | 16.75 | F | low/low | 42.06/42.14 | 40.33/40.70 | 42.35/42.35 | 2450/2660 | - | no interview | |
| 12 | 16.17 | M | low/low | 44.73/44.05 | 64.29/59.35 | 51.72/55.74 | 2480/2220 | 1/2.5 | no interview | |
| 13 | 15.54 | F | low/low | 42.05/42.11 | 42.50/42.92 | 42.35/42.35 | 1690/1590 | 23/24 | no interview | |
| 14 | 15.06 | F | low/low | 43.45/43.57 | 53.34/47.36 | 70.29/42.35 | 2330/2020 | 11/12 | no interview | |
| 15 | 14.71 | F | low/low | 46.26/49.13 | 55.51/49.57 | 57.87/49.01 | 2450/2190 | 1/1 | no interview | |
| 16 | 15.63 | F | low/low | 47.31/43.38 | 51.17/49.57 | 45.46/49.01 | 2720/3410 | - | no interview | |
| 17 | 16.27 | F | low/low | 43.03/42.88 | 57.68/47.36 | 42.35/55.66 | 2575/2550 | - | no interview | |
|
| ||||||||||
| mean sd | 15.54 | 10F/7M | 43.49/42.81 | 46.39/45.16 | 46.67/45.63 | 2536/2510 | ||||
| 1.08 | 2.92/2.75 | 7.86/5.13 | 7.39/4.42 | 479/469 | ||||||
|
| ||||||||||
| Discordant | 1 | 16.89 | M | high/low | 67.20/48.99 | 44.96/51.05 | 49.26/48.71 | 2470/2620 | - | no/no |
| 2 | 15.99 | M | high/low | 69.65/46.07 | 44.43/39.57 | 45.70/42.79 | 2900/3000 | 1/1 | no/no | |
| 3 | 15.84 | F | high/low | 65.27/48.53 | 51.79/49.00 | 62.32/60.89 | 1400/2460 | 21/3 | no/no | |
| 4 | 14.70 | F | high/low | 63.77/42.06 | 80.63/44.67 | 78.96/45.46 | 1145/1360 | 21/44 | no/no | |
| 5 | 11.77 | F | high/low | 67.43/51.68 | 76.20/103.2 | 78.96/76.49 | 2315/2315 | 2/2 | no/no | |
|
| ||||||||||
| mean sd | 15.04 | 3F/2M | 66.66/47.47 | 59.60/57.51 | 63.04/54.89 | 2046/2351 | ||||
| 1.99 | 2.24/3.62 | 17.49/25.94 | 15.80/13.94 | 743/610 | ||||||
Image acquisition
The MRI session took about 30 minutes in which 3 separate whole head anatomical scans were consecutively acquired. During the entire scan session the twins remained inside the scanner and were asked to minimize head movement during and between each scan. Scan order of the twins was randomized. Magnetic resonance imaging of the brain was performed on a 1.5 T Sonata MR system (Siemens, Erlangen, Germany) with a standard circularly polarized head coil. The anatomical scans included 160 sagittal slices at 1 mm intervals acquired with a 3D gradient-echo T1- weighted sequence (flip angle 15°; Repetition Time, TR = 1900 ms; Echo Time, TE = 3.93 ms; Inversion Time, TI = 1100 ms). In plane resolution was 256 × 224 pixels (pixel size 1 mm2), gray level resolution was 16 bit.
Volumetric analysis
Prior to volumetric analyses, the integrity of the acquired MR images was visually checked and for each twin the second and third anatomical scans were co-registered to the first. The origin of each MRI volume was aligned on the anterior commissure landmark. Differences in brain anatomy were assessed on a voxel by voxel basis using the optimized voxel-based morphometry (VBM) technique proposed by Good et al. (Good et al., 2001), an extension of the originally introduced standard VBM method (Ashburner and Friston, 2000; Ashburner and Friston, 2001). The automated procedures of VBM were implemented using the MATLAB (The MathWorks, inc) VBM tools by Christian Gaser from the University of Jena, Germany, based on original scripts by John Ashburner and SPM2 analysis software (Wellcome Department of Imaging Neuroscience, London, UK). In a first step standard VBM is used to create study a specific T1 MR template for the whole brain and customized gray matter (GM), white matter (WM) and Cerebrospinal Fluid (CSF) priors. The template and priors were computed across the MRI images from all twin samples. For this purpose, each raw T1 MRI image was spatially normalized to a standard T1 template available in SPM2 (Ashburner et al., 1997; Ashburner and Friston, 1999). Subsequently, the three brain compartments were extracted after image segmentation using voxel by voxel probability mapping with respect to standard GM, WM and CSF priors. Finally, each volume was spatially low pass filtered using a 8 mm full width at half maximum (FWHM) isotropic Gaussian kernel and a smoothed study-specific T1 template and smoothed GM, WM and CSF compartments in standard stereotactic space were obtained by averaging the individual compartments across all twins.
In a following step, the raw MRI images were segmented based on the optimized procedure proposed by Good et al. (Good et al., 2001). Compared to standard VBM, the optimized protocol includes a number of additional processing steps aimed at reducing the probability of voxel classification errors. First, the gray matter partition in native, not normalized, space was extracted from the raw T1 images using the newly obtained customized whole-brain T1 template and GM prior. Subsequently, the spatial normalization parameters for the GM compartment with respect to the GM template were estimated. The obtained deformation matrix/parameter set was then applied to the raw whole-brain MR images. Subsequently, the whole-brain T1 image was resegmented using parametric mapping with respect to the customized priors and the normalized gray and white tissue compartments were extracted. The resolution of the extracted compartment images was 1 mm3. During segmentation the images were corrected for intensity non-uniformities introduced by the MR scanner. To preserve volumetric information, a modulation step was added. This consists of multiplying each voxel intensity value by the determinant of the Jacobian matrix defining the spatial transformation from the original MR images to the normalized MRI template. In this way intensity values of voxels belonging to brain structures that are expanded during the warp are reduced, while voxel intensities from brain structures that are contracted are increased. Accordingly, voxel intensity values of the modulated images code for differences in regional brain size in the raw MR images. Before statistical analyses, the resultant modulated images were smoothed using a 12 mm FWHM isotropic Gaussian kernel. After smoothing, the image data corresponds better with the Gaussian statistics underlying the statistical parametric mapping technique to detect volumetric differences in brain anatomy (Worsley et al., 1996). Spatial smoothing also has the effect of rendering the data more normally distributed and reduces the influence of inaccuracies in spatial normalization of individual brains on the following morphometric comparisons.
Statistical tests
Anatomical differences in the twin brains related to attention and hyperactivity problems were assessed by means of voxel by voxel parametric mapping using the ANOVA tests implemented in SPM2. Statistical tests were performed on modulated gray and white matter compartments. Tests comparing the concordant high with the concordant low twins were performed with for each twin the 3 scan replications as separate measurements (concordant high: 3 twin pairs with 3 replications in each member = 18 volumes; concordant low: 17 pairs with 3 replications in each member = 102 volumes). In these statistical comparisons a potential influence of twin pair sex may be present given that our concordant high twins were all girls, while the concordant low sample consisted of 10 female and 7 male twin pairs (see Table 1). We obtained qualitatively similar results, however, when we performed additional VBM control tests with the male twin pairs excluded from the concordant low sample. In the discordant twin pairs a within-subject ANOVA was performed comparing the 3 replicated compartment scans of each twin and co-twin. Dependence of error variances due to inclusion of measurement replications and correlated repeated measures were accounted for through the non-sphericity correction option in SPM2. Volumetric changes were assumed significant at p < 0.0005, uncorrected for individual voxels, with minimal cluster size of 2000 voxels.
RESULTS
Global volumes
Bar graphs of figure 1 illustrate global volumes of gray matter (top) and white matter (bottom) averaged across the 6 individual tissue extractions of each twin pair (2 twins with 3 replications each). Scatter plots above each bar indicate deviations of compartment volumes with respect to the intrapair means. Statistical tests on global volumes revealed no significant differences for overall gray or white matter between the concordant high risk twins (left bars) and concordant low risk twins (middle bars) [Gray matter high vs. low, 728.23 ± 58.57 vs. 735.87 ± 33.85 ml.: F(118,1) = 0.41, p = 0.53; White matter high vs. low, 411.25 ± 27.34 vs. 420.27 ± 28.91 ml. .: F(118,1) = 1.07, p = 0.30]. As expected, systematic volume differences between the twin and co-twin of each pair (assigned randomly) were also absent.
Figure 1.
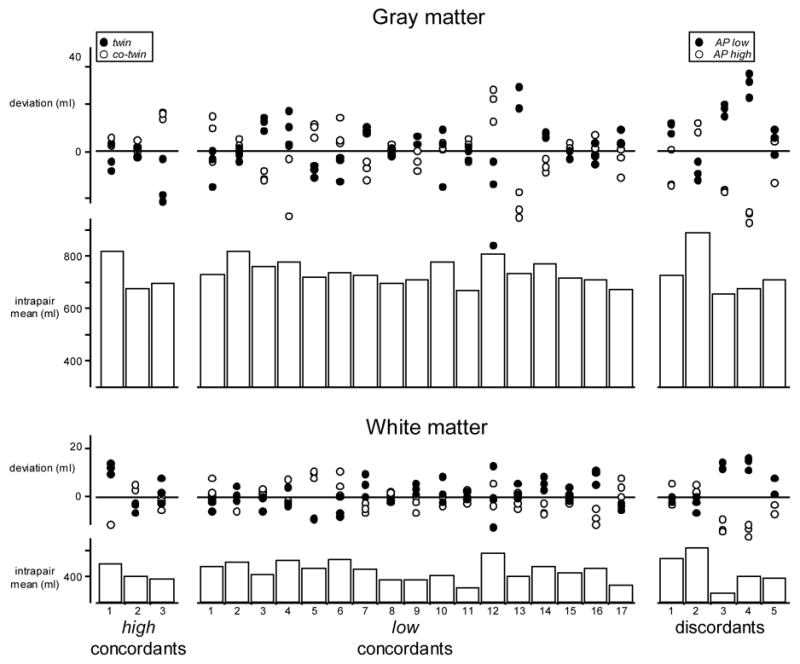
Global volumes of gray matter (top) and white matter (bottom) segmentations. Bars indicate mean compartment volumes across the 6 individual tissue extractions for each pair. Scatter plots indicate deviations of the individual estimates with respect to the intrapair means. For the CBCL-AP high concordants (left) and low concordants (middle), filled and open circles represent the 3 replication measures for twin and co-twin, with random assignment. For the discordants (right), filled and open circles indicate volumes for the CBCL-AP high and low twin.
Deviations of individual volumes within the discordant twin pairs (scatter plots on the right) were of similar size to those observed in the concordant twins. However there appeared to be a systematic difference; in pairs 1, 3, 4 and 5 for gray and 3, 4 and 5 for white tissue, volumes were smaller in the high risk twin (open circles) compared to the low risk co-twin (filled circles). These differences did not reach statistical significance [Gray high vs. low risk, 720.08 ± 71.27 vs. 740.03 ± 55.98 ml.: F(4,1) = 2.55, p = 0.19; White high vs. low risk, 414.59 ± 59.30 vs. 425.20 ± 47.91 ml.: F(4,1) = 2.34, p = 0.20].
Reductions for overall gray or white matter volume have been reported previously in patients with ADHD (Carmona et al., 2005; Durston, 2003).
Voxelwise analyses
Concordant high risk twin pairs versus concordant low risk twin pairs (genetic risk)
Figures 2 and 3 and Table 2 shows clusters of significant regional volumetric decreases and increases from the VBM group comparison between concordant high and low risk pairs.
Figure 2.
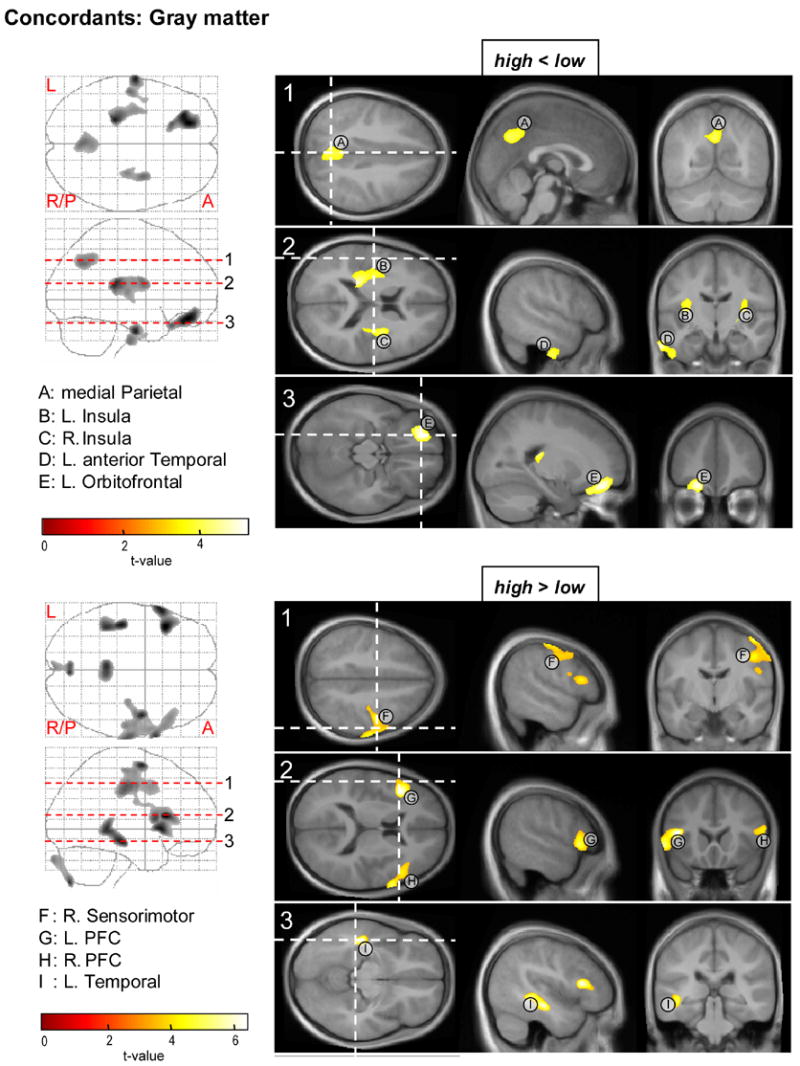
Parametric t-maps for the ANOVA test on regional gray matter volume reductions (top) and increases (bottom) in the CBCL-AP high relative to the AP low concordant twin pairs. On the left; maximal intensity projections of voxels with uncorrected p < 0.0005 in axial and sagittal views. On the right; areas of significant difference projected on average MR sections of the 40 concordant twins, with t-values mapped by the color bar. Horizontal dashed lines in the maximal intensity projections indicate the level of the displayed axial MR slices. Dashed white lines in the axial projections indicate positions of the sagittal and coronal MR sections. PFC = prefrontal cortex.
Figure 3.
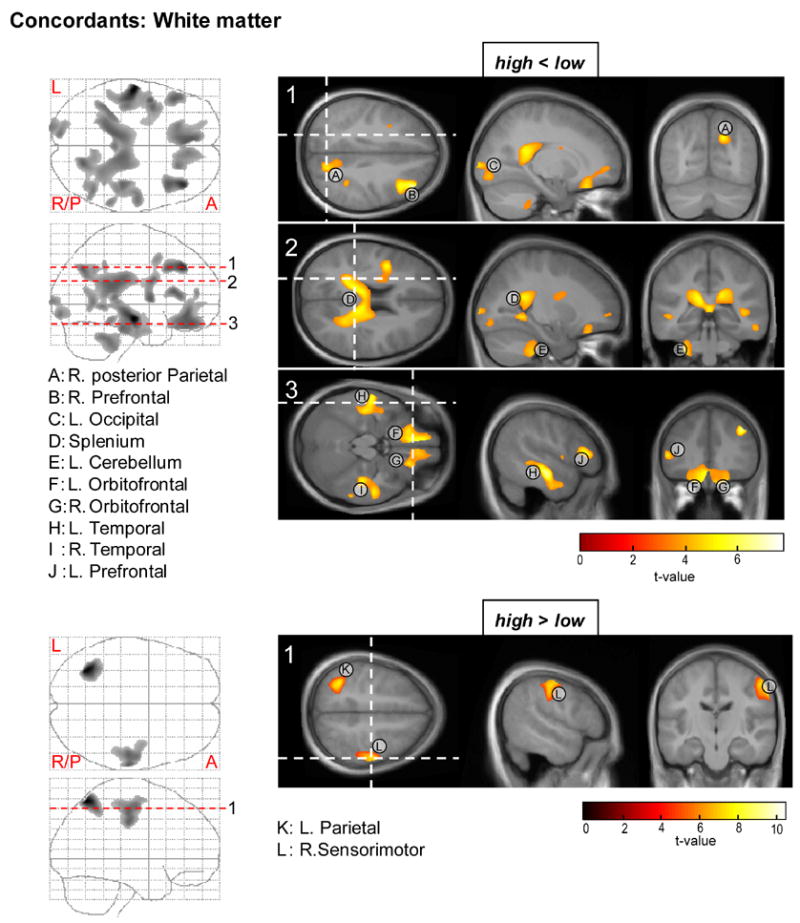
Statistical maps for the ANOVA test on regional white matter reductions (top) and increases (bottom) in the CBCL-AP high relative to low concordant twin pairs.
TABLE 2. Regional brain size differences between CBCL-AP high concordant and low concordant twin pairs.
Regions of significant brain size differences between concordant CBCL-AP high and low twin pairs. Tissue: tissue type tested (gray or white matter); Contrast: test for significant decreases or increases in CBCL-AP high relative to low twins; Cluster label: alphabetical cluster label as displayed in anatomical overlays of figures 2 and 3; Peak-coordinates (mm): location of cluster-voxel with largest effect size (in MNI space); Z score: z-value of voxel with largest effect size. P-value: p-value of cluster, corrected for multiple comparisons at cluster-level; # voxels: number of voxels in cluster; Anatomical location: location of cluster. For cases where regional differences correspond to local maxima within a large interconnected cluster, the p-value and voxel-count of this cluster are displayed in single, merged, cells.
| Peak-coordinates | |||||||||
|---|---|---|---|---|---|---|---|---|---|
| Tissue | Contrast | Cluster label | x | y | z | Z score | p-value | # voxels | Anatomical location |
| Gray | high < low | A | −1 | −63 | 37 | 4.00 | 0.012 | 3694 | Medial Parietal |
| B | −25 | −30 | 17 | 4.69 | 0.003 | 5256 | Left Insula | ||
| C | 32 | −2 | 15 | 4.03 | 0.033 | 2712 | Right Insula | ||
| D | −64 | −11 | −33 | 4.64 | 0.048 | 2393 | Left anterior Temporal | ||
| E | −21 | 42 | −19 | 4.94 | 0.005 | 4504 | Left Orbitofrontal | ||
|
| |||||||||
| high > low | F | 46 | −3 | 64 | 5.45 | 0.000 | 11699 | Right Sensorimotor | |
| H | 50 | 25 | 11 | 4.05 | Right Prefrontal | ||||
| G | −43 | 21 | 13 | 5.89 | 0.003 | 5100 | Left Prefrontal | ||
| I | −45 | −24 | −13 | 5.62 | 0.029 | 2836 | Left Temporal | ||
|
| |||||||||
| White | high < low | A | 19 | −67 | 35 | 5.19 | Right posterior Parietal | ||
| D | −13 | −35 | 20 | 5.18 | 0.000 | 38916 | Splenium | ||
| I | 39 | −26 | −25 | 5.06 | RightTemporal | ||||
| B | 40 | 34 | 38 | 6.07 | 0.004 | 3429 | Right Prefrontal | ||
| C | −18 | −101 | 3 | 4.71 | 0.010 | 2766 | Left Occipital | ||
| E | −39 | −45 | −35 | 4.88 | 0.003 | 3754 | Left Cerebellum | ||
| F | −4 | 37 | −14 | 5.34 | 0.000 | 15044 | Left Orbitofrontal | ||
| G | 21 | 29 | −23 | 4.77 | Right Orbitofrontal | ||||
| H | −58 | −15 | −15 | 6.93 | 0.000 | 11150 | Left Temporal | ||
| J | −48 | 26 | 13 | 5.22 | 0.021 | 2257 | Left Prefrontal | ||
|
| |||||||||
| high > low | K | −34 | −62 | 59 | Inf. | 0.002 | 3828 | Left Parietal | |
| L | 63 | −20 | 39 | 6.54 | 0.000 | 6104 | Right Sensorimotor | ||
Gray matter
Anatomical locations of clusters from the test on gray tissue can be appreciated in figure 2. The high risk twins exhibited significant gray matter deficits in medial parietal (cluster labeled A), left and right insular (B,C), left anterior temporal (D) and left orbitofrontal cortical areas (E).
Increased gray matter relative to the low risk twins was found in the right sensorimotor (F) cortex, left and right prefrontal cortices (G, H) and a left mid temporal region (I).
White matter
VBM analysis of white matter indicated more widespread deficits for the concordant high sample (Fig. 3: top). In line with the gray matter findings, a reduction of white matter compared to the low risk controls was seen in the left orbitofrontal area (area labeled F). Furthermore, the white matter analysis also indicated involvement of the right orbitofrontal region (G), as well as right and left prefrontal regions (areas B and J). In addition to frontal cortex, substantial areas of reduced white matter were found in the left and right temporal lobes (H, I) and in a region encompassing the posterior corpus callosum splenium (area D). Volume reduction of the splenium was accompanied by decrements in posterior white matter tracts, including a right posterior parietal region (A) and the left occiput (C). Finally, an area of reduced white matter was seen in the left cerebellar hemisphere (area E).
Regions of increased white matter (Fig. 3: bottom) included the left parietal cortex (K) and right sensorimotor area (area L: close to a gray matter enhancement observed near this area).
High risk versus low risk twin from discordant pairs (environmental risk)
Figures 4 and 5 and Table 3 indicate clusters of significant volumetric decrements and increments in the high versus low risk twin from discordant pairs.
Figure 4.
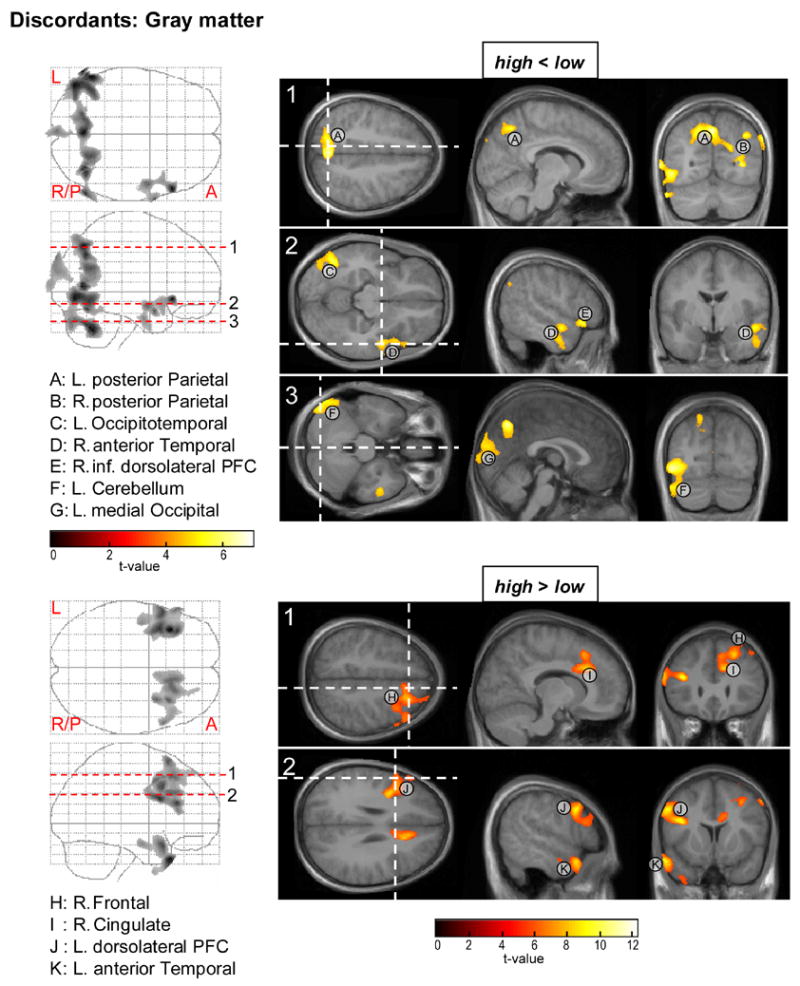
Parametric t-maps for the within subject ANOVA test on regional gray matter reductions (top) and increases (bottom) in the CBCL-AP high compared to low scoring members of the discordant twin pairs. Areas of significant difference are projected on average MR sections of the 10 discordant twins. PFC = prefrontal cortex.
Figure 5.
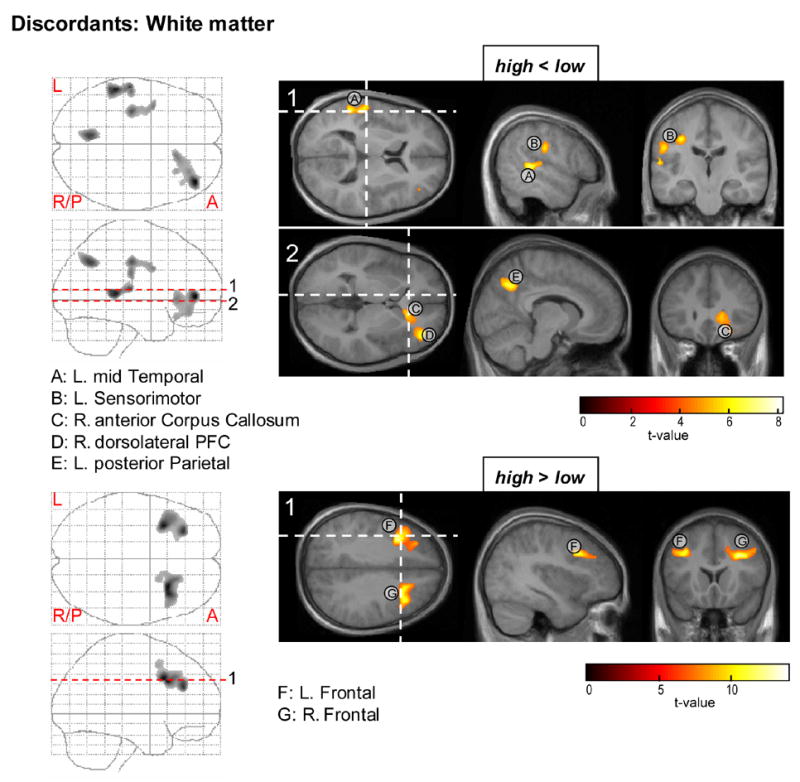
Statistical maps for the within subject ANOVA test on white matter deficits (top) and enhancements (bottom) in the CBCL-AP high versus low discordants. PFC = prefrontal cortex.
TABLE 3. Regional brain size differences between CBCL-AP high and low children of discordant twin pairs.
Regions of significant brain size differences between CBCL-AP high and low scoring children of discordant twin pairs. Tissue: tissue type tested (gray or white matter); Contrast: test for significant decreases or increases in the AP high twins relative to the AP low co-twins; Cluster label: alphabetical cluster label as displayed in anatomical overlays of figures 4 and 5; Peak-coordinates (mm): location of cluster-voxel with largest effect size (in MNI space); Z score: z-value of voxel with largest effect size. P-value: p-value of cluster, corrected for multiple comparisons at cluster-level; # voxels: number of voxels in cluster; Anatomical location: location of cluster. When regional differences correspond to local maxima within a large interconnected cluster, the p-value and voxel-count of this cluster are displayed in single, merged, cells.
| Peak-coordinates | |||||||||
|---|---|---|---|---|---|---|---|---|---|
| Tissue | Test | Cluster label | x | y | z | Z score | p-value | # voxels | Anatomical location |
| Gray | high < low | A | −1 | −67 | 46 | 5.07 | 0.000 | 10893 | Left posterior Parietal |
| B | 40 | −65 | 38 | 4.70 | 0.000 | 2292 | Right posterior Parietal | ||
| C | −50 | −76 | −7 | 5.01 | 0.000 | 13706 | Left Occipitotemporal | ||
| F | −58 | −59 | −40 | 5.04 | Left Cerebellum | ||||
| D | 49 | 13 | −16 | 3.85 | 0.000 | 4338 | Right anterior Temporal | ||
| E | 57 | 23 | −7 | 5.10 | Right inferior dorsolateral Prefrontal | ||||
| high > low | G | −3 | −95 | 35 | 4.13 | 0.000 | 2556 | Left medial Occipital | |
| H | 17 | 23 | 48 | 5.29 | 0.000 | 12428 | Right Frontal | ||
| I | 13 | 22 | 30 | 5.36 | Right Cingulate | ||||
| J | −39 | 11 | 25 | 6.01 | 0.000 | 10599 | Left dorsolateral Prefrontal | ||
| K | −39 | 23 | −37 | 6.50 | 0.000 | 2203 | Left anterior Temporal | ||
| −57 | 14 | −23 | 5.72 | 0.000 | 3294 | ||||
|
| |||||||||
| White | high < low | A | −55 | −35 | 6 | 5.53 | 0.000 | 2905 | Left mid Temporal |
| B | −34 | −19 | 38 | 4.83 | 0.000 | 2197 | Left Sensorimotor | ||
| C | 13 | 26 | 0 | 4.52 | 0.000 | 5896 | Right anterior C orpus Callosum | ||
| D | 40 | 46 | 4 | 5.66 | Right dorsolateral Prefrontal | ||||
| E | −9 | −63 | 39 | 5.01 | 0.000 | 2001 | Left posterior Parietal | ||
|
| |||||||||
| high > low | F | −33 | 15 | 36 | 5.98 | 0.000 | 5215 | Left Frontal | |
| G | 28 | 19 | 33 | 6.14 | 0.000 | 5231 | Right Frontal | ||
Gray matter
Decreased gray matter in the high risk children (Fig. 4: top) was found in left and right posterior regions including left and right posterior parietal cortices (A, B), left occipitotemporal (C) and medial occipital (G) cortices, and the left cerebellar hemisphere (F). Additional gray matter deficit was found in the anterior part of the right hemisphere temporal lobe (D) and in the right inferior dorsolateral prefrontal cortex (E).
Relatively increased gray matter for high compared to low risk twin (Fig. 4: bottom) was observed in a right frontal area (area H), the left dorsolateral prefrontal cortex (J), right cingulate (I) and left anterior temporal lobe (K).
White matter
White matter deficits in the high risk twin of the discordant pairs (Fig. 5: top) were observed in left hemisphere posterior parietal, mid temporal and sensorimotor areas (E, A, B), the right anterior corpus callosum (C) and right dorsolateral prefrontal cortex (D). Relatively increased myelination for the high risk twin (Fig. 5: bottom) was found in left and right frontal brain regions (F and G).
Post-hoc tests
To additionally test for the effect of correlated variances due to the inclusion of repeat scans we also performed the statistical comparisons on averaged scans, across the 3 separate anatomical scans for each individual. This provided results qualitatively similar to the analyses on individual repeats; reflecting a trade-off between the benefit of enhanced image quality on one hand and cost in available data points (a data reduction by a factor of 3) on the other hand. To furthermore examine the effect of having twins of pairs together in groups we also re-evaluated the contrast between concordant high and low AP samples, restricted both to average anatomical images as well as to one twin of each twin pair (two tests were run, one including only the first-born and one with only the second-born twin of each pair). As expected, due to the large negative impact on the available data (a data reduction by a factor of 6; 1 average scan across 3 repeat scans and 1 instead of 2 twins from each pair), the observed contrast test statistics were negatively affected. Nevertheless, the results still indicated involvement of brain areas similar to those observed in the primary tests. Taken together, these additional inferential tests indicate that the inclusion of measurement repeats did not artificially influence our statistical test results.
We did not find any evidence for volume changes of basal ganglia structures including the caudate and putamen, and limited evidence for volume reduction in the cerebellum (a local decrement of left cerebellar white matter in the high concordants and left cerebellar gray matter in the high discordants) and anterior temporal regions (areas of reduced gray matter in the left anterior temporal lobe for the high risk concordants and right anterior temporal lobe for the high risk discordants). In earlier studies on ADHD, gray matter volume reductions have been noted for these structures (Castellanos et al., 2002; Durston, 2003; Seidman et al., 2005; Sowell et al., 2003). Due to the nonstationary nature of neuroanatomy, brain tissue maps do not have a uniform smoothness which may have affected our statistical analyses (Ashburner and Friston, 2000; Worsley et al., 1999). In particular the use of a large cluster threshold (like the minimum of 2000 voxels we applied) may result in real sub-threshold group differences that are missed. To take into account a possible influence of spatial non-stationarities, we re-evaluated the gray matter tests applying an individual voxel based threshold of p < 0.05, adjusted for False Discovery Rate (FDR) combined with a cluster extent limited to 50 voxels. The top panel of figure 6 shows the ANOVA test results for volume reductions in the high versus low concordants. Application of voxel based statistics for this test provided no indication for cerebellar or basal ganglia disruptions. Relaxing the cluster extent threshold did, however, result in additional inclusion of left as well as right (Fig. 6: area labeled C) temporal pole regions. In addition, orbitofrontal brain involvement was extended to include not only left but also mid and right orbitofrontal areas (areas labeled D and E). Evidence for bilateral volume reduction in orbitofrontal and temporal lobe regions is in line with our finding on white matter changes (areas labeled F, G, H, I in Fig. 3). The bottom panel of figure 6 illustrates the within pair test results for gray matter reduction in the high versus low discordant twins. In addition to an extension of involved brain regions already found in the original test, adjustment of the statistical criterion for this contrast indicated a cluster of volume change extending over the right insular cortex and posterior part of the right putamen (area labeled F in Fig. 6; bottom). A similar right hemisphere cluster, and an analogous cluster in the left hemisphere, was found in primary as well as post-hoc tests for volume reductions in high versus low concordant children (Fig. 2: areas B and C; Fig. 6 (top): areas A and B). In agreement with the primary analyses, we observed no involvement of left temporal lobe regions.
Figure 6.
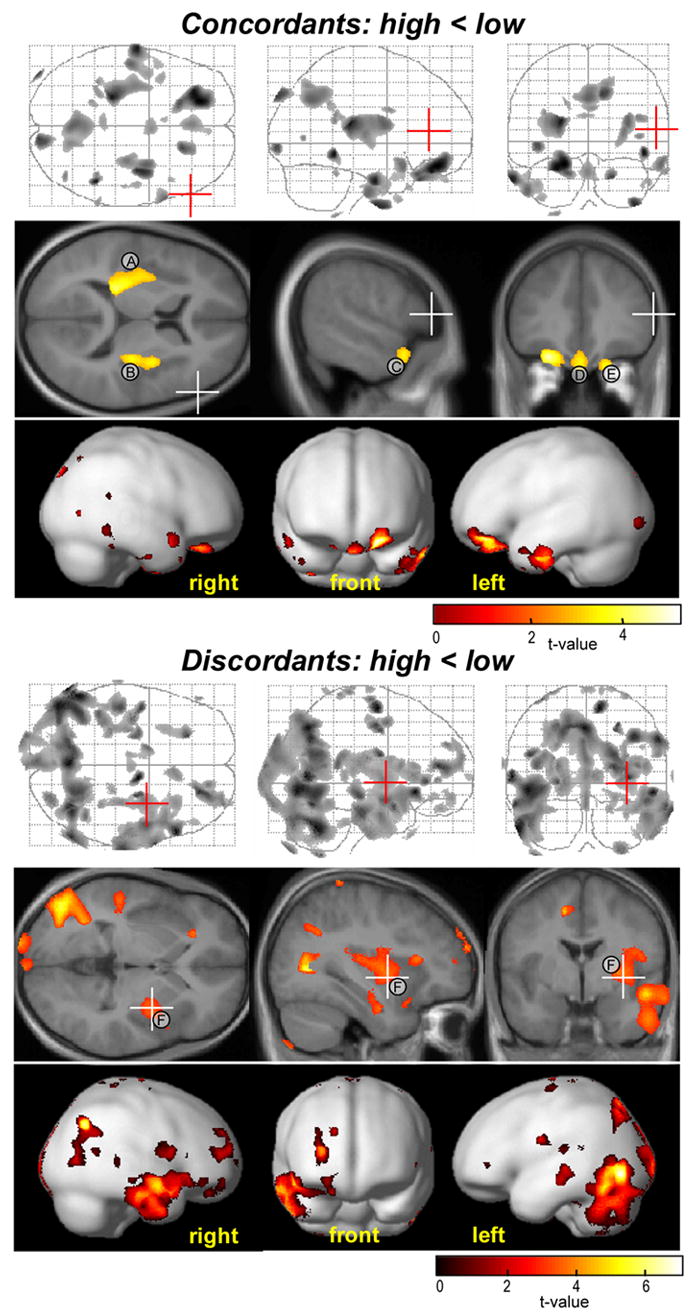
Post-hoc VBM test results with individual voxel based threshold of p<0.05, adjusted for False Discovery Rate (FDR), and cluster extend threshold limited to 50 voxels. Top panel: ANOVA results for the test of gray matter volume reduction in the CBCL-AP high concordant versus AP low concordant twins. Bottom panel: within twin pair ANOVA results for the test of gray matter volume reduction in the AP high versus low member of the discordant twin pairs. In each panel from top to bottom; maximal intensity projections of suprathreshold voxels, suprathreshold voxel clusters projected on selected average MR slices and voxel clusters projected on a smoothed rendering of a standard brain available in SPM2. The t-value mapping is indicated by color bars. Positions of individual MR slices are indicated by red and white axes crossings in maximal intensity projections and MR images, respectively.
DISCUSSION
We examined the brain anatomy of genetically identical twins concordant for high scores on the CBCL4/18 attention problem scale (CBCL-AP), concordant for low scores on the CBCL-AP and a sample of genetically identical twins discordant for CBCL-AP scores. A group comparison of structural brain MRI images between concordant high and concordant low scoring pairs was expected to indicate morphological changes related to the genetically mediated risk for ADHD. Intrapair differences between MR images of twin pairs highly discordant for the CBCL-AP score were expected to indicate morphological changes related to the environmentally mediated risk for ADHD.
Tests for anatomical changes using Voxel Based Morphometry (VBM) revealed significant local brain abnormalities. In the concordant high compared to concordant low risk twins, a prominent volume reduction was evident in the orbitofrontal regions, including significant loss of gray and white matter in the left and significant loss of white matter in the right orbitofrontal cortex. In the discordant comparison, gray matter loss for the high risk twins was restricted to the right inferior dorsolateral prefrontal cortex, and accompanied by adjacent white matter deficits, including a region of the right anterior corpus callosum rostrum. Both group contrasts also revealed temporal lobe abnormalities. In the concordant high risk pairs a reduction of gray matter was observed in a region of the left anterior temporal lobe, combined with white matter decrements in left and right mid temporal areas. In addition, there was evidence for gray matter loss in an anterior temporal region of the left as well as the right hemisphere after applying a more liberal statistical threshold. For the high risk twins of the discordant pairs, gray matter loss was confined to the right anterior temporal cortex, adjacent to the area of gray matter deficit in the inferior dorsolateral prefrontal cortex. In addition to prefrontal and temporal lobe abnormalities, there were changes in the posterior brain. In the concordant high risk twins reduced white matter was found in the posterior corpus callosum splenium, together with decrements of retro-callosal medial parietal gray matter and right parietal and left occipital white matter. Additional areas of gray matter loss were observed in right and left insular cortices. In the high risk twins from discordant pairs, right and left hemisphere gray matter disturbances in occipital, occipitotemporal and posterior parietal regions were found. The posterior corpus callosum appeared normal. Finally, we found an indication for involvement of the cerebellum. In the left cerebellar hemisphere, an area of white matter loss was found in the high risk concordant pairs and an area of gray matter loss in the high risk twin from discordant pairs.
The brain areas with volume loss related to attention/hyperactivity problems as measured with the CBCL in the present study are consistent with earlier reports on structural brain alterations in ADHD. Several anatomical imaging studies reported ADHD related volume decrements in orbitofrontal (Carmona et al., 2005; Giedd et al., 2001b) and dorsolateral prefrontal lobes (Carmona et al., 2005; Castellanos et al., 1996; Durston et al., 2004; Filipek et al., 1997; Hill et al., 2003; Kates et al., 2002; Overmeyer et al., 2001; Semrud-Clikeman et al., 2000). Orbitofrontal reductions in ADHD children have generally been found largest in the right hemisphere (Carmona et al., 2005; Giedd et al., 2001b). One study also reported orbitofrontal volume loss in adult ADHD subjects, localized in the left hemisphere (Hesslinger et al., 2002). Reduced dorsolateral prefrontal cortex volume has been reported with right (Castellanos et al., 1996; Durston et al., 2004; Filipek et al., 1997; Hill et al., 2003; Overmeyer et al., 2001; Semrud-Clikeman et al., 2000) as well as left hemisphere (Carmona et al., 2005; Kates et al., 2002) dominance. Orbitofrontal and dorsolateral prefrontal brain deficits are in line both with earlier and more recent cognitive models of impaired executive function/inhibition in ADHD (Barkley, 1997; Castellanos et al., 2006). The orbitofrontal subdivisions of the prefrontal lobes are presumed to participate in goal directed processing through inhibition of distracting information and impulses, while the dorsolateral prefrontal areas are hypothesized to contribute by supporting action planning and programming and working memory (Fuster, 2002). Orbitofrontal and dorsolateral prefrontal cortex dysfunction due to lesions or epilepsy typically results in attention problems and emotional instability and impulsivity, similar to symptoms of ADHD (Eslinger et al., 2004; Max et al., 2005b; Max et al., 2005a; Powell et al., 1997).
Our finding of volume reductions in temporal and occipitoparietal brain areas and cerebellum, i.e., regions outside those predicted by the current fronto-striatal model of ADHD, also agrees with earlier work (for a review see Seidman et al., 2005). Volume reduction of the temporal lobes in ADHD has been demonstrated in a cross-sectional anatomical MRI study in ADHD children and adolescents by Castellanos et al. (Castellanos et al., 2002). In addition, Sowell et al. (Sowell et al., 2003), applied a regional morphometric analysis technique on brain MR images of ADHD children and observed gray matter reductions in both anterior temporal lobes combined with gray matter defects in inferior dorsolateral prefrontal regions. Many recent anatomical MRI studies also confirm the presence of posterior brain deficits, including the posterior corpus callosum splenium (Hill et al., 2003; Lyoo et al., 1996; Semrud-Clikeman et al., 1994) and occipital and parietal lobe regions (Castellanos et al., 2002; Durston et al., 2004; Filipek et al., 1997). Volume reduction of the cerebellum has also consistently been reported in previous neuroimaging studies on ADHD children (Carmona et al., 2005; Castellanos et al., 1996; Durston, 2003; Hill et al., 2003; Krain and Castellanos, 2006; Seidman et al., 2005).
Dysfunction of the cerebellum and occipitoparietal and temporal brain regions may well relate to attentional impairment and hyperactivity. The cerebellum is assumed to be involved in the modulation of frontal-striatal activity (Giedd et al., 2001a). The occipital cortex is relevant for visual processing and the posterior corpus callosum for inter-hemispheric transfer of visual information. The posterior parietal cortex provides access to a multimodal representation of extra personal space and is relevant for spatial attention (Posner and Petersen, 1990). Finally, the anterior temporal lobes are presumed to be higher association areas that regulate access to and binding of perceptual information from different sensory modalities to establish face-object recognition (Ungerleider and Haxby, 1994). It has been suggested that posterior and temporal brain regions interact with the prefrontal cortex in a large-scale network that controls attentional focus and prevents distracting impulses (Mesulam, 1998). Our findings indicate that the attentional deficits in our high risk twins relate to anatomical abnormalities of this proposed action-attentional network and furthermore that disruption of this network appears to be located at different brain areas for attention and hyperactivity problems of genetic and environmental etiology. Most prominently, there was a difference with regard to the prefrontal lobe regions involved; in genetically mediated risk for ADHD mainly the orbitofrontal subdivisions and in environmentally mediated risk mainly the inferior dorsolateral prefrontal cortex showed morphological changes. An additional difference was noted for the posterior brain; decreased volume of the posterior corpus callosum was found for attention/hyperactivity problems of genetic origin, only.
Our findings on brain deficits associated with environmental stressors differ from a recent report on ADHD discordant MZ twins by Castellanos et al. (Castellanos et al., 2003). In a region of interest approach including segmentations of frontal, temporal, parietal and occipital lobes as well as caudate and cerebellum, these researchers found ADHD related volume deficits only for the caudate nuclei. In contrast, we observed volume deficits for several neocortical areas and the cerebellum, but not the striatum. This discrepancy can have several explanations. For example, the absence of caudate deficits may indicate that basal ganglia abnormalities are more severe in patients clinically diagnosed with ADHD compared to individuals at strong risk for the disorder based on CBCL-AP scores. Our failure to find caudate changes may also be due to a vulnerability to false negatives, because the current sample (5 discordant pairs) is smaller compared to the Castellanos et al. study (9 discordant pairs). Alternatively, in another recent report Castellanos et al. (Castellanos et al., 2002) found that children with ADHD start out with smaller caudate nuclei than normal controls, but that caudate size decreases with maturation and more so for normal controls than ADHD children. Consequently, any caudate size difference during childhood becomes less apparent at later ages. The fact that the twins in our sample were of relatively higher age (11.8 – 16.9 yrs) compared to the Castellanos et al. (Castellanos et al., 2003) sample (5.6 – 15.6 yrs) may therefore also explain the dissimilar findings. Finally, there are differences in the techniques to examine morphologic changes. Voxel based approaches like the present one have shown to correlate well with region of interest methods, but complementary use of both comparison types has been advocated (Giuliani et al., 2005; Kubicki et al., 2002). It should be noted though that a recent neuroimaging study that applied a voxel based comparison in ADHD children did find evidence for regional basal ganglia deficits (Overmeyer et al., 2001).
In addition to regional volume loss, our results also indicated clusters of increased brain tissue, in both anterior and posterior brain regions for the concordant high risk pairs and restricted to the frontal brain for the high risk twin from discordant pairs. The finding of gray and white tissue increments appears to contrast with earlier ADHD studies. It should be noted however that earlier results predominantly relied on region of interest methods. Voxel by voxel approaches likely afford a more detailed examination of local morphological changes. Recently, Sowell et al. (Sowell et al., 2003) used a computational technique and also found locally increased gray matter in ADHD children, mainly restricted to posterior temporal and inferior parietal cortices. Gray/white matter increments may exist for many reasons. Neural tissue enhancement might be introduced by a regional lack of synaptic pruning during brain development (Huttenlocher, 1979). Alternatively, local volume increments may reflect a plastic adjustment to compensate for neural loss and consequently reduced processing capability of adjacent brain regions. It has also been proposed that disruption of white matter in a certain brain region may result in increased gray matter in the same area, due to increased intra-cortical myelination (Sowell et al., 2003). Conversely, regions with decreased gray matter may be paired with locally enhanced white matter. Our data, however, provide no conclusive evidence of systematic inverse relations between regional gray and white matter volume changes. Additional research is needed to replicate the presence of locally increased cerebral tissue in attention/hyperactivity problems and further our understanding about the neuropathophysiology underlying these morphological changes.
The present sample size does not afford us to draw conclusions about the environmental risk factors for attention/hyperactivity problems. The sample selected for MRI, was however drawn from a larger population of concordant high and low, and high-low discordant twin pairs selected for behavioral characterization (Lehn et al., 2007). Statistical analysis on survey data (maternal, teacher and self reports) from the 19 CBCL-AP discordant pairs in that study, indicated that the within pair difference in attention/hyperactivity symptomatology existed since toddlerhood (age 3) and persisted at ages 5, 7, 10 and 12. Compared to their low risk co-twins, the CBCL-AP high discordant twins also reported other behavioral problems. They showed more rule breaking behavior, more social problems, and were more aggressive, withdrawn and anxious/depressed. T-scores for aggression and anxious depression in the present MRI subsample (from CBCL at age 12) are listed in Table 1. With regard to the environmental conditions predictive of inattention/hyperactivity, it was found that the discordants “at risk” for ADHD experienced significantly more adversity during infancy (lower birth weight and longer incubation). Our subsample reflected a tendency for lower birth weight, but not longer incubation (Table 1). The behavioral study also indicated that the CBCL-AP high discordants showed disadvantaged maturation (delayed physical growth and lagged early motor development, specifically with regard to developmental milestones of learning to role over and sit upright).
In conclusion, the present neuroimaging study suggests that the neurobiological pathways underlying attention and hyperactivity symptoms of genetic or external environmental origin are partly distinct. Behavioral problems for both etiologies appear to reflect reduced function of an action-attentional network of cerebellar, occipital/parietal and temporal brain regions interacting with the prefrontal cortex. This network seems to be compromised at different brain areas, especially within the prefrontal lobes. In attention deficit/hyperactivity of genetic origin the medial orbitofrontal subdivisions and in attention/hyperactivity problems of environmental origin the right inferior dorsolateral prefrontal cortex were abnormal. A difference was also noted for the posterior corpus callosum which was only disrupted in attention/hyperactivity disturbances of genetic origin. These inferences could be made by examining anatomical MRI images of genetically identical twins at “selective” genetic or environmental risk for ADHD as inferred from the CBCL-AP inventory. In the general population, symptoms of inattention and hyperactivity are likely caused by shared genetic and environmental risk factors. Therefore individuals with inattentiveness/hyperactivity may exhibit anatomical abnormalities in different areas of the action-attentional network. This may importantly contribute to the widespread brain deficits and general heterogeneity of these deficits reported in earlier neuroanatomical studies on ADHD patients.
Footnotes
Funded by NWO/SPI 56-464-14192; NIMH, RO1 MH58799-03; NIH R21 MH66148-01; Center for Neurogenomics and Cognitive Research (CNCR).
Publisher's Disclaimer: This is a PDF file of an unedited manuscript that has been accepted for publication. As a service to our customers we are providing this early version of the manuscript. The manuscript will undergo copyediting, typesetting, and review of the resulting proof before it is published in its final citable form. Please note that during the production process errors may be discovered which could affect the content, and all legal disclaimers that apply to the journal pertain.
Reference List
- American Psychiatric Association. Diagnostic and statistical manual of mental disorder: DSM-IV. 4. Washington, DC: American Psychiatric Association; 1994. [Google Scholar]
- Ashburner J, Friston KJ. Nonlinear spatial normalization using basis functions. Human Brain Mapping. 1999;7:254–266. doi: 10.1002/(SICI)1097-0193(1999)7:4<254::AID-HBM4>3.0.CO;2-G. [DOI] [PMC free article] [PubMed] [Google Scholar]
- Ashburner J, Friston KJ. Voxel-based morphometry - The methods. Neuroimage. 2000;11:805–821. doi: 10.1006/nimg.2000.0582. [DOI] [PubMed] [Google Scholar]
- Ashburner J, Friston KJ. Why voxel-based morphometry should be used. Neuroimage. 2001;14:1238–1243. doi: 10.1006/nimg.2001.0961. [DOI] [PubMed] [Google Scholar]
- Ashburner J, Neelin P, Collins DL, Evans A, Friston K. Incorporating prior knowledge into image registration. Neuroimage. 1997;6:344–352. doi: 10.1006/nimg.1997.0299. [DOI] [PubMed] [Google Scholar]
- Auerbach JG, Benjamin J, Faroy M, Geller V, Ebstein R. DRD4 related to infant attention and information processing: a developmental link to ADHD? Psychiatr Genet. 2001;11:31–35. doi: 10.1097/00041444-200103000-00006. [DOI] [PubMed] [Google Scholar]
- Barkley RA. Behavioral inhibition, sustained attention, and executive functions: constructing a unifying theory of ADHD. Psychol Bull. 1997;121:65–94. doi: 10.1037/0033-2909.121.1.65. [DOI] [PubMed] [Google Scholar]
- Bhutta AT, Anand KJ. Abnormal cognition and behavior in preterm neonates linked to smaller brain volumes. Trends Neurosci. 2001;24:129–130. doi: 10.1016/s0166-2236(00)01747-1. [DOI] [PubMed] [Google Scholar]
- Boomsma DI, Vink JM, van Beijsterveldt TC, de Geus EJ, Beem AL, Mulder EJ, Derks EM, Riese H, Willemsen GA, Bartels M, van den BM, Kupper NH, Polderman TJ, Posthuma D, Rietveld MJ, Stubbe JH, Knol LI, Stroet T, van Baal GC. Netherlands Twin Register: a focus on longitudinal research. Twin Res. 2002;5:401–406. doi: 10.1375/136905202320906174. [DOI] [PubMed] [Google Scholar]
- Brookes KJ, Mill J, Guindalini C, Curran S, Xu X, Knight J, Chen CK, Huang YS, Sethna V, Taylor E, Chen W, Breen G, Asherson P. A common haplotype of the dopamine transporter gene associated with attention-deficit/hyperactivity disorder and interacting with maternal use of alcohol during pregnancy. Arch Gen Psychiatry. 2006;63:74–81. doi: 10.1001/archpsyc.63.1.74. [DOI] [PubMed] [Google Scholar]
- Carmona S, Vilarroya O, Bielsa A, Tremols V, Soliva JC, Rovira M, Tomas J, Raheb C, Gispert JD, Batlle S, Bulbena A. Global and regional gray matter reductions in ADHD: a voxel-based morphometric study. Neurosci Lett. 2005;389:88–93. doi: 10.1016/j.neulet.2005.07.020. [DOI] [PubMed] [Google Scholar]
- Castellanos FX, Giedd JN, Marsh WL, Hamburger SD, Vaituzis AC, Dickstein DP, Sarfatti SE, Vauss YC, Snell JW, Lange N, Kaysen D, Krain AL, Ritchie GF, Rajapakse JC, Rapoport JL. Quantitative brain magnetic resonance imaging in attention-deficit hyperactivity disorder. Arch Gen Psychiatry. 1996;53:607–616. doi: 10.1001/archpsyc.1996.01830070053009. [DOI] [PubMed] [Google Scholar]
- Castellanos FX, Lee PP, Sharp W, Jeffries NO, Greenstein DK, Clasen LS, Blumenthal JD, James RS, Ebens CL, Walter JM, Zijdenbos A, Evans AC, Giedd JN, Rapoport JL. Developmental trajectories of brain volume abnormalities in children and adolescents with attention-deficit/hyperactivity disorder. JAMA. 2002;288:1740–1748. doi: 10.1001/jama.288.14.1740. [DOI] [PubMed] [Google Scholar]
- Castellanos FX, Sharp WS, Gottesman RF, Greenstein DK, Giedd JN, Rapoport JL. Anatomic brain abnormalities in monozygotic twins discordant for attention deficit hyperactivity disorder. Am J Psychiatry. 2003;160:1693–1696. doi: 10.1176/appi.ajp.160.9.1693. [DOI] [PubMed] [Google Scholar]
- Castellanos FX, Sonuga-Barke EJ, Milham MP, Tannock R. Characterizing cognition in ADHD: beyond executive dysfunction. Trends Cogn Sci. 2006;10:117–123. doi: 10.1016/j.tics.2006.01.011. [DOI] [PubMed] [Google Scholar]
- Chen WJ, Faraone SV, Biederman J, Tsuang MT. Diagnostic accuracy of the Child Behavior Checklist scales for attention-deficit hyperactivity disorder: a receiver-operating characteristic analysis. J Consult Clin Psychol. 1994;62:1017–1025. doi: 10.1037/0022-006X.62.5.1017. [DOI] [PubMed] [Google Scholar]
- de Geus EJ, Ent DV, Wolfensberger SP, Heutink P, Hoogendijk WJ, Boomsma DI, Veltman DJ. Intrapair Differences in Hippocampal Volume in Monozygotic Twins Discordant for the Risk for Anxiety and Depression. Biol Psychiatry. 2006 doi: 10.1016/j.biopsych.2006.07.026. Epub ahead of print. [DOI] [PubMed] [Google Scholar]
- Derks EM, Hudziak JJ, Dolan CV, Ferdinand RF, Boomsma DI. The relations between DISC-IV DSM diagnoses of ADHD and multi-informant CBCL-AP syndrome scores. Compr Psychiatry. 2006a;47:116–122. doi: 10.1016/j.comppsych.2005.05.006. [DOI] [PubMed] [Google Scholar]
- Derks EM, Hudziak JJ, Dolan CV, van Beijsterveldt TCEM, Verhulst FC, Boomsma DI. Genetic and environmental influences on the relation between attention problems and attention deficit hyperactivity disorder. 2006b doi: 10.1007/s10519-007-9178-8. In revision. [DOI] [PMC free article] [PubMed] [Google Scholar]
- Durston S. A review of the biological bases of ADHD: what have we learned from imaging studies? Ment Retard Dev Disabil Res Rev. 2003;9:184–195. doi: 10.1002/mrdd.10079. [DOI] [PubMed] [Google Scholar]
- Durston S, Fossella JA, Casey BJ, Hulshoff Pol HE, Galvan A, Schnack HG, Steenhuis MP, Minderaa RB, Buitelaar JK, Kahn RS, van Engeland H. Differential effects of DRD4 and DAT1 genotype on fronto-striatal gray matter volumes in a sample of subjects with attention deficit hyperactivity disorder, their unaffected siblings, and controls. Mol Psychiatry. 2005;10:678–685. doi: 10.1038/sj.mp.4001649. [DOI] [PubMed] [Google Scholar]
- Durston S, Hulshoff Pol HE, Schnack HG, Buitelaar JK, Steenhuis MP, Minderaa RB, Kahn RS, van Engeland H. Magnetic resonance imaging of boys with attention-deficit/hyperactivity disorder and their unaffected siblings. J Am Acad Child Adolesc Psychiatry. 2004;43:332–340. doi: 10.1097/00004583-200403000-00016. [DOI] [PubMed] [Google Scholar]
- Eaves LJ, Silberg JL, Maes HH. Revisiting the children of twins: can they be used to resolve the environmental effects of dyadic parental treatment on child behavior? Twin Res Hum Genet. 2005;8:283–290. doi: 10.1375/1832427054936736. [DOI] [PubMed] [Google Scholar]
- Eslinger PJ, Flaherty-Craig CV, Benton AL. Developmental outcomes after early prefrontal cortex damage. Brain Cogn. 2004;55:84–103. doi: 10.1016/S0278-2626(03)00281-1. [DOI] [PubMed] [Google Scholar]
- Faraone SV, Biederman J, Mick E. The age-dependent decline of attention deficit hyperactivity disorder: a meta-analysis of follow-up studies. Psychol Med. 2006;36:159–165. doi: 10.1017/S003329170500471X. [DOI] [PubMed] [Google Scholar]
- Filipek PA, Semrud-Clikeman M, Steingard RJ, Renshaw PF, Kennedy DN, Biederman J. Volumetric MRI analysis comparing subjects having attention-deficit hyperactivity disorder with normal controls. Neurology. 1997;48:589–601. doi: 10.1212/wnl.48.3.589. [DOI] [PubMed] [Google Scholar]
- Fraga MF, Ballestar E, Paz MF, Ropero S, Setien F, Ballestar ML, Heine-Suner D, Cigudosa JC, Urioste M, Benitez J, Boix-Chornet M, Sanchez-Aguilera A, Ling C, Carlsson E, Poulsen P, Vaag A, Stephan Z, Spector TD, Wu YZ, Plass C, Esteller M. Epigenetic differences arise during the lifetime of monozygotic twins. Proc Natl Acad Sci USA. 2005;102:10604–10609. doi: 10.1073/pnas.0500398102. [DOI] [PMC free article] [PubMed] [Google Scholar]
- Fuster JM. Frontal lobe and cognitive development. J Neurocytol. 2002;31:373–385. doi: 10.1023/a:1024190429920. [DOI] [PubMed] [Google Scholar]
- Gerring J, Brady K, Chen A, Quinn C, Herskovits E, Bandeen-Roche K, Denckla MB, Bryan RN. Neuroimaging variables related to development of Secondary Attention Deficit Hyperactivity Disorder after closed head injury in children and adolescents. Brain Inj. 2000;14:205–218. doi: 10.1080/026990500120682. [DOI] [PubMed] [Google Scholar]
- Giedd JN, Blumenthal J, Molloy E, Castellanos FX. Brain imaging of attention deficit/hyperactivity disorder. Ann NYAcad Sci. 2001a;931:33–49. doi: 10.1111/j.1749-6632.2001.tb05772.x. [DOI] [PubMed] [Google Scholar]
- Giedd JN, Blumenthal J, Molloy E, Castellanos FX. Brain imaging of attention deficit/hyperactivity disorder. Ann NYAcad Sci. 2001c;931:33–49. doi: 10.1111/j.1749-6632.2001.tb05772.x. [DOI] [PubMed] [Google Scholar]
- Giedd JN, Blumenthal J, Molloy E, Castellanos FX. Brain imaging of attention deficit/hyperactivity disorder. Ann NYAcad Sci. 2001b;931:33–49. doi: 10.1111/j.1749-6632.2001.tb05772.x. [DOI] [PubMed] [Google Scholar]
- Giuliani NR, Calhoun VD, Pearlson GD, Francis A, Buchanan RW. Voxel-based morphometry versus region of interest: a comparison of two methods for analyzing gray matter differences in schizophrenia. Schizophr Res. 2005;74:135–147. doi: 10.1016/j.schres.2004.08.019. [DOI] [PubMed] [Google Scholar]
- Goldman LS, Genel M, Bezman RJ, Slanetz PJ. Diagnosis and treatment of attention-deficit/hyperactivity disorder in children and adolescents. Council on Scientific Affairs, American Medical Association. JAMA. 1998;279:1100–1107. doi: 10.1001/jama.279.14.1100. [DOI] [PubMed] [Google Scholar]
- Good CD, Johnsrude IS, Ashburner J, Henson RNA, Friston KJ, Frackowiak RSJ. A voxel-based morphometric study of ageing in 465 normal adult human brains. Neuroimage. 2001;14:21–36. doi: 10.1006/nimg.2001.0786. [DOI] [PubMed] [Google Scholar]
- Herskovits EH, Megalooikonomou V, Davatzikos C, Chen A, Bryan RN, Gerring JP. Is the spatial distribution of brain lesions associated with closed-head injury predictive of subsequent development of attention-deficit/hyperactivity disorder? Analysis with brain-image database. Radiology. 1999;213:389–394. doi: 10.1148/radiology.213.2.r99nv45389. [DOI] [PubMed] [Google Scholar]
- Hesslinger B, Tebartz vE, Thiel T, Haegele K, Hennig J, Ebert D. Frontoorbital volume reductions in adult patients with attention deficit hyperactivity disorder. Neurosci Lett. 2002;328:319–321. doi: 10.1016/s0304-3940(02)00554-2. [DOI] [PubMed] [Google Scholar]
- Hill DE, Yeo RA, Campbell RA, Hart B, Vigil J, Brooks W. Magnetic resonance imaging correlates of attention-deficit/hyperactivity disorder in children. Neuropsychology. 2003;17:496–506. doi: 10.1037/0894-4105.17.3.496. [DOI] [PubMed] [Google Scholar]
- Hudziak JJ, Copeland W, Rudiger LP, Achenbach TM, Heath AC, Todd RD. Genetic influences on childhood competencies: a twin study. J Am Acad Child Adolesc Psychiatry. 2003;42:357–363. doi: 10.1097/00004583-200303000-00017. [DOI] [PubMed] [Google Scholar]
- Hudziak JJ, Copeland W, Stanger C, Wadsworth M. Screening for DSM-IV externalizing disorders with the Child Behavior Checklist: a receiver-operating characteristic analysis. J Child Psychol Psychiatry. 2004;45:1299–1307. doi: 10.1111/j.1469-7610.2004.00314.x. [DOI] [PubMed] [Google Scholar]
- Hudziak JJ, Derks EM, Althoff RR, Rettew DC, Boomsma DI. The genetic and environmental contributions to attention deficit hyperactivity disorder as measured by the Conners’ Rating Scales--Revised. Am J Psychiatry. 2005;162:1614–1620. doi: 10.1176/appi.ajp.162.9.1614. [DOI] [PubMed] [Google Scholar]
- Hudziak JJ, Rudiger LP, Neale MC, Heath AC, Todd RD. A twin study of inattentive, aggressive, and anxious/depressed behaviors. J Am Acad Child Adolesc Psychiatry. 2000;39:469–476. doi: 10.1097/00004583-200004000-00016. [DOI] [PubMed] [Google Scholar]
- Huizink AC, Mulder EJ. Maternal smoking, drinking or cannabis use during pregnancy and neurobehavioral and cognitive functioning in human offspring. Neurosci Biobehav Rev. 2006;30:24–41. doi: 10.1016/j.neubiorev.2005.04.005. [DOI] [PubMed] [Google Scholar]
- Huttenlocher PR. Synaptic density in human frontal cortex - developmental changes and effects of aging. Brain Res. 1979;163:195–205. doi: 10.1016/0006-8993(79)90349-4. [DOI] [PubMed] [Google Scholar]
- Kahn RS, Khoury J, Nichols WC, Lanphear BP. Role of dopamine transporter genotype and maternal prenatal smoking in childhood hyperactive-impulsive, inattentive, and oppositional behaviors. J Pediatr. 2003;143:104–110. doi: 10.1016/S0022-3476(03)00208-7. [DOI] [PubMed] [Google Scholar]
- Kates WR, Frederikse M, Mostofsky SH, Folley BS, Cooper K, Mazur-Hopkins P, Kofman O, Singer HS, Denckla MB, Pearlson GD, Kaufmann WE. MRI parcellation of the frontal lobe in boys with attention deficit hyperactivity disorder or Tourette syndrome. Psychiatry Res. 2002;116:63–81. doi: 10.1016/s0925-4927(02)00066-5. [DOI] [PubMed] [Google Scholar]
- Krain AL, Castellanos FX. Brain development and ADHD. Clin Psychol Rev. 2006 doi: 10.1016/j.cpr.2006.01.005. [DOI] [PubMed] [Google Scholar]
- Kubicki M, Shenton ME, Salisbury DF, Hirayasu Y, Kasai K, Kikinis R, Jolesz FA, McCarley RW. Voxel-based morphometric analysis of gray matter in first episode schizophrenia. Neuroimage. 2002;17:1711–1719. doi: 10.1006/nimg.2002.1296. [DOI] [PMC free article] [PubMed] [Google Scholar]
- Lehn H, Derks EM, Hudziak JJ, Heutink P, van Beijsterveldt TCEM, Boomsma DI. Attention Problems and Attention Deficit Hyperactivity Disorder in Discordant and Concordant MZ twins: Evidence of Environmental Mediators. J Am Acad Child Adolesc Psychiatry. 2007;46:83–91. doi: 10.1097/01.chi.0000242244.00174.d9. [DOI] [PubMed] [Google Scholar]
- Linnet KM, Dalsgaard S, Obel C, Wisborg K, Henriksen TB, Rodriguez A, Kotimaa A, Moilanen I, Thomsen PH, Olsen J, Jarvelin MR. Maternal lifestyle factors in pregnancy risk of attention deficit hyperactivity disorder and associated behaviors: review of the current evidence. Am J Psychiatry. 2003;160:1028–1040. doi: 10.1176/appi.ajp.160.6.1028. [DOI] [PubMed] [Google Scholar]
- Lou HC, Henriksen L, Bruhn P, Borner H, Nielsen JB. Striatal dysfunction in attention deficit and hyperkinetic disorder. Arch Neurol. 1989;46:48–52. doi: 10.1001/archneur.1989.00520370050018. [DOI] [PubMed] [Google Scholar]
- Lou HC, Rosa P, Pryds O, Karrebaek H, Lunding J, Cumming P, Gjedde A. ADHD: increased dopamine receptor availability linked to attention deficit and low neonatal cerebral blood flow. Dev Med Child Neurol. 2004;46:179–183. doi: 10.1017/s0012162204000313. [DOI] [PubMed] [Google Scholar]
- Lyoo IK, Noam GG, Lee CK, Lee HK, Kennedy BP, Renshaw PF. The corpus callosum and lateral ventricles in children with attention-deficit hyperactivity disorder: a brain magnetic resonance imaging study. Biol Psychiatry. 1996;40:1060–1063. doi: 10.1016/s0006-3223(96)00349-6. [DOI] [PubMed] [Google Scholar]
- Max JE, Fox PT, Lancaster JL, Kochunov P, Mathews K, Manes FF, Robertson BA, Arndt S, Robin DA, Lansing AE. Putamen lesions and the development of attention-deficit/hyperactivity symptomatology. J Am Acad Child Adolesc Psychiatry. 2002;41:563–571. doi: 10.1097/00004583-200205000-00014. [DOI] [PubMed] [Google Scholar]
- Max JE, Manes FF, Robertson BA, Mathews K, Fox PT, Lancaster J. Prefrontal and executive attention network lesions and the development of attention-deficit/hyperactivity symptomatology. J Am Acad Child Adolesc Psychiatry. 2005a;44:443–450. doi: 10.1097/01.chi.0000156661.38576.0f. [DOI] [PubMed] [Google Scholar]
- Max JE, Schachar RJ, Levin HS, Ewing-Cobbs L, Chapman SB, Dennis M, Saunders A, Landis J. Predictors of attention-deficit/hyperactivity disorder within 6 months after pediatric traumatic brain injury. J Am Acad Child Adolesc Psychiatry. 2005b;44:1032–1040. doi: 10.1097/01.chi.0000173293.05817.b1. [DOI] [PubMed] [Google Scholar]
- Mesulam MM. From sensation to cognition. Brain. 1998;121 (Pt 6):1013–1052. doi: 10.1093/brain/121.6.1013. [DOI] [PubMed] [Google Scholar]
- Neuman RJ, Todd RD, Heath AC, Reich W, Hudziak JJ, Bucholz KK, Madden PA, Begleiter H, Porjesz B, Kuperman S, Hesselbrock V, Reich T. Evaluation of ADHD typology in three contrasting samples: a latent class approach. J Am Acad Child Adolesc Psychiatry. 1999;38:25–33. doi: 10.1097/00004583-199901000-00016. [DOI] [PubMed] [Google Scholar]
- Overmeyer S, Bullmore ET, Suckling J, Simmons A, Williams SC, Santosh PJ, Taylor E. Distributed grey and white matter deficits in hyperkinetic disorder: MRI evidence for anatomical abnormality in an attentional network. Psychol Med. 2001;31:1425–1435. doi: 10.1017/s0033291701004706. [DOI] [PubMed] [Google Scholar]
- Pennington BF, Ozonoff S. Executive functions and developmental psychopathology. J Child Psychol Psychiatry. 1996;37:51–87. doi: 10.1111/j.1469-7610.1996.tb01380.x. [DOI] [PubMed] [Google Scholar]
- Peterson BS, Leckman JF, Tucker D, Scahill L, Staib L, Zhang H, King R, Cohen DJ, Gore JC, Lombroso P. Preliminary findings of antistreptococcal antibody titers and basal ganglia volumes in tic, obsessive-compulsive, and attention deficit/hyperactivity disorders. Arch Gen Psychiatry. 2000;57:364–372. doi: 10.1001/archpsyc.57.4.364. [DOI] [PubMed] [Google Scholar]
- Posner MI, Petersen SE. The attention system of the human brain. Annu Rev Neurosci. 1990;13:25–42. doi: 10.1146/annurev.ne.13.030190.000325. [DOI] [PubMed] [Google Scholar]
- Powell AL, Yudd A, Zee P, Mandelbaum DE. Attention deficit hyperactivity disorder associated with orbitofrontal epilepsy in a father and a son. Neuropsychiatry Neuropsychol Behav Neurol. 1997;10:151–154. [PubMed] [Google Scholar]
- Rietveld MJ, Hudziak JJ, Bartels M, van Beijsterveldt CE, Boomsma DI. Heritability of attention problems in children: I. cross-sectional results from a study of twins, age 3–12 years. Am J Med Genet B Neuropsychiatr Genet. 2003;117:102–113. doi: 10.1002/ajmg.b.10024. [DOI] [PubMed] [Google Scholar]
- Rietveld MJ, Hudziak JJ, Bartels M, van Beijsterveldt CE, Boomsma DI. Heritability of attention problems in children: longitudinal results from a study of twins, age 3 to 12. J Child Psychol Psychiatry. 2004;45:577–588. doi: 10.1111/j.1469-7610.2004.00247.x. [DOI] [PubMed] [Google Scholar]
- Schubert R. Attention deficit disorder and epilepsy. Pediatr Neurol. 2005;32:1–10. doi: 10.1016/j.pediatrneurol.2004.06.007. [DOI] [PubMed] [Google Scholar]
- Seidman LJ, Valera EM, Makris N. Structural brain imaging of attention-deficit/hyperactivity disorder. Biol Psychiatry. 2005;57:1263–1272. doi: 10.1016/j.biopsych.2004.11.019. [DOI] [PubMed] [Google Scholar]
- Semrud-Clikeman M, Filipek PA, Biederman J, Steingard R, Kennedy D, Renshaw P, Bekken K. Attention-deficit hyperactivity disorder: magnetic resonance imaging morphometric analysis of the corpus callosum. J Am Acad Child Adolesc Psychiatry. 1994;33:875–881. doi: 10.1097/00004583-199407000-00014. [DOI] [PubMed] [Google Scholar]
- Semrud-Clikeman M, Steingard RJ, Filipek P, Biederman J, Bekken K, Renshaw PF. Using MRI to examine brain-behavior relationships in males with attention deficit disorder with hyperactivity. J Am Acad Child Adolesc Psychiatry. 2000;39:477–484. doi: 10.1097/00004583-200004000-00017. [DOI] [PubMed] [Google Scholar]
- Sergeant JA, Geurts H, Oosterlaan J. How specific is a deficit of executive functioning for attention-deficit/hyperactivity disorder? Behav Brain Res. 2002;130:3–28. doi: 10.1016/s0166-4328(01)00430-2. [DOI] [PubMed] [Google Scholar]
- Sowell ER, Thompson PM, Welcome SE, Henkenius AL, Toga AW, Peterson BS. Cortical abnormalities in children and adolescents with attention-deficit hyperactivity disorder. Lancet. 2003;362:1699–1707. doi: 10.1016/S0140-6736(03)14842-8. [DOI] [PubMed] [Google Scholar]
- Thapar A, Holmes J, Poulton K, Harrington R. Genetic basis of attention deficit and hyperactivity. Br J Psychiatry. 1999;174:105–111. doi: 10.1192/bjp.174.2.105. [DOI] [PubMed] [Google Scholar]
- Ungerleider LG, Haxby JV. ‘What’ and ‘where’ in the human brain. Curr Opin Neurobiol. 1994;4:157–165. doi: 10.1016/0959-4388(94)90066-3. [DOI] [PubMed] [Google Scholar]
- Vaidya CJ, Gabrieli JD. Searching for a neurobiological signature of attention deficit hyperactivity disorder. Mol Psychiatry. 1999;4:206–208. doi: 10.1038/sj.mp.4000533. [DOI] [PubMed] [Google Scholar]
- Verhulst FC, van der Ende J, Koot HM. Handleiding Voor de CBCL/4–18. Rotterdam: Sophia Children’s Hospital/Erasmus University, Department of Child Psychiatry; 1996. [Google Scholar]
- Voeller KK. Attention-deficit hyperactivity disorder (ADHD) J Child Neurol. 2004;19:798–814. doi: 10.1177/08830738040190100901. [DOI] [PubMed] [Google Scholar]
- Wait JW, Stanton L, Schoeman JF. Tuberculosis meningitis and attention deficit hyperactivity disorder in children. J Trop Pediatr. 2002;48:294–299. doi: 10.1093/tropej/48.5.294. [DOI] [PubMed] [Google Scholar]
- Worsley KJ, Andermann M, Koulis T, MacDonald D, Evans AC. Detecting changes in nonisotropic images. Human Brain Mapping. 1999;8:98–101. doi: 10.1002/(SICI)1097-0193(1999)8:2/3<98::AID-HBM5>3.0.CO;2-F. [DOI] [PMC free article] [PubMed] [Google Scholar]
- Worsley KJ, Marrett S, Neelin P, Vandal AC, Friston KJ, Evans AC. A unified statistical approach for determining significant signals in images of cerebral activation. Human Brain Mapping. 1996;4:58–73. doi: 10.1002/(SICI)1097-0193(1996)4:1<58::AID-HBM4>3.0.CO;2-O. [DOI] [PubMed] [Google Scholar]
- Zametkin AJ, Nordahl TE, Gross M, King AC, Semple WE, Rumsey J, Hamburger S, Cohen RM. Cerebral glucose metabolism in adults with hyperactivity of childhood onset. N Engl J Med. 1990;323:1361–1366. doi: 10.1056/NEJM199011153232001. [DOI] [PubMed] [Google Scholar]