

Abstract
Purpose
Increased levels of cyclooxygenase-2 and prostaglandin E2 (PGE2) have been observed in tobacco-related malignancies of the upper aerodigestive tract. Moreover, exposure to tobacco smoke can stimulate the synthesis of PGE2. Recent evidence suggests that urinary PGE metabolite (PGE-M) can be used as an index of systemic PGE2 production. In this study, we investigated whether levels of urinary PGE-M were increased in smokers and in patients with head and neck squamous cell carcinoma (HNSCC).
Experimental Design
Fifty-eight HNSCC cases and 29 age- and gender-matched healthy controls were prospectively enrolled in the study. A detailed smoking history and single void urine specimen were obtained from each participant. Levels of urinary PGE-M were quantified in a blinded fashion using mass spectrometry and compared with smoking history and tumor status.
Results
Adjusted for case-control matching, median urinary PGE-M levels were significantly higher in ever smokers (15.7 ng/mg creatinine) compared with never smokers (9.9 ng/mg creatinine) for the entire study population (n = 87, P = 0.005). Concentrations of urinary PGE-M were nearly doubled in ever smokers (15.2 ng/mg creatinine) versus never smokers (7.8 ng/mg creatinine) among healthy controls (P = 0.001). Higher PGE-M levels were observed in current versus former smokers and in those with greater pack-year exposure. A significant difference in amounts of PGE-M was not observed in patients with HNSCC versus healthy controls.
Conclusions
Increased levels of urinary PGE-M were observed in smokers. Urinary PGE-M may have use as a noninvasive biomarker of the effects of tobacco smoke exposure.
Tobacco smoke contains potent carcinogens that have been causally linked to the development of numerous malignancies including those of the upper aerodigestive tract (UADT; refs. 1–3). A variety of mechanisms have been identified by which tobacco smoke contributes to carcinogenesis. Tobacco carcinogens cause mutations and epigenetic phenomena that can activate proto-oncogenes or inactivate tumor suppressor genes (4, 5). Differences in the capacity to detoxify tobacco carcinogens or repair DNA contribute to interindividual differences in host susceptibility to the procarcinogenic effects of tobacco smoke (6 – 8). Cyclooxygenase (COX) – derived prostaglandin E2 (PGE2) may also play a role in tobacco-induced carcinogenesis of the UADT. Elevated levels of PGE2, detected in cancers of the UADT including non–small cell lung cancer (NSCLC) and head and neck squamous cell carcinoma (HNSCC), correlate with increased tumor vascularization, the development of metastasis, and reduced survival (9–14). Several observations further suggest that PGE2 contributes to the development and progression of cancer. For example, PGE2 can stimulate cell proliferation, induce angiogenesis, inhibit apoptosis, and suppress immune surveillance (15–20). Treatment with selective inhibitors of COX-2, prototypic inhibitors of PGE2 synthesis, or an anti-PGE2 monoclonal antibody inhibited the growth of transplantable tumors of the UADT including HNSCC (20, 21). Recently, exposure to tobacco smoke was found to stimulate COX-2 transcription resulting in enhanced PGE2 synthesis in cells derived from the UADT (22, 23).
Despite an increased understanding of the link between tobacco smoke and malignancy, biomarkers that reflect the cumulative systemic effects of tobacco smoke exposure in a given individual remain elusive. Measurements of tobacco smoke metabolites and DNA adducts can provide useful information, but there is a significant unmet need for additional markers that incorporate the host response to tobacco smoke exposure (24–26). PGE2 is a reasonable candidate for use as a biomarker of the carcinogenic effects of tobacco smoke. However, tissue measurements of PGE2 are invasive and impractical for routine clinical use. Moreover, PGE2 in plasma is rapidly metabolized in the lungs and consequently does not accurately reflect endogenous PG production (27). Catabolism of PGE2 is initiated by 15-prostaglandin dehydrogenase (15-PGDH) and results in a stable end metabolite, 11-α -hydroxy-9,15-dioxo-2,3,4,5-tetranor-prostane-1,20-dioic acid (PGE-M) that is excreted in the urine (Fig. 1; refs. 28–31). Previous studies have shown that urinary PGE-M can be used as an index of systemic PGE2 production (32, 33).
Fig. 1.
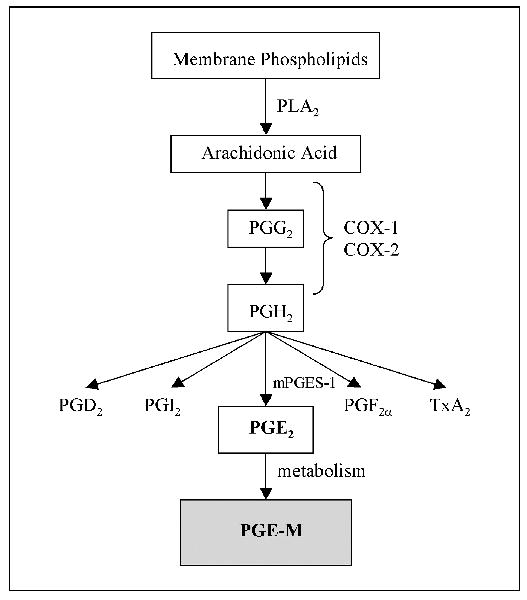
Biosynthesis of PGE-M. Arachidonic acid, released from membrane phospholipids by phospholipase A2 (PLA2) is metabolized by COX-1and COX-2 to PGH2. PGH2 is converted to PGE2 by microsomal PGE synthase-1 (mPGES-1). PGE2 is metabolized to PGE-M in a series of steps including a reaction catalyzed by 15-PGDH.
Levels of urinary PGE-M have been reported to be elevated in NSCLC patients compared with healthy controls (34). In the current study, we investigated whether levels of urinary PGE-M were increased in HNSCC patients. Because of preclinical evidence that tobacco smoke can induce PGE2 synthesis, we also aimed to determine whether levels of urinary PGE-M were increased in smokers. In contrast to the previous findings for NSCLC, we did not find increased levels of urinary PGE-M in HNSCC patients compared with healthy controls. However, levels of urinary PGE-M were elevated in ever smokers compared with never smokers. This finding indicates that the inductive effect of tobacco smoke on PGE2 synthesis observed in vitro translates to humans in vivo. Moreover, these results suggest that urinary PGE-M represents a noninvasive biomarker of host response to cumulative tobacco smoke exposure.
Materials and Methods
Study design
The study was designed as a phase II biomarker study according to the criteria described by Pepe et al. (35). This observational, hospital-based, case-control study was structured to assess the ability of urinary PGE-M to discriminate between healthy controls and HNSCC cases. Cases were age and gender matched to controls at a 2:1 ratio. The sample size calculation was determined using receiver operating characteristic (ROC) curve analysis as the primary tool for evaluating the discriminatory ability of urinary PGE-M. The study was designed to have 80% power using a one-sided 0.05 level significance test to ascertain if the sensitivity of PGE-M was at least 0.65 at a fixed false positive rate of 0.30 (36). All cases were recruited from the Head and Neck Cancer Multidisciplinary Clinic at Memorial Sloan-Kettering Cancer Center without consideration of race or socioeconomic status. Controls were recruited from the population of relatives accompanying patients to the clinic.
Cases were eligible for participation if they had histologically confirmed HNSCC (newly diagnosed or recurrent) and were older than 18 years of age. Exclusion criteria for cases and controls included any surgery, chemotherapy (including corticosteroids), hormonal therapy (other than hormone replacement therapy for menopause), and/or radiation therapy within 6 weeks of enrollment, known unrelated malignancy, or chronic inflammatory disease, renal disease (serum creatinine, >1.5 mg/d), or active infectious process. Individuals taking nonsteroidal anti-inflammatory drugs, excluding a daily cardi-oprotective dose (81 mg) of aspirin, within 1 week of enrollment were also excluded. Informed consent was obtained from each participant. The Institutional Review Board of the Memorial Sloan-Kettering Cancer Center approved this study.
Specimen and data collection
Participant exposure to known HNSCC risk factors, including tobacco and alcohol, was documented. Former smokers were defined as those who quit at least 12 months before presentation. Never smokers were defined as those who smoked fewer than 100 cigarettes in their lifetime. Drinking status was self-reported as never, former, or current. Former drinkers included those who quit anytime before presentation. Never drinkers were defined as those who denied any pattern of alcohol use and excluded ‘‘social’’ drinkers. Daily 81 mg aspirin use, defined as routine intake including within 48 hours of urine collection, was similarly documented. Information regarding site and stage of disease was then extracted from the medical record. All tumors were staged according to the American Joint Committee on Cancer staging system (37). When available, pathologic staging was preferred over clinical staging. Prior cancer history and any applied therapeutic interventions were identified and recorded as applicable. All data was maintained within a secure, password-protected clinical research database at the Memorial Sloan-Kettering Cancer Center.
Single void urine specimens were then collected from each participant and promptly transported to the laboratory after collection. Each specimen was aliquoted into 2-mL cryovials and stored at −80° C. A second ‘‘follow-up’’ urine specimen was collected from those HNSCC cases undergoing surgical resection (≥ 21 days postsurgery).
Urinary prostaglandin E metabolite analysis
Urine specimens were analyzed contemporaneously in a blinded fashion. PGE2 production was quantified by measuring urinary PGE-M via mass spectrometry using stable isotope dilution methodology with chemically synthesized (2H6)PGE-M as an internal standard (38). First, endogenous urinary PGE-M was converted to an unlabeled O-methyloxime derivative and extracted (39). During mass spectrometry, the precursor ions of the unlabeled (2H6) (m/z 385) and (2H6)-labeled (m/z 391) O -methyloxime PGE-M were subjected to collision-induced dissociation. The resultant products included ion m/z 336 representing endogenous PGE-M and ion m/z 339 representing the deuterated internal standard. Levels of endogenous PGE-M in samples were then calculated from the ratio of the mass chromatogram peak areas of the m/z 336 and m/z 339 ions. Results were normalized according to urinary creatinine concentration.
Statistical analysis
ROC curve analysis was used to assess the ability of PGE-M to discriminate between HNSCC patients and matched controls. The primary analysis used for this purpose was the sensitivity at a fixed false positive rate (36, 40). During the design of the study, it was determined that the maximum acceptable false positive rate for a test based on urinary PGE-M should be 0.30, and that to consider the marker clinically useful for the detection of HNSCC the sensitivity at this false positive rate must be shown to be at least 0.65. The ROC curve was estimated using the nonparametric empirical estimate. The area under the ROC curve (AUC) was estimated as a secondary analysis using the empirical estimate of the AUC.
Conditional logistic regression was used to explore associations among PGE-M, tobacco smoke exposure, or other potential prognostic factors while adjusting for the age- and gender-matched data. Van Elteren’s nonparametric test was used to evaluate differences in patient characteristics between HNSCC cases and healthy controls as well as differences in urinary PGE-M levels between groups while stratifying on the matching factors (41, 42). The Wilcoxon signed-rank test was used to compare matched preoperative and postoperative urinary PGE-M values and the Mann-Whitney test was used to compare urinary PGE-M levels from ever and never smokers within case and control groups.
Van Elteren’s test was implemented using SAS version 9 (2002, SAS Institute, Inc., Cary, NC). All other analyses were conducted in STATA 8.0 for Windows 2003 (STATA Corp., College Station, TX) or Microsoft Excel 2000 (Microsoft Corp., Redmond, WA).
Results
Participant characteristics
Participant characteristics of the two groups are listed in Table 1. Cases were age and gender matched to controls at a 2:1 ratio. The median age was 63.0 years (range, 30–86) for HNSCC cases and 69.0 years (range, 25–82) for controls (P = 0.20). The majority of study participants in both groups were male. There were some notable differences between the 58 HNSCC cases and the 29 healthy controls. There was a significant difference in the distribution of smokers between HNSCC cases and healthy controls (P = 0.03) with a greater percentage of current (22.4% versus 6.9%) and former (46.6% versus 37.9%) smokers among the HNSCC cases. For ever (current and former) cigarette smokers, pack-year exposure was equivalent between cases and controls. The median pack-year exposure was 28.5 pack-years (range, 0.2–97.5) for HNSCC cases and 20.0 (range, 8.0–144.0) for healthy controls (P = 0.96). Compared with controls, there was a smaller percentage of daily 81 mg aspirin users (17.2% versus 34.5%) among the HNSCC cases (P = 0.07).
Table 1.
Participant characteristics
| Variable | HNSCC cases (n= 58) | Healthy controls (n= 29) | P |
|---|---|---|---|
| Age, y | |||
| Median (range) | 63.0 (30–86) | 69.0 (25–82) | 0.20 |
| Mean ± SD | 64.4 ± 11.1 | 65.7 ± 14.4 | |
| Gender (%) | |||
| Male | 41 (70.7) | 21 (72.4) | 0.87 |
| Female | 17 (29.3) | 8 (27.6) | |
| Alcohol use (%) | |||
| Never | 9 (15.5) | 7 (24.1) | 0.45 |
| Former | 18 (31.0) | 2 (6.9) | |
| Current | 31 (53.5) | 20 (69.0) | |
| Tobacco use (%) | |||
| Never | 18 (31.0) | 16 (55.2) | 0.03 |
| Former | 27 (46.6) | 11 (37.9) | |
| Current | 13 (22.4) | 2 (6.9) | |
| Pack-year exposure* | |||
| Median (range) | 28.5 (0.2–97.5) | 20.0 (8.0–144.0) | 0.96 |
| Mean ± SD | 32.4 ± 24.8 | 39.9 ± 40.5 | |
| Daily aspirin use | |||
| 81mg (%) | 10 (17.2) | 10 (34.5) | 0.07 |
Pack-year exposure refers to 49 ever smokers (36 HNSCC cases and 13 healthy controls) and excludes four exclusive pipe smokers.
Tumor characteristics for the 58 HNSCC cases are listed in Table 2. The majority of tumors were primary (70.7% versus 29.3% recurrent). Most tumors originated in the oropharynx (n = 24), oral cavity (n = 16), or larynx (n = 13). The median primary tumor size measured 2.7 cm (range, 0.4–6.0 cm) in greatest diameter. The majority of HNSCC cases presented with advanced-stage disease. Tumors were staged as follows: 11 (19.0%) stage I, 5 (8.6%) stage II, 11(19.0%) stage III, and 31 (53.4%) stage IV.
Table 2.
Tumor characteristics
| Variable | HNSCC cases (n= 58) |
|---|---|
| Tumor status (%) | |
| Primary | 46 (70.7) |
| Recurrent | 12 (29.3) |
| Tumor site (%) | |
| Oropharynx | 24 (41.4) |
| Oral Cavity | 16 (27.6) |
| Larynx | 13 (22.4) |
| Paranasal sinuses | 1 (1.7) |
| Parotid | 1 (1.7) |
| Unknown | 3 (5.2) |
| Tumor size, cm | |
| Median (range) | 2.7 (0.4–6.0) |
| Mean ± SD | 2.7 ± 1.4 |
| Tumor stage (%) | |
| I | 11 (19.0) |
| II | 5 (8.6) |
| III | 11 (19.0) |
| IV | 31 (53.4) |
Urinary prostaglandin E metabolite is not a clinically useful biomarker for head and neck squamous cell carcinoma
Although there was a trend toward higher urinary PGE-M levels in the HNSCC cases relative to controls, this difference was not significant. The median concentration of urinary PGE-M was 15.4 ng/mg creatinine (range, 2.4–69.7) for HNSCC cases compared with 12.6 ng/mg creatinine (range, 1.5–68.5) for healthy controls (P = 0.07; Fig. 2A). The mean concentration of urinary PGE-M was 17.9 ± 12.9 ng/mg creatinine for HNSCC cases and 14.0 ± 12.2 ng/mg creatinine for healthy controls. Before initiation of the study, it was determined that the sensitivity of PGE-M should exceed 0.65 at the fixed false positive rate (1–specificity) of 0.30 to be considered clinically useful as a biomarker for HNSCC. From the ROC curve evaluating the ability of urinary PGE-M to discriminate between HNSCC cases and healthy controls, it is evident that the sensitivity corresponding to a false-positive rate of 0.30 is 0.50, well below our criteria for a test that would be useful for discriminating between HNSCC patients and healthy controls (Fig. 2B). The AUC for this ROC curve is 0.61.
Fig. 2.
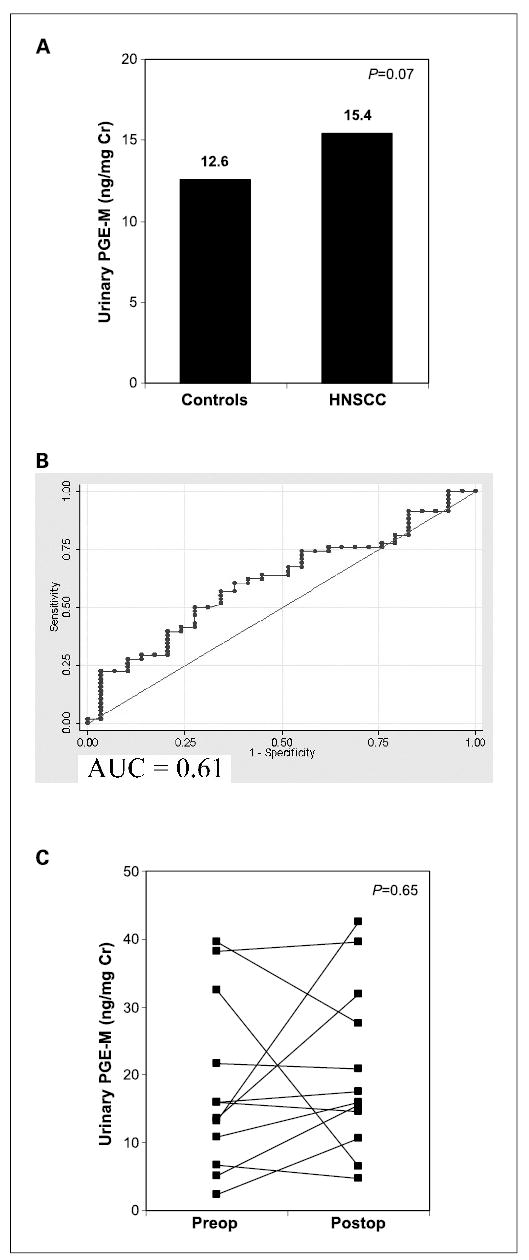
Levels of urinary PGE-Min HNSCC cases versus healthy controls. A, urinary PGE-M levels [median (range)] are not significantly elevated in 58 HNSCC cases [15.4 (2.4–69.7) ng/mg creatinine] compared with 29 healthy controls [12.6 (1.5–68.5) ng/mg creatinine, P = 0.07]. B, ROC curve was estimated by the nonparametric empirical estimate. Urinary PGE-M was unable to discriminate between HNSCC patients and controls. C, urinary PGE-M levels are not altered by surgical resection of HNSCC in 13 patients.
A subset of HNSCC cases (n = 13) treated surgically with curative intent was available a minimum of 3 weeks postoperatively for repeat urine collection. Preoperative urinary PGE-M values were compared with postoperative values in these 13 HNSCC cases to further evaluate whether tumor status was a determinant of PGE-M levels. No consistent trend was observed between preoperative and postoperative urinary PGE-M values (six decreased, seven increased) and there was no significant difference in urinary PGE-M levels between groups (Fig. 2C). The median concentration of urinary PGE-M was 15.9 ng/mg creatinine preoperatively and 17.5 ng/mg creatinine postoperatively (P = 0.65). Thus, surgical removal of HNSCC did not result in a decrease in levels of urinary PGE-M. This finding represents additional evidence that urinary PGE-M is not a clinically useful biomarker for HNSCC.
Urinary prostaglandin E metabolite levels are elevated in smokers
Adjusted for case-control matching, urinary PGE-M levels were significantly higher in smokers compared with nonsmokers for the entire study population (n = 87). The median concentration of urinary PGE-M was 15.7 ng/mg creatinine (range, 2.4–69.7) for 53 ever smokers compared with 9.9 ng/mg creatinine (range, 1.5–27.5) for 34 never smokers (P = 0.005; Fig. 3A). The mean urinary PGE-M concentration of ever smokers (19.9 ± 14.4 ng/mg creatinine) was nearly double that of never smokers (11.5 ± 7.1 ng/mg creatinine). Ever smoking was associated with increased levels of urinary PGE-M even when aspirin users (n = 20) and pipe smokers (n = 4) were excluded (P = 0.02). To further evaluate the relationship between smoking status and urinary PGE-M, a separate analysis of healthy controls was done. Importantly, urinary PGE-M levels were nearly double in ever (n = 13) versus never (n = 16) smokers among healthy tumor-free controls (15.2 versus 7.8 ng/mg creatinine, P=0.001; Fig. 3B).
Fig. 3.
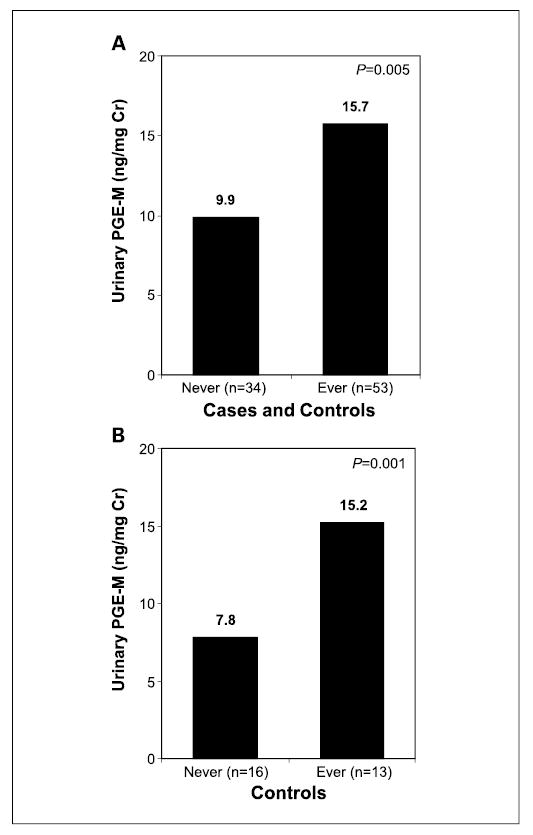
Levels of urinary PGE-M are increased in ever smokers. A, urinary PGE-M levels [median (range)] are elevated in 53 ever smokers [15.7 (2.4–69.7) ng/mg creatinine] compared with 34 never smokers [9.9 (1.5–27.5) ng/mg creatinine] among HNSCC cases and controls combined (P = 0.005). B, levels of urinary PGE-M were increased in ever (n = 13) versus never (n = 16) smokers among healthy tumor-free controls (15.2 versus 7.8 ng/mg creatinine, P = 0.001).
Adjusted for case-control matching, urinary PGE-M levels were compared among never, former, and current smokers for the entire study population. A statistically significant increase in median urinary PGE-M concentration was observed from never (9.9 ng/mg creatinine) to former (14.7 ng/mg creatinine) to current (22.6 ng/mg creatinine) smokers (P = 0.004; Fig. 4). Urinary PGE-M levels were also analyzed for the 49 cigarette smokers (four pipe smokers were excluded) according to cumulative tobacco smoke exposure in pack-years. Higher urinary PGE-M levels were observed in participants with greater tobacco exposure: median urinary PGE-M concentrations were higher among smokers reporting >40 pack-year exposure (20.3 ng/mg creatinine) versus 21 to 40 pack-year exposure (15.4 ng/mg creatinine) and <20 pack-year exposure (14.2 ng/mg creatinine) versus the urinary PGE-M concentration of never smokers (9.9 ng/mg creatinine; Table 3).
Fig. 4.
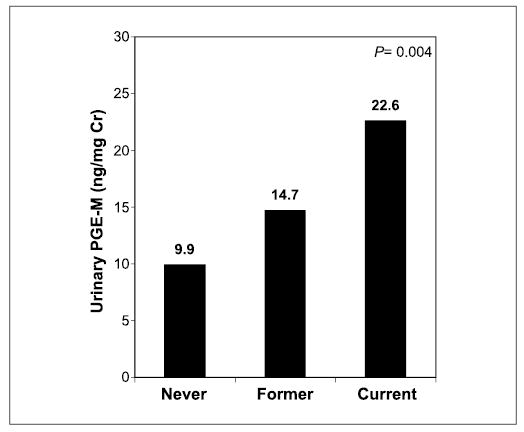
Urinary PGE-M levels as a function of smoking history. A statistically significant increase in urinary PGE-M levels [median (range)] was observed from never [9.9 (1.5–27.5) ng/mg creatinine] to former [14.7 (2.4–68.5) ng/mg creatinine] to current [22.6 (6.8–69.7) ng/mg creatinine] smoking status among HNSCC cases and controls combined (P = 0.004).
Table 3.
Urinary PGE-M levels by tobacco smoke exposure (pack-years) among cases and controls combined
| Pack-year exposure | Participants (N= 83) | Urinary PGE-M (ng/mg creatinine), median (range) |
|---|---|---|
| Never | 34 | 9.9 (1.5–27.5) |
| <20 | 20 | 14.2 (2.4–28.3) |
| 21–40 | 13 | 15.4 (4.9–52.6) |
| >40 | 16 | 20.3 (5.9–69.7) |
Discussion
PGE2 levels are markedly elevated in a variety of tobacco-related malignancies including NSCLC and HNSCC (11–14). Increased levels of urinary PGE-M, as an index of systemic PGE2, were recently found in a cohort of patients with unresectable NSCLC (34). In the current study, urinary PGE-M levels were unable to discriminate between HNSCC cases and controls. Although urinary PGE-M levels were slightly higher in HNSCC patients than in healthy volunteers, this difference was not statistically significant. Moreover, cancer resection failed to reduce levels of urinary PGE-M. Differences in tumor location, bulk, or molecular properties (e.g., magnitude of PGE2 elevation) may explain why urinary PGE-M levels were relatively elevated in patients with unresectable NSCLC but not in HNSCC patients versus healthy controls. Our findings show that tobacco smoke exposure is a determinant of PGE-M levels. Hence, the slight increase in levels of urinary PGE-M in HNSCC patients can be explained by the greater percentage of smokers in this group versus healthy controls.
In this study, we showed for the first time that levels of urinary PGE-M are increased in smokers. Adjusted for case-control matching, current and former smokers from the total study population showed elevated urinary PGE-M levels compared with never smokers (Fig. 3A). The importance of smoking status as a determinant of urinary PGE-M levels was underscored by the finding of a nearly 100% increase in PGE-M levels in healthy ever versus never smokers (Fig. 3B). Urinary PGE-M levels increased among smokers according to dose of tobacco exposure (Table 3). Furthermore, urinary PGE-M levels were highest among current smokers (Fig. 4). Taken together, these data suggest that urinary PGE-M may have utility as a noninvasive biomarker of the cumulative systemic effects of tobacco smoke exposure.
The finding of elevated levels of urinary PGE-M in smokers raises a number of fundamental questions. The molecular mechanism underlying the increased levels of PGE-M in smokers needs to be elucidated. COX-2, the inducible form of COX, can be rate limiting for PGE2 production (43). Notably, increased amounts of COX-2 have been found in the UADT mucosa of active smokers compared with never smokers (23). Moreover, tobacco smoke and its constituents [e.g., benzo(a)-pyrene] can stimulate COX-2 transcription and PGE2 biosynthesis in vitro (44). It is likely, then, that increased levels of urinary PGE-M in smokers reflects enhanced expression of COX-2 in smoke-exposed epithelium. Future pharmacologic studies using a selective COX-2 inhibitor can be employed to further evaluate the link between COX-2 and enhanced PGE-M production. In addition to aberrant COX-2 expression, increased levels or activities of phospholipase A2, COX-1, or mPGES-1 (Fig. 1) might also contribute to enhanced production of urinary PGE-M in smokers (19). It is also interesting to consider which tissue compartment might be responsible for the increased PGE2 production observed in smokers. The lung is the most likely source for elevated PGE2 synthesis because of its immense surface area and the known link between tobacco smoke and pulmonary inflammation. Inflammation is associated with increased production of PGE2 (45, 46) and various cell types within the lung have the capacity to produce large amounts of PGE2 in response to proinflammatory stimuli (47, 48). In support of this idea, increased levels of exhaled PGE2 have been detected in patients with chronic obstructive pulmonary disease versus healthy controls (49). Future studies will be needed to evaluate levels of urinary PGE-M in patients with bronchitis or emphysema.
A statistically significant increase in urinary PGE-M concentration was observed in the comparison of never versus former versus current smokers. Several mechanisms can explain this finding. For example, former smokers are predicted to have less pulmonary inflammation and bronchial metaplasia than current smokers (50). As mentioned previously, the chemical constituents of tobacco smoke induce COX-2 and PGE2 synthesis in vitro (44, 51). If this mechanism is operative in vivo, then levels of PGE-M should be higher in current than in former smokers and decrease rapidly with tobacco cessation. Future studies are needed to determine the significance of increased levels of PGE-M in former smokers, which could be a consequence of multiple mechanisms such as persistent inflammation or fixed genetic changes (e.g., mutation of TP53 with increased COX-2 expression; refs. 52–54). Given the link between inflammation and carcinogenesis (55), it is intriguing to postulate that measurements of urinary PGE-M might prove useful in evaluating cancer risk among active and former smokers.
The discovery of elevated levels of urinary PGE-M in smokers has potentially important clinical applications. If increased COX-2 activity is responsible for elevated urinary PGE-M levels, then PGE-M should be useful as a biomarker to determine the minimum dose of a selective COX-2 inhibitor, such as celecoxib, which is required to abrogate COX-2 activity in smokers. PGE-M measurements could also prove useful in a tobacco cessation program. If levels of urinary PGE-M decrease in conjunction with tobacco cessation, then this information could provide immediate feedback and help reinforce the cessation behavior for smokers who want to quit.
In summary, smokers were identified as having elevated urinary PGE-M levels. Therefore, urinary PGE-M may have utility as a noninvasive biomarker of host response to tobacco smoke exposure. In contrast to previous reports for NSCLC, urinary PGE-M levels were unable to discriminate between HNSCC patients and healthy controls.
Footnotes
Grant support: American Society of Clinical Oncology Young Investigator Award; Memorial Sloan-Kettering Cancer Center Prevention Control and Population Research Program Pilot Project Award; NIH grants T32 CA09685, R01CA82578, P01CA106451, P01CA77839, R01DK48831, P50GM15431, and RR00095; and Center for Cancer Prevention Research.
References
- 1.Lewin F, Norell SE, Johansson H, et al. Smoking tobacco, oral snuff, and alcoholin the etiology of squamous cell carcinoma of the head and neck: a population-based case-referent study in Sweden. Cancer. 1998;82:1367–75. doi: 10.1002/(sici)1097-0142(19980401)82:7<1367::aid-cncr21>3.0.co;2-3. [DOI] [PubMed] [Google Scholar]
- 2.Mashberg A, Boffetta P, Winkelman R, Garfinkel L. Tobacco smoking, alcohol drinking, and cancer of the oral cavity and oropharynx among U.S. veterans. Cancer. 1993;72:1369–75. doi: 10.1002/1097-0142(19930815)72:4<1369::aid-cncr2820720436>3.0.co;2-l. [DOI] [PubMed] [Google Scholar]
- 3.Vineis P, Alavanja M, Buffler P, et al. Tobacco and cancer: recent epidemiological evidence. J Natl Cancer Inst. 2004;96:99–106. doi: 10.1093/jnci/djh014. [DOI] [PubMed] [Google Scholar]
- 4.DeMarini DM. Genotoxicity of tobacco smoke and tobacco smoke condensate: a review. Mutat Res. 2004;567:447–74. doi: 10.1016/j.mrrev.2004.02.001. [DOI] [PubMed] [Google Scholar]
- 5.Izzotti A, Cartiglia C, Longobardi M, et al. Gene expression in the lung of p53 mutant mice exposed to cigarette smoke. Cancer Res. 2004;64:8566–72. doi: 10.1158/0008-5472.CAN-04-1420. [DOI] [PubMed] [Google Scholar]
- 6.Miller DP, Liu G, DeVivo I, et al. Combinations of the variant genotypes of GSTP1, GSTM1, and p53 are associated with an increased lung cancer risk. Cancer Res. 2002;62:2819–23. [PubMed] [Google Scholar]
- 7.Shen H, Spitz MR, Qiao Y, et al. Smoking, DNA repair capacity and risk of nonsmall cell lung cancer. Int J Cancer. 2003;107:84–8. doi: 10.1002/ijc.11346. [DOI] [PubMed] [Google Scholar]
- 8.Zheng Z, Park JY, Guillemette C, Schantz SP, Lazarus P. Tobacco carcinogen-detoxifying enzyme UGT1A7 and its association with orolaryngeal cancer risk. J Natl Cancer Inst. 2001;93:1411 –8. doi: 10.1093/jnci/93.18.1411. [DOI] [PubMed] [Google Scholar]
- 9.Gallo O, Franchi A, Magnelli L, et al. Cyclooxygenase-2 pathway correlates with VEGF expression in head and neck cancer. Implications for tumor angiogenesis and metastasis. Neoplasia. 2001;3:53 –61. doi: 10.1038/sj.neo.7900127. [DOI] [PMC free article] [PubMed] [Google Scholar]
- 10.Gallo O, Masini E, Bianchi B, Bruschini L, Paglierani M, Franchi A. Prognostic significance of cyclooxygenase-2 pathway and angiogenesis in head and neck squamous cell carcinoma. Hum Pathol. 2002;33:708–14. doi: 10.1053/hupa.2002.125376. [DOI] [PubMed] [Google Scholar]
- 11.Jung TT, Berlinger NT, Juhn SK. Prostaglandins in squamous cell carcinoma of the head and neck: a preliminary study. Laryngoscope. 1985;95:307–12. doi: 10.1288/00005537-198503000-00014. [DOI] [PubMed] [Google Scholar]
- 12.Karmali RA, Wustrow T, Thaler HT, Strong EW. Prostaglandins in carcinomas of the head and neck. Cancer Lett. 1984;22:333–6. doi: 10.1016/0304-3835(84)90171-x. [DOI] [PubMed] [Google Scholar]
- 13.LeFever A, Funahashi A. Elevated prostaglandin E2 levels in bronchoalveolar lavage fluid of patients with bronchogenic carcinoma. Chest. 1990;98:1397–402. doi: 10.1378/chest.98.6.1397. [DOI] [PubMed] [Google Scholar]
- 14.McLemore TL, Hubbard WC, Litterst CL, et al. Profiles of prostaglandin biosynthesis in normal lung and tumor tissue from lung cancer patients. Cancer Res. 1988;48:3140–7. [PubMed] [Google Scholar]
- 15.Ben-Av P, Crofford LJ, Wilder RL, Hla T. Induction of vascular endothelial growth factor expression in synovial fibroblasts by prostaglandin E and interleukin-1: a potential mechanism for inflammatory angiogenesis. FEBS Lett. 1995;372:83–7. doi: 10.1016/0014-5793(95)00956-a. [DOI] [PubMed] [Google Scholar]
- 16.Dannenberg AJ, Subbaramaiah K. Targeting cyclo-oxygenase-2 in human neoplasia: rationale and promise. Cancer Cell. 2003;4:431–6. doi: 10.1016/s1535-6108(03)00310-6. [DOI] [PubMed] [Google Scholar]
- 17.Masferrer JL, Leahy KM, Koki AT, et al. Antiangiogenic and antitumor activities of cyclooxygenase-2 inhibitors. Cancer Res. 2000;60:1306–11. [PubMed] [Google Scholar]
- 18.Sheng H, Shao J, Morrow JD, Beauchamp RD, DuBois RN. Modulation of apoptosis and Bcl-2 expression by prostaglandin E2 in human colon cancer cells. Cancer Res. 1998;58:362–6. [PubMed] [Google Scholar]
- 19.Sheng H, Shao J, Washington MK, DuBois RN. Prostaglandin E2 increases growth and motility of colorectalcarcinoma cells. J Biol Chem. 2001;276:18075–81. doi: 10.1074/jbc.M009689200. [DOI] [PubMed] [Google Scholar]
- 20.Stolina M, Sharma S, Lin Y, et al. Specific inhibition of cyclooxygenase 2 restores antitumor reactivity by altering the balance of IL-10 and IL-12 synthesis. J Immunol. 2000;164:361–70. doi: 10.4049/jimmunol.164.1.361. [DOI] [PubMed] [Google Scholar]
- 21.Zweifel BS, Davis TW, Ornberg RL, Masferrer JL. Direct evidence for a role of cyclooxygenase 2-derived prostaglandin E2 in human head and neck xenograft tumors. Cancer Res. 2002;62:6706–11. [PubMed] [Google Scholar]
- 22.Martey CA, Pollock SJ, Turner CK, et al. Cigarette smoke induces cyclooxygenase-2 and microsomal prostaglandin E2 synthase in human lung fibroblasts: implications for lung inflammation and cancer. Am J Physiol Lung Cell Mol Physiol. 2004;287:L981 –91. doi: 10.1152/ajplung.00239.2003. [DOI] [PubMed] [Google Scholar]
- 23.Moraitis D, Du B, De Lorenzo MS, et al. Levels of cyclooxygenase-2 are increased in the oral mucosa of smokers: evidence for the role of epidermal growth factor receptor and its ligands. Cancer Res. 2005;65:664 –70. [PubMed] [Google Scholar]
- 24.Harman SM, Liang L, Tsitouras PD, et al. Urinary excretion of three nucleic acid oxidation adducts and isoprostane F(2)α measured by liquid chromatography-mass spectrometry in smokers, ex-smokers, and nonsmokers. Free Radic Biol Med. 2003;35:1301–9. doi: 10.1016/j.freeradbiomed.2003.07.003. [DOI] [PubMed] [Google Scholar]
- 25.Hecht SS. Tobacco carcinogens, their biomarkers and tobacco-induced cancer. Nat Rev Cancer. 2003;3:733–44. doi: 10.1038/nrc1190. [DOI] [PubMed] [Google Scholar]
- 26.Murphy SE, Link CA, Jensen J, et al. A comparison of urinary biomarkers of tobacco and carcinogen exposure in smokers. Cancer Epidemiol Biomarkers Prev. 2004;13:1617–23. [PubMed] [Google Scholar]
- 27.Piper PJ, Vane JR, Wyllie JH. Inactivation of prostaglandins by the lungs. Nature. 1970;225:600–4. doi: 10.1038/225600a0. [DOI] [PubMed] [Google Scholar]
- 28.Hamberg M, Samuelsson B. The structure of the major urinary metabolite of prostaglandin E2 in man. J Am Chem Soc. 1969;91:2177–8. doi: 10.1021/ja01036a092. [DOI] [PubMed] [Google Scholar]
- 29.Hamberg M, Samuelsson B. On the metabolism of prostaglandins E 1and E 2 in man. J Biol Chem. 1971;246:6713–21. [PubMed] [Google Scholar]
- 30.Oates JA, FitzGerald GA, Branch RA, Jackson EK, Knapp HR, Roberts LJ. Clinical implications of prosta-glandin and thromboxane A2 formation (2) N Engl J Med. 1988;319:761 –7. doi: 10.1056/NEJM198809223191206. [DOI] [PubMed] [Google Scholar]
- 31.Schweer H, Meese CO, Seyberth HW. Determination of 11 α -hydroxy-9,15-dioxo-2,3,4,5,20-pentanor-19-carboxyprostanoic acid and 9 α ,11 α -dihydroxy-15-oxo-2,3,4,5,20-pentanor-19-carbox-yprostanoic acid by gas chromatography/negative ion chemical ionization triple-stage quadrupole mass spectrometry. Anal Biochem. 1990;189:54–8. doi: 10.1016/0003-2697(90)90043-9. [DOI] [PubMed] [Google Scholar]
- 32.Ferretti A, Flanagan VP, Roman JM. Quantitative analysis of 11 α -hydroxy-9,15-dioxo-2,3,4,5,20-pentanor-19-carboxyprostanoic acid, the major urinary metabolite of E prostaglandins in man. Anal Biochem. 1983;128:351–8. doi: 10.1016/0003-2697(83)90385-8. [DOI] [PubMed] [Google Scholar]
- 33.Seyberth HW, Sweetman BJ, Frolich JC, Oates JA. Quantifications of the major urinary metabolite of the E prostaglandins by mass spectrometry: evaluation of the method’s application to clinical studies. Prostaglandins. 1976;11:381–97. doi: 10.1016/0090-6980(76)90160-x. [DOI] [PubMed] [Google Scholar]
- 34.Murphey LJ, Williams MK, Sanchez SC, et al. Quantification of the major urinary metabolite of PGE2 by a liquid chromatographic/mass spectrometric assay: determination of cyclooxygenase-specific PGE2 synthesis in healthy humans and those with lung cancer. Anal Biochem. 2004;334:266–75. doi: 10.1016/j.ab.2004.08.019. [DOI] [PubMed] [Google Scholar]
- 35.Pepe MS, Etzioni R, Feng Z, et al. Phases of bio-marker development for early detection of cancer. J Natl Cancer Inst. 2001;93:1054–61. doi: 10.1093/jnci/93.14.1054. [DOI] [PubMed] [Google Scholar]
- 36.Pepe MS. The Statistical evaluation of medical tests for classification and prediction. New York (NY): Oxford University Press; 2003. pp. 218–24. [Google Scholar]
- 37.Greene FL, Page DL, Fleming ID, Fritz A, Balch CM. AJCC cancer staging manual. 6th ed. Philadelphia (PA): Lippincott-Raven; 2003. [Google Scholar]
- 38.Taber DF, Teng D. Total synthesis of the ethyl ester of the major urinary metabolite of prostaglandin E(2) J Org Chem. 2002;67:1607 –12. doi: 10.1021/jo011017i. [DOI] [PubMed] [Google Scholar]
- 39.Morrow JD, Prakash C, Awad JA, et al. Quantification of the major urinary metabolite of prostaglandin D2 by a stable isotope dilution mass spectrometric assay. Anal Biochem. 1991;193:142–8. doi: 10.1016/0003-2697(91)90054-w. [DOI] [PubMed] [Google Scholar]
- 40.Zhou XH, Obuchowski NA, McClish DK. Statistical methods in diagnostic medicine. New York (NY): John Wiley and Sons, Inc.; 2002. pp. 146–50.–201.pp. 4 [Google Scholar]
- 41.Lehmann EL. Nonparametrics: statistical methods based on ranks. San Francisco (CA): Holden-Day; 1975. pp. 132–7. [Google Scholar]
- 42.van Elteren PH. On the combination of independent two-sample tests of Wilcoxon. Bulletin of the International Statistical Institute. 1960;37:351–61. [Google Scholar]
- 43.Altorki NK, Port JL, Zhang F, et al. Chemotherapy induces the expression of COX-2 in non-small cell lung cancer. Clin Cancer Res. 2005;11:4191–7. doi: 10.1158/1078-0432.CCR-05-0108. [DOI] [PubMed] [Google Scholar]
- 44.Kelley DJ, Mestre JR, Subbaramaiah K, et al. Benzo[a]pyrene up-regulates cyclooxygenase-2 gene expression in oral epithelial cells. Carcinogenesis. 1997;18:795–9. doi: 10.1093/carcin/18.4.795. [DOI] [PubMed] [Google Scholar]
- 45.Alba-Loureiro TC, Martins EF, Miyasaka CK, et al. Evidence that arachidonic acid derived from neutrophils and prostaglandin E2 are associated with the induction of acute lung inflammation by lipopolysaccharide of Escherichia coli. Inflamm Res. 2004;53:658–63. doi: 10.1007/s00011-004-1308-7. [DOI] [PubMed] [Google Scholar]
- 46.Carty E, De Brabander M, Feakins RM, Rampton DS. Measurement of in vivo rectal mucosal cytokine and eicosanoid production in ulcerative colitis using filter paper. Gut. 2000;46:487 –92. doi: 10.1136/gut.46.4.487. [DOI] [PMC free article] [PubMed] [Google Scholar]
- 47.Mao JT, Tsu IH, Dubinett SM, et al. Modulation of pulmonary leukotriene B4 production by cyclooxygenase-2 inhibitors and lipopolysaccharide. Clin Cancer Res. 2004;10:6872–8. doi: 10.1158/1078-0432.CCR-04-0945. [DOI] [PubMed] [Google Scholar]
- 48.Mao JT, Roth MD, Serio KJ, et al. Celecoxib modulates the capacity for prostaglandin E2 and interleukin-10 production in alveolar macrophages from active smokers. Clin Cancer Res. 2003;9:5835–41. [PubMed] [Google Scholar]
- 49.Montuschi P, Kharitonov SA, Ciabattoni G, Barnes PJ. Exhaled leukotrienes and prostaglandins in COPD. Thorax. 2003;58:585–8. doi: 10.1136/thorax.58.7.585. [DOI] [PMC free article] [PubMed] [Google Scholar]
- 50.Lee JJ, Liu D, Lee JS, et al. Long-term impact of smoking on lung epithelial proliferation in current and former smokers. J Natl Cancer Inst. 2001;93:1081–8. doi: 10.1093/jnci/93.14.1081. [DOI] [PubMed] [Google Scholar]
- 51.Shin VY, Wu WK, Ye YN, et al. Nicotine promotes gastric tumor growth and neovascularization by activating extracellular signal-regulated kinase and cyclo-oxygenase-2. Carcinogenesis. 2004;25:2487–95. doi: 10.1093/carcin/bgh266. [DOI] [PubMed] [Google Scholar]
- 52.Gallo O, Schiavone N, Papucci L, et al. Down-regulation of nitric oxide synthase-2 and cyclooxygenase-2 pathways by p53 in squamous cell carcinoma. Am J Pathol. 2003;163:723–32. doi: 10.1016/S0002-9440(10)63699-1. [DOI] [PMC free article] [PubMed] [Google Scholar]
- 53.Subbaramaiah K, Altorki N, Chung WJ, Mestre JR, Sampat A, Dannenberg AJ. Inhibition of cyclooxygenase-2 gene expression by p53. J Biol Chem. 1999;274:10911–5. doi: 10.1074/jbc.274.16.10911. [DOI] [PubMed] [Google Scholar]
- 54.Niki T, Kohno T, Iba S, et al. Frequent co-localization of Cox-2 and laminin-5 γ 2 chain at the invasive front of early-stage lung adenocarcinomas. Am J Pathol. 2002;160:1129–41. doi: 10.1016/s0002-9440(10)64933-4. [DOI] [PMC free article] [PubMed] [Google Scholar]
- 55.Philip M, Rowley DA, Schreiber H. Inflammation as a tumor promoter in cancer induction. Semin Cancer Biol. 2004;14:433 –9. doi: 10.1016/j.semcancer.2004.06.006. [DOI] [PubMed] [Google Scholar]