

Abstract
We develop a method, which utilizes a combined atomic force microscope (AFM)/fluorescence microscope and small copy number polymerase chain reaction (PCR), to affinity-select individual aptamer species in a single cycle from a small pool of random-sequence oligonucleotides (oligos). In this method, a library of small beads, each of which is functionalized with fluorescent oligos of different sequences, is created. This library of oligo-functionalized beads is flowed over immobilized target molecules on a glass cover slip. High-affinity target-specific aptamers bind tightly to the target for prolonged periods and resist subsequent washes, resulting in a strong fluorescence signal on the substrate surface. This signal is observed from underneath the sample via fluorescence microscopy. The AFM tip, situated above the sample, is then directed to the coordinates of the fluorescence signal and is used to capture a three-dimensional high-resolution image of the surface-bound bead and to extract the bead (plus attached oligo). The extracted oligo is PCR-amplified, sequenced, and may then be subjected to further biochemical analysis. Here, we describe the underlying principles of this method, the required microscopy instrumentation, and the results of proof-of-principle experiments. In these experiments, we selected aptamers in eight trials from a binary pool containing a 1:1 mixture of thrombin aptamer oligo and a nonsense oligo. In each of the eight trials, the positive control aptamer was successfully detected, imaged, extracted, and characterized by PCR amplification and sequencing. In no case was the nonsense oligo selected, indicating good selectivity at this early stage of technology development.
Keywords: aptamer selection, atomic force microscopy, fluorescence microscopy
INTRODUCTION
Aptamers (from Latin aptus: fitted, fastened) are oligonucleotides (oligos), typically about 10–100 bases in length, that bind targets with high affinity and specificity. Target-specific binding is attributed to the three-dimensional structure of these folded molecules, which, in turn, is dictated by the oligo sequence. Since they were first described in 1990 (Ellington and Szostak, 1990; Tuerk and Gold, 1990), hundreds of aptamers have been identified that bind to a variety of targets such as proteins, peptides, toxins, dyes, coenzymes, vitamins, and other organic and inorganic compounds (Lee et al., 2004). In the last few years, it has become apparent that they may have many useful applications. Aptamers can be conveniently labeled, conjugated, and immobilized through site-directed chemistries because of their relatively small size and defined chemical and sequence composition. As they are well-defined synthetic molecules (as distinct from purified biologicals), aptamers are amenable to reproducible, scalable, and cost-effective production using established solid-phase synthesis techniques. They are good candidates for use as specific binding reagents in proteomic arrays, biosensors, and bioMEMS devices (Kirby et al., 2004), and show promise for a wide variety of applications in drug discovery, diagnostics, medical devices, and biopharmaceuticals (Yan et al., 2005). The first aptamer-based drug, Macugen, was launched in 2005 for the treatment of macular degeneration (Gragoudas et al., 2004), and several others are in various stages of clinical trials (Nimjee et al., 2005).
Aptamers are primarily selected by a technique referred to as systematic evolution of ligands by exponential enrichment (SELEX) (Ellington and Szostak, 1990, 1992; Tuerk and Gold, 1990). In a typical SELEX selection experiment, target molecules are exposed to a large pool of randomized oligos (~1014 molecules). Target-bound oligos are separated from the reaction mixture and polymerase chain reaction (PCR)-amplified, resulting in an enriched pool of oligos. This pool is used for the next cycle of SELEX and through successive rounds of this process (typically 6–12 rounds), a highly enriched pool of candidate oligos is evolved. This enriched pool contains a heterogeneous population of oligos that may vary, for example, in nucleotide sequence, target specificity, binding affinity, and amplification efficiency. These oligos are then cloned and sequenced to allow analytical and functional characterization of defined-sequence oligos. Candidate oligos determined to bind target molecules with measurable affinity and specificity are referred to as aptamers.
Recently, an alternative aptamer selection technique referred to as nonequilibrium capillary electrophoresis of equilibrium mixtures (NECEEM) has been described (Berezovski et al., 2005, 2006). In this technique, unbound oligos are separated from target-bound oligos by running the binding reaction through a capillary electrophoresis instrument. Three rounds of NECEEM can increase the binding constants of the oligos to their targets by over four orders of magnitude without the need for PCR amplification (Berezovski et al., 2006). In some cases, a single cycle of NECEEM provides sufficient enrichment to yield a pool of viable aptamer sequences (Berezovski et al., 2005).
In this article, we introduce an entirely different approach that relies on a combined atomic force microscope (AFM) and fluorescence microscope to select the individual target-binding aptamer species from oligo libraries in a single cycle. Combined AFM and fluorescence microscopy is used to visualize target-bound aptamers on a substrate. Subsequently, target-bound aptamers are individually extracted with the AFM tip, PCR-amplified, and sequenced. We refer to our selection technique as the 1 NanoSelection® method because it relies on nanoscale imaging and isolation of target-bound aptamer molecules.
Our technique is in the development stage and is not yet designed to select aptamers from the large, highly diverse pools used in SELEX or NECEEM. Rather, our technique has unique features that may complement SELEX or NECEEM selection and may make it useful for special selection experiments. One distinguishing feature of our technique is that the selection step capitalizes on physical extraction of a single aptamer species. PCR-amplification of the selected sequence yields a homogenous preparation that is ready for sequencing without the need for subsequent cloning and purification. Another feature of our technique is that the aptamer-binding location is seen via the fluorescence microscope. Thus, aptamers bound to specific sites can be extracted.
An enabling step in our technique is the extraction of nucleic acid molecules from a substrate with an AFM tip followed by PCR amplification. This is a difficult task and, to our knowledge, has been successfully done by only three groups. Thalhammer et al. (1997) used the AFM tip to scrape a piece of DNA from a chromosome and subsequently amplify it by degenerate oligonucleotide-primed PCR. Xu and Ikai (1998b) reported that the AFM tip can be used to pick up plasmid molecules from a mica surface under acidic conditions. The same group also extracted strands of DNA from a methanol/acetic acid-treated mouse chromosome and successfully amplified the extracted DNA by random PCR amplification (Xu and Ikai, 1998a). They also used an AFM tip to extract mRNA from the inside of living cells without killing the cells (Osada et al., 2003; Uehara et al., 2004). Lü et al. used an AFM tip to excise a DNA segment from a single, linearized pBR322 plasmid (Lü et al., 2004), extracted the DNA with the AFM tip and subsequently amplified it by single-molecule PCR.
In our pick-up technique, the nucleic acid material is bound to a small, soft bead. The bead can be imaged in tapping mode AFM. For DNA extraction, the AFM is switched to either contact mode or force spectroscopy mode. The AFM tip can then be used to “spear” the bead and extract the attached DNA.
The technology introduced here provides the ability to detect, extract, amplify, and sequence individual target-binding oligo species. The proof-of-principle of these capabilities was demonstrated by extracting and characterizing the known thrombin-binding aptamer GGTTGGTGTGGTTGG (Bock et al., 1992; Tsiang et al., 1995) from a binary pool eight times without once extracting and amplifying a nonsense oligo. The binary pool comprised a 1:1 mixture of the thrombin aptamer and the arbitrary “nonsense oligo” CATCAT (which has no relationship to the aptamer sequence) each flanked by primer-binding sequences.
Our technique may also find applications in nonaptamer-related experiments such as the detection of target sequences in DNA samples. For example, beads functionalized with oligos of different sequences could be incubated with larger pieces of DNA or chromosomes before or after substrate deposition. Extraction of target-bound beads followed by PCR amplification and sequencing could then be used to detect one or more target sequences.
MATERIALS AND METHODS
NanoSelection Method
This section provides a schematic overview of our NanoSelection method. The numbering in the following paragraphs is in accordance with the steps shown in Figure 1.
Fig. 1.
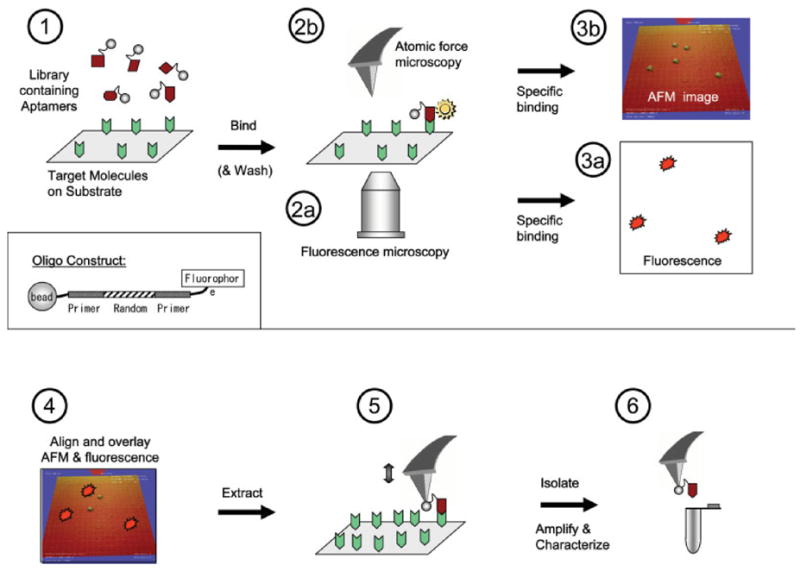
Schematic diagram showing steps (1–6) of the NanoSelection method. (1) A pool of oligonucleotides, each of which is labeled with a fluorophore on one terminus and a small bead on the other terminus (see inset), is reacted with a target-coated substrate. (2a and 3a) Binding events are quickly detected in a large field of view and with low resolution by fluorescence microscopy. The fluorescence signal is used to direct the AFM tip to the binding spot. (2b and 3b) After a high-resolution AFM image is obtained, (4) the fluorescence image and AFM image may be overlaid, and subsequently (5) the AFM tip is used to extract the aptamer (via the attached bead). (6) The extracted aptamer species is then amplified by PCR, sequenced, and subjected to further biochemical analysis. [Color figure can be viewed in the online issue, which is available at www.interscience.wiley.com.]
Step 1: Labeling and Binding Reaction
Target molecules are attached to the substrate. The library consists of fluorescently labeled oligonucleotides (oligos) attached to beads, each bead having a different oligo sequence. The beads are used to aid atomic force microscope (AFM)-based detection and extraction. Each candidate oligo (inset) consists of three regions: a randomized sequence region flanked by two polymerase chain reaction (PCR)-primer regions. When the oligo library is flowed over the target area, high-affinity target-specific aptamers bind tightly to the target for relatively prolonged periods. At the same time, the surface is populated by transiently bound oligos that are not specific for the target. In the current experiments, the nonspecific oligos were washed off. The experiment may also be carried out dynamically in liquid (i.e., without washing). In this case, target-specific aptamers could be distinguished from nonspecifically bound oligos based on the duration, intensity, and mobility of the fluorescent signal produced by the surface-bound oligos (see steps 2a and 3a and Discussion).
Steps 2a and 3a: Fast, Low-Resolution Detection of Binding Events by Fluorescence Microscopy
Fluorescent microscopy is used to detect binding events very quickly at relatively low resolution (0.61λ/N.A. ≈420 nm, for λ = 520 nm, N.A. = 0.75) in a large field of view. The detection protocol described in this article is “static” in that imaging is performed under ambient conditions after the substrate is washed and dried. Epifluorescence can be used in this case, because there is no fluorescence coming from the solution. However, in a dynamic assay protocol, in which real-time detection would be performed in solution without washing, evanescent wave illumination would be used (total internal reflection, TIR) (Axelrod, 2001). Species that are not bound to immobilized target molecules will mostly reside in solution where they are inaccessible to excitation and will thus not emit a fluorescence signal.
Steps 2b and 3b: High-Resolution Detection of Binding Events by AFM
The fluorescence image is used to direct the AFM tip to the coordinates of the target-bound aptamer allowing the position of the aptamer to be determined with nanometer-scale resolution. The small bead attached to the aptamer provides a landmark for the aptamer-target complex.
Step 4: Overlay
The AFM and fluorescence images may be overlaid (typically AFM over fluorescence) to (a) ensure that the bead in the AFM image corresponds to the observed fluorescence signal and (b) confirm the precise location of the bound aptamer.
Step 5: Extraction of Aptamer
The AFM is switched from tapping mode (used for imaging) to contact mode (used for manipulation), and the AFM tip is used to retrieve the bead and attached aptamer.
Step 6: Low Copy Number PCR and Aptamer Analysis
After extraction, the single aptamer species is eluted from the AFM tip, amplified by PCR, sequenced, and further characterized by traditional biochemical methods.
In the following section, all chemicals and supplies were from Fisher Scientific (Atlanta, GA), unless otherwise noted.
Preparation of Substrates
A 6-μL drop of thrombin solution (4.45 mg/mL; Sigma, Saint Louis, MI) was deposited on the substrate (Fig. 4: glass cover slips; 100 mm × 25 mm × 0.15 mm; S. I. Howard Glass, Worcester, MA. Fig. 3: freshly cleaved ruby muscovite mica; Paramount Corporation, NY) and incubated for 30 min in a water-saturated atmosphere followed by three rinses with distilled water. To prevent nonspecific oligo binding, a 6-μL drop of BSA (10 mg/mL) was put onto the thrombin-coated substrate and incubated for 5 min, rinsed with distilled water, and dried with N2 gas.
Fig. 4.
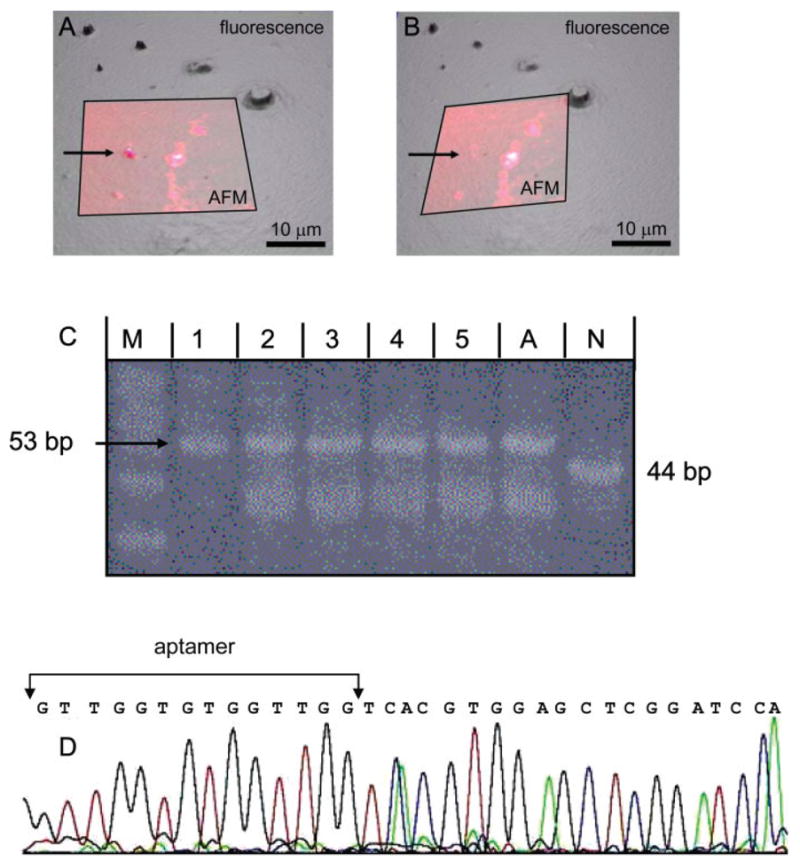
Proof-of-principle: Selection of target-bound aptamer-bead construct followed by amplification and sequencing of extracted DNA. A 1:1 mixture of aptamer-modified beads and nonsense oligo-modified beads was reacted with the thrombin-coated substrate. (A and B) AFM and fluorescence images before (A) and after (B) extraction of a bead. A 30-μm AFM image (small, lighter, and semitransparent square) is overlaid on a section of a larger (specular) fluorescence image; fluorescence light intensity is displayed as height in the underlying fluorescence image. A bead (arrow) was extracted with the AFM tip. The bead is missing in both images after the extraction. (C) 20% PAGE showing the PCR reactions of five extracted beads and corresponding positive (aptamer) and negative (nonsense oligo) controls. All extracted beads are aptamer-modified beads. Lane M, 10 bp marker (lowest band is 30 bp); lane 1–5, PCR reactions of 5 extracted beads; lane A, aptamer control with a PCR reaction of ~100 aptamer molecules; lane N, nonsense control with a PCR reaction of ~100 nonsense molecules. The lower bands in lanes 2–5 and lane A are aborted PCR products. (D) Sequence data for one of the extracted and amplified pieces of DNA. The resulting sequence exactly matches the thrombin aptamer sequence starting at the second G of the aptamer sequence. (The first 20 bases of the 53-base aptamer oligo are missing, because sequencing machines cannot fully sequence such short fragments.)
Fig. 3.
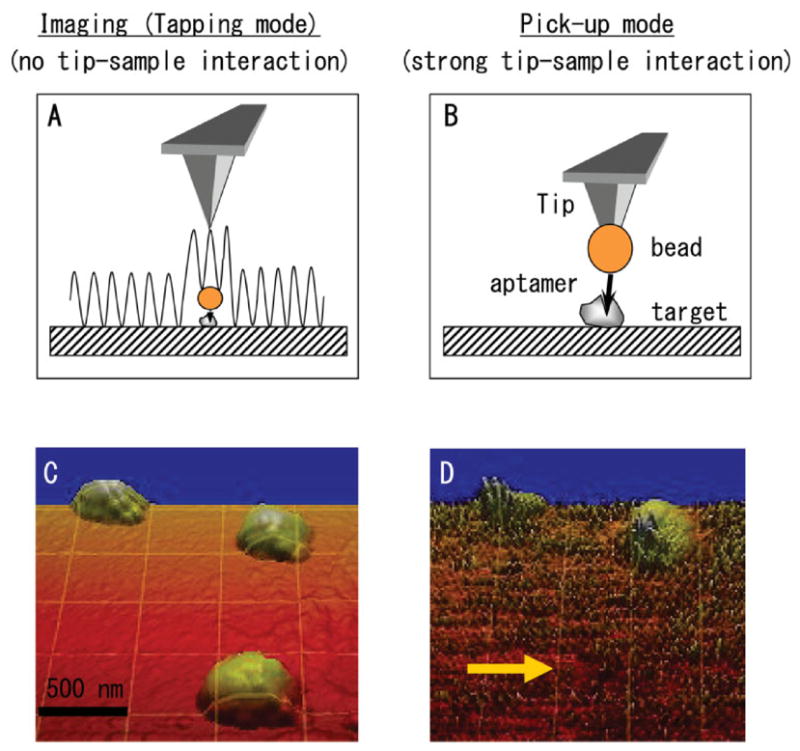
Extraction of aptamer-coated bead. (A) Schematic of tapping mode imaging of surface (target)-bound bead. This imaging mode exerts only small forces on the bead and, thus, does not move the bead laterally. (B) Schematic showing extraction of a bead by “spearing” it with the AFM tip. (C) AFM image of three 120-nm surface (target)-bound beads. The beads are 120-nm high. However, they appear wider in the image because of the AFM tip broadening effect. (D) Image of the same region after one of the beads was extracted by the AFM tip. The image is noisy, because a bead is attached to the imaging tip. [Color figure can be viewed in the online issue, which is available at www.interscience.wiley.com.]
Preparation of Oligo-Labeled Beads
Streptavidin-coated latex beads (120-nm diameter; Bangs Laboratories, Fishers, IN) or gold beads (30 nm; Research Diagnostics, Flanders, NJ) were incubated in “bead buffer” (100 mM borate, pH 8.5, 0.1% BSA, 0.05% Tween 20, 10 mM EDTA) overnight with “oligo-1” containing the known thrombin aptamer, GGTTGGTGT GGTTGG (Bock et al., 1992; Tsiang et al., 1995), or “oligo-2” containing an arbitrary “nonsense” sequence (oligos from: MWG Biotech, Highpoint, NC). The 5′-ends of the oligos were fluorescently labeled with FAM (fluorescein), and the 3′-ends were labeled with biotin. Oligo-1 (5′-CGTACGGTCGACGCTAGCTGGTTGGTGTGGTTGGTCACGTGGAGCTCGGATCC-3′) and oligo-2 (5′-CGTACGGTCGACGCTAGCTCATCATTCACGTGGAGCTCGGATCC-3′) were 53 and 44 nucleotides long, respectively. The two oligos differ in length so that they can be distinguished by gel electrophoresis. The aptamer sequence (underlined) or nonsense sequence (underlined) is flanked by a primer sequence on either end. Approximately 100 oligos were attached to each bead. In the selection experiment (Fig. 4), nonsense oligo- and aptamer-modified beads were mixed 1:1 to create a simple, binary library (binary pool). Larger “one sequence per bead” libraries could be created by using split and pool methods (Furka et al., 1988; Lam et al., 1991). One drop (~ 6 μL) of the library was put on the substrate and incubated for 10 min inside a box with a water-saturated atmosphere, rinsed thrice with distilled water (Millipore, Bedford, MA) and dried with N2 gas.
PCR and Analysis of DNA on AFM Tip
After aptamer extraction (see below), the AFM tip (with attached bead and oligos) was removed from the AFM and deposited into a PCR tube. The DNA on the tip was amplified in a total volume of 90 μL with 2.5 units of Taq DNA Polymerase (Fermentas, Hanover, MD), 1.11 μM primer 1 (5′-CGTACGGTCGACGCT-AGC-3′; MWG Biotech, Highpoint, NC), 1.11 μM primer 2 (5′-GGATCCGAGCTCCACGTG-3′; MWG Biotech, Highpoint, NC), 0.22 mM 4X-dNTP (TaKaRa Bio, Shiga, Japan), 8% glycerol (Sigma, Saint Louis, MI), 0.01% Triton X-100 (Sigma, Saint Louis, MI), 3 mM MgCl2, 10 mM Tris–HCl (pH 8.8), and 50 mM KCl. The detergent Triton X-100 was critical for eluting the DNA from the tip. The reaction was covered with 30-μL mineral oil and preheated at 94°C for 4 min followed by 42 cycles of 30 s at 94°C, 1 min at 56°C, and 30 s at 72°C. All PCR reactions were carried out in a Mastercycler gradient (Eppendorf, Hamburg, Germany). For positive (aptamer) and negative (nonsense oligo) PCR controls (lanes A and N in Fig. 4C), oligos were diluted to about 100 copies per tube and subjected to the same PCR conditions as mentioned earlier.
PCR products were detected by 20% polyacrylamide gel electrophoresis. The 10-bp marker was from Promega (Promega, Madison, WI). DNA was stained with SYBR green I (SIGMA, Saint Louis, MI) and visualized on a UV-transilluminator (UVP 3UV transilluminator, Upland, CA).
For sequencing, PCR products were gel-purified in 2% agarose and gel-extracted with the QIAEX-II gel extraction kit (Qiagen GmBH, D-40724 Hilden, Germany) according to the manufacturer’s instructions and sequenced at the Wake Forest University DNA sequencing facility.
Instrumentation: Hybrid AFM/Fluorescence System
Figure 2 shows the hybrid atomic force-fluorescence microscopy instrument and images demonstrating its functionality. A photograph of the hybrid instrument is depicted in Figure 2A. The sample is placed on a custom-built optical microscope stage (Guthold et al., 2004; Stephens, 2005). The AFM fits on this stage, which is designed to move as needed to position the AFM tip directly over the objective lens. Additionally, once the AFM and the objective lens are aligned, the sample can be moved independently of both microscopes via a lever arm that is connected to a stack of x-y-z micrometer screws. Thus, different regions of the sample can be viewed without disturbing the alignment of the AFM tip and the objective lens. This set-up allows us to image the fluorescently labeled beads from underneath by optical microscopy, while the sample can be accessed from the top with the AFM to obtain high-resolution images and pick up target-bound beads. The schematics of the instrument and the light paths in epifluorescence and TIRF illumination are shown in Figures 2B and 2C. When the AFM is sitting on top of the sample, the optical path above the sample is blocked, and the optical microscope may be operated in epifluorescence or TIRF mode. In epifluorescence mode, the sample is illuminated from underneath with light coming from a 100 W-Hg lamp, passing through the excitation filter. In TIRF mode, laser light is guided through an optical fiber and coupled into the substrate via a prism (Mathur et al., 2000). In this case, the sample is illuminated with an evanescent wave (Fig. 2D). Figure 2E shows a photograph of the totally internally reflected laser light traveling through the cover slip. (The light trace can be seen, because of surface contamination on the cover slip). In both illumination modes (TIRF and epifluorescence), the emitted light is passed through the emission filter and directed toward the CCD camera. Figures 2F and 2G show TIRF and epifluorescence test images of 200-nm Fluoresbrite carboxy YG microspheres (Polysciences, Warrington, PA) embedded in 2% agarose solution. It is apparent that in TIRF imaging mode, only beads on the surface are excited and emit a fluorescence signal, and most of the background coming from beads in solution is eliminated. In epifluorescence mode, the fluorescence signal coming from the beads on the surface barely rises above the background fluorescence coming from beads in solution. Figure 2H shows the commensurate fluorescence image and two zoomed-in AFM images of 200-nm Fluoresbrite carboxy YG microspheres (Polysciences, Warrington, PA). The higher resolution of the AFM is demonstrated in the 2-μm zoomed-in image.
Fig. 2.
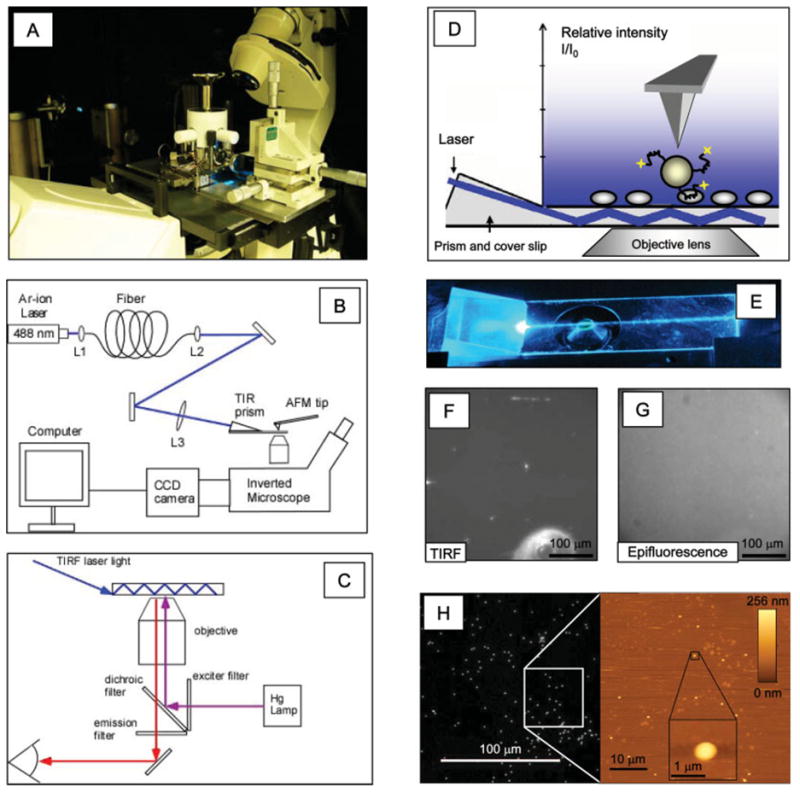
Instrumentation and sample images. (A) Photograph of our hybrid AFM fluorescence microscopy instrument. TIRF illumination is to the left of the AFM, and a stack of x-y-z micrometer screws, which is used to move the sample, is to the right of the AFM. (B) Schematics of the hybrid instrument and (C) the epifluorescence and TIRF light paths. (D) Schematics of TIRF illumination. Laser light is coupled into the cover slip via a prism. The coupled light is totally internally reflected, thus creating an evanescent light field above the substrate. Only molecules on the surface will be illuminated. Target molecules on the substrate, a bead with attached fluorescent aptamers, and the AFM tip are shown schematically. (E) Photograph of prism-based TIRF in a cover slip. (F) TIRF image of 200-nm fluorescent beads embedded in 2% agarose solution. Only beads on the surface are illuminated, thus minimizing background from beads in solution. (G) Epifluorescence image of the same region of the same sample (a few seconds later than (F)). All beads (surface and solution) are illuminated, resulting in a large amount of background. (H) Commensurate fluorescence microscopy image (left) and two zoomed-in AFM images of 50 and 2 μm size, respectively, of 200-nm beads (bead appears wider in 2-μm AFM image, because of tip-broadening effect). [Color figure can be viewed in the online issue, which is available at www.interscience.wiley.com.]
AFM Imaging and Manipulation
All AFM imaging and manipulation (i.e., bead extraction) experiments were done with a nanoManipulator-modified AFM (Topometrix Explorer, Veeco Instruments, Woodbury, NY). The nanoManipulator (3rd Tech, Chapel Hill, NC) is a software program that interfaces the AFM with a handheld force-feedback stylus (PHANToM, Sensable Technologies, Woburn, MA) and a graphics computer. It has many graphics and AFM-control features [for a more detailed description of the nanoManipulator see (Guthold et al., 1999, 2000, 2004)]. The most important features for our current research include:
The AFM data are sent to a graphics interface that displays the data as a real-time three-dimensional image.
The collected AFM data are also sent to a Phantom controller, which uses the data to construct a “feelable” surface. The user can thus feel the image surface in real-time, with the handheld, force-feedback stylus. This feature becomes important for bead extraction. Immediately before pick-up, the location of the bead can still be felt, which improves the accuracy of the pick-up execution.
Perhaps most important for our experiments, the nanoManipulator allows for very easy switching between AFM imaging modes and manipulation modes. For example, in these experiments, the bead was first imaged in tapping mode, in which the AFM tip is oscillated perpendicularly to the surface as it scans over the surface. Hence, the tip touches the surface only intermittently, and lateral forces are nearly eliminated. The sample is not disturbed, and images can be obtained relatively easily. Subsequently, bead extractions were either done in contact mode by pushing the bead laterally or in force spectroscopy mode. In force spectroscopy mode, the soft bead is “speared” by the sharp AFM tip.
In all experiments, we used silicon cantilevers (Nanosensors, Wetzlar, Germany) having a resonance frequency of ~175–195 kHz and a spring constant of ~40 N/m. Each tip was cleaned for a few minutes in a UV/ozone cleaner (Samco International, Kyoto, Japan) before AFM imaging.
All AFM imaging was done under ambient conditions.
Fluorescence Microscopy
We used a Zeiss Axiovert 200 microscope (Zeiss, Göttingen, Germany) in epifluorescence or prism-based TIRF imaging mode, a Hamamatsu EM-CCD C9100 Camera (Hamamatsu Photonics KK, Japan) and IPLab software (Scanalytics, Fairfax, VA) for optical imaging and image analysis. Excitation light from the Hg-lamp was first passed through a neutral density filter to reduce light intensity and thus photo bleaching. A standard FITC filter cube from Chroma (Chroma Technology, Rockingham, VT) was used to filter excitation and emission light. Images were typically recorded with a 40× objective lens with a numerical aperture of 0.75.
Prism-Based TIRF Set-Up
The TIRF system was based on an air-cooled Ar+ laser (Ion Technology) operated at a wavelength of 488 nm (Fig. 2B). The laser light is delivered to the microscope using an optical fiber assembly (Thorlabs, Newton, NJ) consisting of an aspheric launch lens and a collimating output lens identical to the launch lens. The fiber is single-mode with a core diameter of 3.5 μm. The transmission efficiency of the fiber system was about 25%. The maximum output power of the laser was 68 mW, resulting in delivery of about 17 mW out of the fiber. After leaving the fiber and collimating output lens, the beam was 3 mm in diameter. The laser beam was then focused with a 22-cm focal length lens mounted on a translatable optical lens mount that could also tilt (lens L3 in Fig. 2B). The light was focused onto a coupling prism (the TIR prism; Fig. 2B). The transverse electric magnetic (TEM)00 laser beam was focused to a beam spot diameter of about 50 μm with its focus located approximately in the field of view of the microscope objective. The exact location of the focus does not matter, since the beam’s depth of focus is about 8 mm. The TIRF prism was a custom ground and polished prism (Novaphase, Newton, NJ) designed so that the laser beam entered roughly normal to the first surface. The prism, made of BK-7 glass, was a right-angle prism that originally had two 1 in2 faces. The hypotenuse of this prism was ground and then optically polished until the shallow angle was 18°. The prism was coupled to the sample cover slip with immersion oil for microscopy (Immersol™ 518, ne = 1.518, ve = 45; Carl Zeiss, Oberkochen, Germany) to provide good index matching between the prism and the cover slip. The location of the TIRF beam in the sample could be easily moved laterally in the plane of the cover slip by adjusting the horizontal tilt axis of the focusing lens.
RESULTS
Figure 3 shows the schematics and two AFM images corresponding to the extraction of an aptamer-coated bead attached to a thrombin-functionalized substrate. One of the challenges in these experiments is that the AFM tip must be used for two seemingly conflicting tasks. First, the tip must be used to image the sample without moving the bead. This task is done in tapping mode, in which the tip touches the bead only intermittently (Fig. 3A). Subsequently, tip-sample interaction forces must be altered so that the tip interacts strongly with the bead to retrieve it. This task was done in contact mode by laterally pushing and dislodging the bead and/or in force spectroscopy mode by “spearing” the bead (Fig. 3B). Figures 3C and 3D show the successful extraction of a bead. Figure 3C shows a tapping mode image of three beads attached to the thrombin-coated substrate via a thrombin-aptamer. One of the beads was targeted and picked up with the AFM tip by “spearing” it. Subsequently, the sample was imaged again (Fig. 3D); it can be seen that one of the three beads is missing (arrow), as it is attached to the tip at this point in the experiment. Image 3D appears very noisy, because the imaging tip now has a bead attached to it.
Figure 4 describes the results of the selectivity experiments. We defined the proof-of-principle goal for this work to be data showing that aptamer molecules can be repeatedly and reproducibly detected and isolated from a small (binary) pool of oligos based on target-binding affinity. We functionalized beads either with a thrombin aptamer (53 nucleotides) or a non-sense oligo (44 nucleotides) and a 1:1 mixture of such beads was reacted with a thrombin-coated surface. Our method was then used to extract beads. The criterion for selectivity in this series of experiments is repeated and reproducible extraction of only the thrombin aptamer (and not the nonsense aptamer) from the binary pool.
Figures 4A and 4B show such an extraction of a surface-bound bead as observed by combined AFM and fluorescence microscopy. The large (specular, darker) fluorescence and smaller (semitransparent, lighter) AFM images are overlaid. Light intensity in the fluorescence image is represented by height. Figure 4A shows the preextraction surface with one bead targeted for retrieval (arrow). Figure 4B shows the overlaid postextraction images. It is apparent that the targeted bead is missing in both postextraction images (arrow). The AFM tip was removed and deposited in a PCR-reaction tube. The DNA on the bead was eluted, PCR-amplified, analyzed by PAGE, and sequenced.
This experiment was repeated 15 times. Eight of the 15 PCR reactions (53%) yielded a DNA product, and 7 reactions yielded no DNA. The DNA of all eight of those successful extraction experiments corresponded to the aptamer DNA. The PCR products of five representative reactions are shown in Figure 4C. The chance of randomly picking up eight aptamer beads in a 1:1 aptamer:nonsense mixture is 1:28 = 1:256. Thus, our results strongly indicate that the aptamer beads bound specifically to their target and were selectively extracted from a 1:1 mixture of aptamer and nonsense molecules. There could be at least two reasons why the seven other PCR reactions yielded no DNA. The bead may not have been attached strongly enough to the tip, so it dissociated in the process of reimaging the substrate or transferring the tip to the PCR tube. Or the PCR reaction simply did not work, because there was not enough template DNA in solution.
Subsequently, the extracted and PCR-amplified oligo DNA was sequenced (Fig. 4D). The sequence of the extracted oligos was identical to the thrombin aptamer sequence, confirming that our selection procedure was able to specifically detect and isolate target-binding aptamers. Moreover, it is important to note that the extracted DNA did not get damaged by our procedure as shown by successful PCR amplification and sequencing.
DISCUSSION
We have introduced a novel microscopy technique to select individual oligo species according to their binding affinity from a pool of other oligos in a single cycle. We have also shown that the selected oligo can be amplified by PCR and sequenced. Proof-of-principle was achieved by specifically selecting a known aptamer sequence eight times from a binary pool of oligos. Although we illustrate this technique here using a binary oligo pool as model system, we believe the underlying approach is applicable to larger oligo pools and libraries as well. To do this, diverse libraries of oligo-modified beads could be prepared by split-and-pool methods (Furka and others, 1988; Lam et al., 1991). Although libraries prepared by split-and-pool methods are less diverse than those used in SELEX or NECEEM, single-cycle selection of moderate-sized libraries may provide a number of advantages over conventional selection methods. One advantage of our single-cycle approach is that each selected molecule can be amplified, sequenced, and analyzed immediately without intervening cloning and purification steps.
Another advantage could be the potential to select ligands for the ability to bind target molecules in a site-specific manner (e.g., on a cell surface). Resolution of site-specific binding properties would be made possible in our technique by nanoscale detection, as each binding site from which an oligo is extracted can be seen by fluorescence and/or AFM imaging. It would therefore be conceivable, for example, to select oligos from specific “interesting” sites on a cell surface (e.g., a membrane protein).
Our technique may find utility not only as a selection tool, but also in molecular detection, diagnostics, and/or identification. For example, beads labeled with variable-sequence oligos could be used to detect the presence of complementary target sequences in DNA-containing samples. Individual DNA-bound beads can then be extracted and the attached oligos amplified and sequenced.
The selection experiments described in this article were carried out statically under ambient conditions. The experiments could also be done dynamically in solution. In this case, the library of oligos would be flowed over the target area, and the binding events would be observed from underneath the sample by in situ fluorescence microscopy. In this case, TIRF illumination must be used so that only molecules bound to the surface will be seen with minimal background from molecules in solution. Emission of fluorescence from oligos that are not bound to the target (surface) will not couple to the coverslip (waveguide) and will therefore not generate a detectable signal.
In the static system described in this article, a fluorescence signal resulting from a binding event can come from a specifically bound aptamer or from a non-specifically bound oligo. However, it is interesting to consider the possibility of a dynamic set-up, where three interrelated characteristics of the fluorescence signal might be used to distinguish specific from non-specific binding: (1) Duration: specifically bound aptamers should have a much longer residence time than nonspecifically bound oligos and should thus result in much longer fluorescence signals. (2) Intensity: since the intensity of the signal depends on the proximity to the surface, specifically bound oligos should also emit a more intense fluorescence signal. (3) Mobility: molecules can diffuse or hop over surfaces that have many binding sites. Nonspecifically bound oligos should have a much higher dissociation rate and should thus move faster.
We envision that the technique described here can ultimately be used to observe single binding events and to subsequently select, isolate, and identify individual target-binding molecules in situ from random-sequence pools or combinatorial libraries of oligos.
Acknowledgments
We are grateful to Xiangdong Lu and Yue Hu (Department of Biochemistry, University of North Carolina, Chapel Hill) for helping with PCR and PAGE.
Footnotes
Contract grant sponsor: Research Corporation; Contract grant number: RI0826; Contract grant sponsor: American Cancer Society; Contract grant number: IRG-93-035-6; Contract grant sponsor: National Cancer Institute; Contract grant number: 1 R41 CA10312-01; Contract grant sponsors: Wake Forest University, Science Research Fund, Cross-Campus; Contract grant sponsor: NIH resource: Computer Integrated Systems for Microscopy and Manipulation (CISMM); Contract grant number: P41-EB002025-21.
® “NanoSelection” is a registered trademark licensed to NanoMedica, Inc.
References
- Axelrod D. Total internal reflection fluorescence microscopy. In: Periasamy A, editor. Methods in cellular imaging. New York: Oxford University Press; 2001. pp. 362–380. [Google Scholar]
- Berezovski M, Drabovich A, Krylova SM, Musheev M, Okhonin V, Petrov A, Krylov SN. Nonequilibrium capillary electrophoresis of equilibrium mixtures: A universal tool for development of aptamers. J Am Chem Soc. 2005;127:3165–3171. doi: 10.1021/ja042394q. [DOI] [PubMed] [Google Scholar]
- Berezovski M, Musheev M, Drabovich A, Krylov SN. Non-SELEX selection of aptamers. J Am Chem Soc. 2006;128:1410–1411. doi: 10.1021/ja056943j. [DOI] [PubMed] [Google Scholar]
- Bock LC, Griffin LC, Latham JA, Vermaas EH, Toole JJ. Selection of single-stranded-DNA molecules that bind and inhibit human thrombin. Nature. 1992;355:564–566. doi: 10.1038/355564a0. [DOI] [PubMed] [Google Scholar]
- Ellington AD, Szostak JW. Invitro selection of RNA molecules that bind specific ligands. Nature. 1990;346:818–822. doi: 10.1038/346818a0. [DOI] [PubMed] [Google Scholar]
- Ellington AD, Szostak JW. Selection invitro of single-stranded-DNA molecules that fold into specific ligand-binding structures. Nature. 1992;355:850–852. doi: 10.1038/355850a0. [DOI] [PubMed] [Google Scholar]
- Furka A, Sebestyén F, Asgedom M, Dibó G. Highlights of modern biochemistry. Prague, Czechoslovakia: VSP; 1988. p. 47. [Google Scholar]
- Gragoudas ES, Adamis AP, Cunningham ET, Feinsod M, Guyer DR. Pegaptanib for neovascular age-related macular degeneration. N Engl J Med. 2004;351:2805–2816. doi: 10.1056/NEJMoa042760. [DOI] [PubMed] [Google Scholar]
- Guthold M, Falvo M, Matthews WG, Paulson S, Mullin J, Lord S, Erie D, Washburn S, Superfine R, Brooks FP, Taylor RM. Investigation and modification of molecular structures using the nanomanipulator. J Mol Graph Model. 1999;17:187–197. doi: 10.1016/s1093-3263(99)00030-3. [DOI] [PubMed] [Google Scholar]
- Guthold M, Falvo MR, Matthews WG, Paulson S, Washburn S, Erie D, Superfine R, Brooks FP, Taylor RM. Controlled manipulation of molecular samples with the nanomanipulator. IEEE/ASME Trans Mechatron. 2000;5:189–197. [Google Scholar]
- Guthold M, Liu W, Stephens B, Lord ST, Hantgan RR, Erie DA, Taylor RM, Superfine R. Visualization and mechanical manipulations of individual fibrin fibers suggest that fiber cross section has fractal dimension 1.3. Biophys J. 2004;87:4226–4236. doi: 10.1529/biophysj.104.042333. [DOI] [PMC free article] [PubMed] [Google Scholar]
- Kirby R, Cho EJ, Gehrke B, Bayer T, Park YS, Neikirk DP, McDevitt JT, Ellington AD. Aptamer-based sensor arrays for the detection and quantitation of proteins. Anal Chem. 2004;76:4066–4075. doi: 10.1021/ac049858n. [DOI] [PubMed] [Google Scholar]
- Lam KS, Salmon SE, Hersh EM, Hruby VJ, Kazmierski WM, Knapp RJ. A new type of synthetic peptide library for identifying ligand-binding activity. Nature. 1991;354:82–84. doi: 10.1038/354082a0. [DOI] [PubMed] [Google Scholar]
- Lee JF, Hesselberth JR, Meyers LA, Ellington AD. Aptamer database. Nucleic Acids Res. 2004;32:D95–D100. doi: 10.1093/nar/gkh094. [DOI] [PMC free article] [PubMed] [Google Scholar]
- Lü J-H, Li H-K, An H-J, Wang G-H, Wang Y, Li M-Q, Zhang Y, Hu J. Positioning isolation and biochemical analysis of single DNA molecules based on nanomanipulation and single-molecule PCR. J Am Chem Soc. 2004;126:11136–11137. doi: 10.1021/ja047124m. [DOI] [PubMed] [Google Scholar]
- Mathur AB, Truskey GA, Reichert WM. Atomic force and total internal reflection fluorescence microscopy for the study of force transmission in endothelial cells. Biophys J. 2000;78:1725–1735. doi: 10.1016/s0006-3495(00)76724-5. [DOI] [PMC free article] [PubMed] [Google Scholar]
- Nimjee SM, Rusconi CP, Sullenger BA. Aptamers: An emerging class of therapeutics. Annu Rev Med. 2005;56:555–583. doi: 10.1146/annurev.med.56.062904.144915. [DOI] [PubMed] [Google Scholar]
- Osada T, Uehara H, Kim H, Ikai A. mRNA analysis of single living cells. J Nanobiotechnol. 2003;1:2. doi: 10.1186/1477-3155-1-2. [DOI] [PMC free article] [PubMed] [Google Scholar]
- Stephens BJ. Honors Thesis. Wake Forest University; Winston-Salem: 2005. Construction and application of a combined AFM/FM (with TIRF) [Google Scholar]
- Thalhammer S, Stark RW, Muller S, Wienberg J, Heckl WM. The atomic force microscope as a new microdissecting tool for the generation of genetic probes. J Struct Biol. 1997;119:232–237. doi: 10.1006/jsbi.1997.3869. [DOI] [PubMed] [Google Scholar]
- Tsiang M, Gibbs CS, Griffin LC, Dunn KE, Leung LLK. Selection of a suppressor mutation that restores affinity of an oligonucleotide inhibitor for thrombin using in-vitro genetics. J Biol Chem. 1995;270:19370–19376. doi: 10.1074/jbc.270.33.19370. [DOI] [PubMed] [Google Scholar]
- Tuerk C, Gold L. Systematic evolution of ligands by exponential enrichment: RNA ligands to bacteriophage-T4 DNA-polymerase. Science. 1990;249:505–510. doi: 10.1126/science.2200121. [DOI] [PubMed] [Google Scholar]
- Uehara H, Osada T, Ikai A. Quantitative measurement of mRNA at different loci within an individual living cell. Ultramicroscopy. 2004;100:197–201. doi: 10.1016/j.ultramic.2004.01.014. [DOI] [PubMed] [Google Scholar]
- Xu XM, Ikai A. Retrieval and amplification of single-copy genomic DNA from a nanometer region of chromosomes: A new and potential application of atomic force microscopy in genomic research. Biochem Biophys Res Commun. 1998a;248:744–748. doi: 10.1006/bbrc.1998.9027. [DOI] [PubMed] [Google Scholar]
- Xu X-M, Ikai A. Recovery and amplification of plasmid DNA with atomic force microscopy and the polymerase chain reaction. Anal Chim Acta. 1998b;361:1–7. [Google Scholar]
- Yan AC, Bell KM, Breeden MM, Ellington AD. Aptamers: Prospects in therapeutics and biomedicine. Front Biosci. 2005;10:1802–1827. doi: 10.2741/1663. [DOI] [PubMed] [Google Scholar]