Abstract
N-Acetylglucosaminyltransferase III (GnT-III) produces “bisecting-GlcNAc” and regulates the branching of N-glycans. GnT-III activity is elevated during hepatocarcinogenesis, which is in contrast to the undetectable level found in normal hepatocytes. To determine the biological significance of GnT-III in hepatocytes, transgenic mice that specifically express GnT-III in the liver were established and characterized. The transgenic hepatocytes had a swollen oval-like morphology, with many lipid droplets. Apolipoprotein B, which contained increased level of bisecting-GlcNAc accumulated in the transgenic hepatocytes. In the transgenic serum, triglycerides, the β- and pre-β-lipoprotein fractions, and apolipoprotein B100 were significantly decreased, compared with levels in nontransgenic serum. These abnormal phenotypes were more prominent in the mice with more copies of the transgene and a resulting high GnT-III activity. We demonstrate that aberrant glycosylation, as the direct result of the formation of bisecting-GlcNAc, disrupts the function of apolipoprotein B, leading to the generation of fatty liver. This observation suggests a novel mechanism for the pathogenesis of fatty liver.
Keywords: N-glycosylation, transgenic mice, bisecting GlcNAc, glycosyltransferase
N-glycans contribute to the folding, stability, and biological activity of glycoproteins (reviewed in ref. 1). N-glycans have a common core structure, and their branching patterns are determined by glycosyltransferases such as N-acetylglucosaminyltransferases (GnT I–VI), fucosyltransferase (α1-6FucT) (2, 3), etc. Recently, the gene that encodes the critical branching enzyme, GnT-I, which initiates the synthesis of complex type N-glycans, was “knocked out” to produce a null mutation mouse strain. The mice was lethal at 9.5–10.5 days of embryonic life, demonstrating that complex type N-glycans are essential for embryogenesis (4, 5).
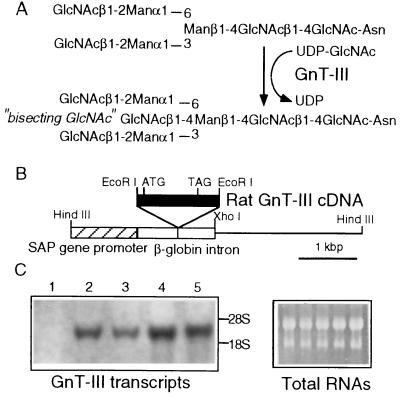
UDP-N-acetylglucosamine:β-d-mannoside β-1,4-N-acetylglucosaminyltransferase III (GnT-III) [EC 2.4.1.144], an N-acetylglucosaminyltransferase, catalyzes the addition of a bisecting-GlcNAc to the β-mannoside of the tri-mannose core in N-glycans (Fig. 1A) (6). Our recent investigations revealed that the bisecting-GlcNAc residue, a product of GnT-III, is involved in a number of biological events, including the suppression of metastasis of mouse melanoma cells (7) and the reduction of hepatitis B virus replication in hepatoma cells (8).
Figure 1.
(A) Synthesis of “bisecting-GlcNAc” N-glycans by GnT-III. GnT-III catalyzes the attachment of β-1,4-GlcNAc to the β-d-mannoside of the tri-mannose core structure of an N-glycan. (B) Schematic representation of the GnT-III expression vector. The GnT-III cDNA fragment was inserted into the EcoRI site, downstream of the SAP promoter. ATG and TAG indicate the initiation and stop codon, respectively. (C) Expression of GnT-III transcripts in the livers of nontransgenic and GnT-III transgenic mice. Total RNA (50 μg) was extracted from nontransgenic mice (lane 1), SAP-1 (lanes 2 and 3), and SAP-2 (lanes 4 and 5). The amount of GnT-III transcripts were evaluated by Northern analysis using [32P]-labeled GnT-III cDNA (Left). The ethidium staining of the gel indicate the RNA amount equally loaded in each lane (Right).
The GnT-III transcript and enzyme activity are not detected in normal adult rat liver (9), but are elevated in orotic acid-induced hepatic nodules (10), during hepatocarcinogenesis in LEC rats that develop hepatomas (11) and in regenerating rat livers (12). These results suggest that GnT-III expression is associated with proliferation, differentiation, and carcinogenesis of liver cells.
In the present study, transgenic mice that express GnT-III in the liver were generated to investigate the possible pathophysiological roles of GnT-III and its product, bisecting-GlcNAc. The transgenic mice developed fatty livers caused by dysfunction of apolipoprotein B (apo-B) that was aberrantly glycosylated by GnT-III.
MATERIALS AND METHODS
Recombinant DNA Constructs.
The 5′ noncoding region of rat GnT-III cDNA, comprising 256 nucleotides (13), was truncated to that containing 42 nucleotides from ATG, and the blunt-ended cDNA fragment containing the entire coding sequence was inserted into the pLG1-SAP EcoRI site, which also was blunt-ended by Klenow treatment to obtain the final construct, SAP-GnT-III (Fig. 1B). pLG1-SAP is a mammalian expression vector with a serum amyloid P component gene promoter and is used for liver-specific expression (14).
Transgenic Mice.
BDF1, an F1 generation of C57BL/6 and DBA/2, was used in this study. A HindIII–XhoI fragment including the SAP-GnT-III gene was isolated from pLG1-SAP and microinjected into single-cell mouse embryos. The embryos then were returned to pseudopregnant mice to establish founder mice (15). Genomic DNAs of the mice that were born were extracted from tail tissues to identify the transgene by Southern blot analysis using [32P]-labeled rat GnT-III cDNA probe (nucleotides 98–436). The founder mice then were mated with wild-type BDF1 mice to obtain an F1 generation of heterozygous transgenic mice. Newly born mice with the transgene among the F1 littermates were similarly identified by Southern blot analysis and were used as transgenic mice. The phenotypes were compared with nontransgenic mice (i.e., the F1 littermate lacking the transgene) as controls. The mice were fed a chow diet (not a high-fat diet) and were maintained under specific-pathogen-free conditions. Female mice at 8 weeks of age were used for analysis.
Northern Blot Analysis.
Total cellular RNAs (50 μg) were extracted from mouse livers by the acid guanidine/phenol/chlorofrom method, and GnT-III transcripts were detected by using [32P]-labeled rat GnT-III cDNA probe, as described earlier (12).
Assay for Glycosyltransferase Activities.
Liver tissues from mice were homogenized in PBS (pH 7.2) containing 1 μg/ml of aprotinin and 0.5 μg/ml of leupeptin, and the supernatants obtained on centrifugation at ×900 g for 20 min were used for the assays. GnT-III, GnT-V, and β-1,4-galactosyltransferase (GalT) activities were assayed as described earlier (16, 17) by HPLC using the fluorescence-labeled sugar chain, GlcNAcβ-1,2-Manα-1,3-(GlcNAcβ-1,2-Manα-1,6)-Manβ-1,4-GlcNAcβ-1,4-GlcNAc-PA (2-amino pyridine), as a substrate.
Lectin Blotting, Immunoblotting, and Immunoprecipitation.
Samples containing 10 μg of protein were subjected to 15% SDS/PAGE under reducing conditions, and then transferred to nitrocellulose membranes. The nonspecific binding sites of the membranes had been blocked by 3% BSA in PBS. For the detection of bisecting-GlcNAc residues using erythroagglutinating phytohemagglutinin (E-PHA, Honen, Tokyo), the membranes were desialylated by treatment with 0.2 units/ml of sialidase (Arthrobacter, Nacalai Tesque, Japan) in PBS at 37°C for 60 min (18). The samples then were incubated with biotinylated E-PHA (2 μg/ml) to evaluate the additional bisecting-GlcNAc on the N-oligosaccharide (19). Desialylation was confirmed by the abolished binding of Sambucus sieboldiana, a marker for sialic acid residues.
The membranes also were probed with a rabbit anti-mouse apo-B antibody (donated by Jan Borén, Gladstone Institute, San Francisco; ref. 20) using the same buffer systems as above. Proteins reactive to the antibody and lectins were detected by using a peroxidase-conjugated goat anti-rabbit IgG (Cappel) and an avidin-peroxidase complexes (Vecstatin ABC kit, Vector Laboratories), respectively. The signals were visualized with an ECL kit (Amersham) and exposed to x-ray films, according to the manufacturer’s instructions.
Apo-B was precipitated from liver cell lysates (5 mg protein) by using anti-mouse apo-B antibody. The immunoprecipitated samples were subjected to 8% SDS/PAGE under reducing conditions, and then to lectin and immunoblotting as described above. The signal intensities were determined through densitometry.
HPLC Analysis for N-Glycans.
Peripheral blood was collected from mice, stored at room temperature for 1 hr, then cooled to 4°C and stored overnight at 4°C. Sera (0.3 ml) were collected by centrifugation at ×500 g for 10 min. First, lipids were removed from the sera by chloroform/methanol extraction according to the methods as described (21). The precipitates were lyophilized and redissolved in 0.5 M Tris⋅HCl, pH 8.0/50 mM β-mercaptoethanol/2% SDS. Then, the samples were incubated with N-glycanase (0.5 units; Genzyme) overnight, and the released N-glycans were collected by phenol/chloroform extraction as described (22). After desalting on a PD-10 column (Pharmacia), N-glycans were labeled with 2-amino pyridine as described earlier (16), and then subjected to reverse phase HPLC analysis after treatment with glycosidase mixture 1, which is comprised of sialidase (Arthrobacter), β-galactosidase (Aspergillus), and α-fucosidases (Streptomyces and bovine kidney) (Takara Shuzo, Japan).
Light Microscopic Analyses.
Liver tissues were fixed by generalized perfusion in 10% paraformaldehyde, sequentially dehydrated with ethanol, embedded in paraffin wax, sectioned (8–10 μm), and then stained with hematoxylin and eosin. To detect lipids, freshly frozen sections were fixed for 10 min at room temperature in 4% paraformaldehyde in PBS, washed, and then stained for 10 min in freshly filtered oil-red O in 70% aqueous isopropanol. Immunohistochemical analysis of liver tissues was performed by using anti-mouse apo-B antibodies and a conventional immunoperoxidase technique involving a diaminobenzidine colorimetric reagent.
Assays for Biochemical Markers.
Plasma glucose, serum total cholesterol, triglyceride, and albumin values were assayed by using an automated analyzer (Reflotron system, Boehringer Mannheim).
Lipoprotein Analysis.
Serum lipoproteins were separated by electrophoresis on a 0.5% agarose gel, followed by staining with Sudan black B by using a Lipoprotein Electrophoresis kit (Paragon; Beckman Instruments) according to the manufacturer’s recommended protocol. The relative amounts of serum β-lipoprotein and pre-β-lipoprotein were determined by densitometry, and were corrected by the amount of serum albumin. β-lipoproteins and pre-β-lipoproteins were purified from 1 ml of nontransgenic SAP-1 and SAP-2 serum by the Ca2+/heparin method (23) using a kit (Wako Pure Chemicals, Japan), and subjected to 6% SDS/PAGE, followed by immunoblotting using anti-mouse apo-B antibodies.
Statistical Analysis.
The Student’s t test was used for statistical analysis.
RESULTS
Establishment of Transgenic Mouse Lines Expressing GnT-III in the Liver.
The SAP promoter gene (14) was used for the liver-specific expression of GnT-III to construct the GnT-III expression vector (Fig. 1B). Eleven mice that received embryos containing the SAP-GnT-III gene by microinjection gave birth to a total of 85 mice. In the offspring, two were found to contain the transgene, termed SAP-1 (four copies of transgene) and SAP-2 (six copies). These were mated with wild-type BDF1 mice to generate F1 littermates. As shown in Fig. 1C, the GnT-III transcripts were apparent in the livers from SAP-1 and SAP-2 in contrast to undetectable levels in the nontransgenic livers and were more elevated in SAP-2 than in SAP-1. As shown in Table 1, GnT-III activity was detected in the liver homogenates of SAP-1 and SAP-2 and was significantly higher in SAP-2 than in SAP-1, showing that the transgene number correlates to the transcriptional level and the enzyme activity. The activity was almost the same level as that observed in LEC rat hepatoma tissues (50–200 pmol/hr per mg; ref. 11). GnT-III gene expression in the liver had no effect on other glycosyltransferase activities, such as those of GnT-V and GalT. In several tissues other than liver, no differences in the transcript level or activity were observed between transgenic and nontransgenic mice (data not shown).
Table 1.
GnT-III, GnT-V, and GalT activities of nontransgenic and GnT-III transgenic livers
| Mouse | GnT-III | GnT-V, | GalT |
|---|---|---|---|
| pmol/h per mg of protein | |||
| Nontransgenic | ND | 11.4 ± 4.3 | 1,280 ± 90 |
| SAP-1 | 134 ± 19 | 12.4 ± 4.6 | 1,160 ± 90 |
| SAP-2 | 186 ± 26* | 9.8 ± 3.4 | 1,020 ± 110 |
The values are reported as the mean ± SD for 16 mice in each group. ND, not detectable (<2 pmol/h per mg of protein).
, P < 0.05 vs. SAP-1.
Aberrant Glycosylation in Hepatocytes and Sera from Transgenic Mice.
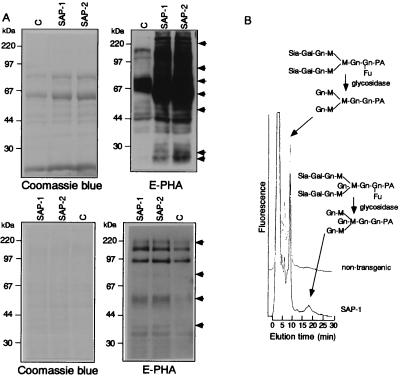
To evaluate the sugar components of glycoproteins, lectin blot analyses were performed using liver homogenates and sera with E-PHA lectins, because E-PHA is known to react preferentially with bisecting-GlcNAc (19). Liver homogenates and sera from SAP-1 and SAP-2 showed high reactivity to E-PHA, as compared with its weak binding in nontransgenic liver homogenates (Fig. 2A). In addition, several bands in SAP-2 showed higher affinity to E-PHA than the corresponding bands in SAP-1, as indicated by arrows.
Figure 2.
(A) Lectin blot analysis of hepatocytes and sera from a nontransgenic and a GnT-III transgenic mouse. Ten micrograms of proteins from homogenized livers (Upper) and sera (Lower) of nontransgenic (indicated as C), SAP-1, and SAP-2 mice were subjected to 15% SDS/PAGE under reducing conditions, followed by lectin blot analysis with biotinylated E-PHA. Before E-PHA probing, membranes were desialylated by the treatment with sialidase. The proteins visualized by Coomassie blue staining indicate the protein amount equally loaded in each lane. The results were reproducible for 10 independent mice in each group. (B) Detection of complex N-glycans bearing bisecting-GlcNAc among the serum glycoproteins by HPLC. N-glycans were extracted from sera through N-glycanase digestion and labeled with 2-amino pyridine. After glycosidase treatment, the labeled glycans were separated by reverse-phase HPLC under the conditions for the separation of complex N-glycans. The peak area for biantennary and biantennary with bisecting-GlcNAc sugars were calculated and the ratio of bisecting-GlcNAc sugars determined. The equivalent HPLC profile was reproducible in 8–10 independent mice in each group. Gn, N-acetylglucosamine; Sia, sialic acid; M, mannose; Gal, galactose; Fu, fucose; PA, 2-amino pyridine.
To confirm the increase in bisecting-GlcNAc residues in serum, N-glycans were extracted from the serum, labeled by using 2-amino pyridine, and then resolved by reverse-phase HPLC after glycosidase treatment. As shown in Fig. 2B, the transgenic sera contained detectable components of bisecting-GlcNAc structures: biantennary with bisecting-GlcNAc/biantennary (%), as determined by each peak area were 10.2 ± 1.9 and 12.7 ± 2.3 for SAP-1 (n = 10) and SAP-2 (n = 10), respectively. In the sera from nontransgenic mice, bisecting-GlcNAc components (%) were less than 0.5 (n = 8).
Collectively, these results indicate that GnT-III expression caused an increase in E-PHA reactive sugar (bisecting-GlcNAc) components, both in the liver homogenate and serum of SAP-1 and SAP-2.
Fatty Liver Generation in Transgenic Mice.
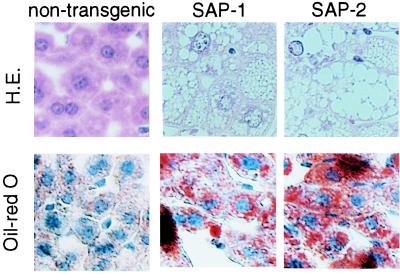
Microscopically, the hepatocytes in all regions of SAP-1 and SAP-2 livers exhibited ballooning and obvious cell changes indicative of accumulation in the cytoplasm, as shown in Fig. 3. No significant necrosis or inflammatory infiltration was observed. Oil-red O staining showed that the accumulation of lipids was limited in hepatocytes in transgenic mice. The lipid accumulation was limited in the hepatocytes and not observed in other liver cells, such as bile duct epithelial cells or endothelial cells on vessels. This morphological abnormality and lipid accumulation was observed in all transgenic mice examined and was more prominent in SAP-2 than in SAP-1.
Figure 3.
Histology of GnT-III transgenic liver. Liver sections from nontransgenic, SAP-1, and SAP-2 mice were fixed, processed, and then stained with hematoxylin and eosin (H.E.). Lipid was detected by oil-red O staining. The equivalent histology was observed for 10 mice in each group. Magnification: ×200.
The lipid accumulation observed in transgenic hepatocytes is progressive in age. On a chow diet, no significant differences were observed in the growth rate, such as body weight and size, between transgenic and nontransgenic mice. No malignant transformations were observed in transgenic mice, even at 50 weeks of age.
Decreases in Triglyceride, β-Lipoproteins, Pre-β-Lipoproteins, and Apo-B in Transgenic Mice Sera.
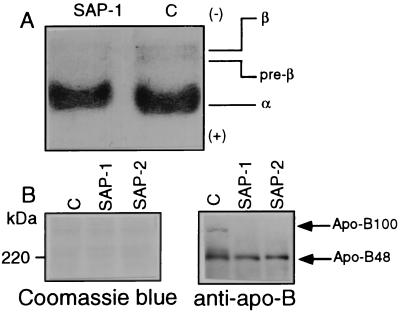
The levels of glucose, triglyceride, and cholesterol were determined in the serum after 18 hr of starvation. The triglyceride level in transgenic mice was significantly decreased, compared with that in nontransgenic mice, and the serum triglyceride value was lower in SAP-2 than in SAP-1 (Table 2). However, no significant differences in the levels of glucose, cholesterol, or albumin were noted between transgenic and nontransgenic mice. To determine the lipoprotein fractions responsible for the decrease in triglyceride in the transgenic mice, serum lipoproteins were analyzed by agarose gel electrophoresis followed by Sudan black B staining (Fig. 4A). The ratios (%) of the β- and pre-β-fractions were significantly reduced in both SAP-1 (n = 10) and SAP-2 (n = 10); 55.5 ± 4.3 and 44.6 ± 5.5 of the nontransgenic mice (n = 8) (P < 0.02 vs. nontransgenic mice), respectively.
Table 2.
Glucose, total cholesterol, and triglyceride levels in nontransgenic and GnT-III transgenic sera
| Mouse | Glucose, mg/dl | Cholesterol, mg/dl | Triglyceride, mg/dl | Albumin, mg/dl |
|---|---|---|---|---|
| Nontransgenic | 108 ± 17 | 97 ± 13 | 95 ± 12 | 1,190 ± 90 |
| SAP-1 | 98 ± 11 | 102 ± 16 | 64 ± 11* | 1,170 ± 120 |
| SAP-2 | 89 ± 21 | 99 ± 17 | 49 ± 11†‡ | 1,110 ± 110 |
The values are represented as the mean ± SD for 16 mice in each group.
, P < 0.05; †, P < 0.02 vs. nontransgenic mice; ‡, P < 0.05 vs. SAP-1.
Figure 4.
(A) Agarose gel electrophoresis of lipoproteins of nontransgenic and GnT-III transgenic mouse sera. After 18-hr starvation, nontransgenic (indicated as C) and SAP-1 sera were subjected to 0.5% agarose gel electrophoresis, and lipoproteins were detected by Sudan black B staining. The results were reproducible for 8–10 mice in each group. (B) Immunoblot analyses of serum apo-B from nontransgenic and GnT-III transgenic mice. Serum apolipoproteins from nontransgenic (indicated as C), SAP-1, and SAP-2 mice were subjected to 6% SDS/PAGE, followed by immunoblot analyses with anti-mouse apo-B antibodies. Proteins were visualized by Coomassie blue staining. The results were reproducible for 10 mice in each group.
Because apo-B serves as the main transporter of triglyceride from liver to peripheral tissues, the aberrant glycosylation of apo-B may affect apo-B, resulting in a decrease in serum triglycerides and the lipid accumulation in the liver. We next examined the level of apo-B in serum by immunoblotting by using an anti-apo-B antibody. As shown in Fig. 4B, apo-B100 was undetectable in the serum from SAP-1 and SAP-2 in contrast to detectable levels in the nontransgenic mice. No significant changes in the levels of apo-B48 were found among the three groups. These findings suggest that the decrease in serum triglyceride is caused by a specific decrease in apo-B100 in the transgenic mice.
Accumulation of Apo-B with Increased Bisecting-GlcNAc in Hepatocytes from Transgenic Mice.
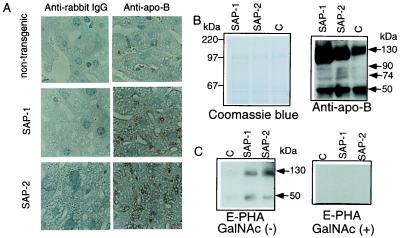
To investigate the fate of apo-B produced by transgenic hepatocytes, hepatocytes from liver sections were examined immunohistochemically by using an antibody to mouse apo-B. As shown in Fig. 5A, apo-B was detected on the margins of lipid droplets in transgenic hepatocytes and was present in higher amounts in SAP-2 than in SAP-1. For evaluation of the bisecting-GlcNAc components of apo-B in hepatocytes, apo-B was immunoprecipitated from transgenic and nontransgenic hepatocyte lysates, and then characterized by blot analysis using apo-B antibodies and E-PHA. Compared with nontransgenic liver lysates, transgenic liver lysates contained higher levels of 130-kDa, 90-kDa, 74-kDa, and 50-kDa apo-B species. Among these apo-B species, 130-kDa and 50-kDa apo-B showed affinity for E-PHA in transgenic hepatocytes, whereas apo-B from nontransgenic hepatocytes showed no affinity for E-PHA. The ratios (%) of bisecting-GlcNAc to immunoreactive apo-B, as determined densitometrically, were as follows: 0.10 ± 0.03, 0.34 ± 0.06* and 0.58 ± 0.10†‡ in 130 kDa and 0.03 ± 0.01, 0.67 ± 0.07† and 0.97 ± 0.08†‡ in 50 kDa for nontransgenic mice (n = 12), SAP-1 (n = 12) and SAP-2 (n = 12), respectively, indicating a significant increase in the amount of bisecting-GlcNAc on apo-B species in transgenic hepatocytes (∗, P < 0.05; †, P < 0.02 vs. nontransgenic; ‡, P < 0.02 vs. SAP-1). The reactivity of immunoprecipitated apo-B to E-PHA was blocked in the presence of an authentic inhibitor, GalNAc (24).
Figure 5.
(A) Immunohistochemical localization of apo-B in GnT-III transgenic hepatocytes. Immunoreactive apo-B was visualized by brown staining mainly in the margin of droplets in the transgenic hepatocytes. The equivalent histology was observed for 10 mice in each group. Magnification: ×200. (B) Characterization of immunoprecipitated apo-B from GnT-III transgenic liver cell lysates. Immunoprecipitated apo-B from liver cell lysates of nontransgenic (indicated as C), SAP-1, and SAP-2 mice were subjected to 8% SDS/PAGE followed by immunoblot (Upper) and lectin blot (Lower) with mouse apo-B antibodies and E-PHA, respectively. On lectin blotting, incubation of membranes with E-PHA was performed either with or without 200 mM GalNAc. The results were reproducible in 12 independent mice for each group.
DISCUSSION
A fatty liver is known to be caused by high levels of fatty acids (e.g., a high-fat diet, starvation, alcohol, etc.), or a metabolic disorder involving lipoprotein synthesis (e.g., choline-deficiency, puromycin, ethionine, orotic acid, etc.) (25). Fatty livers also have been reported in transgenic mice, which express keratin (26) in the liver, and, for this case, the cause has been attributed to a disturbance in bile secretion.
Apo-Bs (apo-B48 and apo-B100) are glycoproteins and play important structural roles in the formation of lipoproteins. In the intestine, apo-B48 (200 kDa) is essential for chylomicron assembly. In the liver, apo-B100 (500 kDa) is required for the assembly and secretion of very low density lipoproteins and low density lipoproteins (27). In the transgenic mice, which show aberrant glycosylation by GnT-III, numerous lipid droplets were observed in hepatocytes, and decreased levels of β-, pre-β-lipoproteins, and triglycerides were observed in the peripheral blood of these animals. As a result of these data we chose to focus on one of the regulatory glycoproteins of lipoproteins, apo-B. In the case of human low density lipoproteins, apo-B contains high mannose N-glycans or biantennary type oligosaccharides (28, 29), but the function of these oligosaccharide chains is not clear. In the transgenic mice, apo-B100 was specifically decreased to undetectable levels in serum. In addition, levels of a low molecular weight immunoreactive apo-B, which exhibited a strong reactivity to E-PHA, were increased in transgenic hepatocytes. This observation strongly suggests that aberrant glycosylation of apo-B because of GnT-III disturbs the assembly of apo-B and causes a decrease in the release of lipoproteins and an accumulation of apo-B in the liver.
In regard to the association of apo-B with tumorgenesis, mice expressing aberrantly truncated apo-B showed lipid accumulation in the liver followed by the development of dysplasia and carcinoma of the liver (30). In general, however, fatty liver is not clinically considered to be a hepatocarcinogenetic factor as is, for example, chronic hepatitis after hepatitis C virus infection. These observations suggest that apo-B has two pathophysiological functions. One is as a transporter of triglycerides, thereby resulting in lipid accumulation in the liver caused by dysfunction of apo-B under pathological conditions. The other may be the factor for hepatocarcinogenesis that may be reactivated by the truncation of apo-B. Our study suggests that GnT-III-catalyzed glycosylation affects the former, but not the latter, resulting in fatty liver generation without development of malignancy in a transgenic liver, which expresses GnT-III.
Phosphatidylcholine and a microsomal triacylglycerol-transfer protein (MTP) have been shown to regulate the secretion of apo-B containing lipoproteins (27). Our study reveals that glycosylation also may be a factor in the regulation of lipoprotein metabolism. The above data are consistent with a scenario in which a specific glycosyltransferase, GnT-III, affects lipid metabolism through the modification of regulatory glycoproteins, such as apo-B, and, thus, could be responsible for certain metabolic abnormalities of hepatocytes. The present study demonstrates a significant abnormality in lipoprotein metabolism in transgenic mice, including lower triglyceride levels, fatty liver generation, and the accumulation of aberrantly glycosylated apo-B. Furthermore, the abnormal phenotypes were significantly more enhanced in SAP-2 than in SAP-1, in correlation to the number and the transcription level of the transgene, as well as the expressed enzyme activity. In contrast, neither nontransgenic mice littermates nor mice with null mutations in GnT-III (31, 32) have abnormal phenotypes that include liver. This finding suggests that the expression of GnT-III is inactivated in the liver as the result of a disturbance in lipid metabolism by GnT-III expression. This report describes a pathological mechanism in which an aberrant N-glycan structure (bisecting-GlcNAc) can modify certain biochemical parameters of lipid metabolism in the liver and contributes to our knowledge of the pathogenesis of fatty liver.
Acknowledgments
We thank Dr. J. Borén (Gladstone Institute) for providing the anti-mouse apo-B antibodies, and Drs. M. Ishigami, S. Yamashita, and Y. Matsuzawa (Osaka University Medical School) for the helpful suggestions. We are also grateful to Drs. M. Tanemura, C.-X. Gao, and Y. Sheng, and Ms. K. Horiguchi for their technical assistance, and Dr. H. Deutsch and Dr. M. S. Feather for editing this manuscript. This work was supported in part by a Grant-in-Aid for Scientific Research on Priority Areas from the Ministry of Education, Science, Sports and Culture, Japan.
ABBREVIATIONS
- GnT
N-acetylglucosaminyltransferase
- GalT
galactosyltransferase
- E-PHA
erythroagglutinating phytohemagglutinin
- apo-B
apolipoprotein B
- SAP
serum amyloid protein
References
- 1.Dwek R A. Science. 1995;269:1234–1235. doi: 10.1126/science.7652569. [DOI] [PubMed] [Google Scholar]
- 2.Schachter H. Biochem Cell Biol. 1985;64:163–181. doi: 10.1139/o86-026. [DOI] [PubMed] [Google Scholar]
- 3.Taniguchi N, Ihara Y. Glycoconjugate J. 1995;12:733–738. doi: 10.1007/BF00731232. [DOI] [PubMed] [Google Scholar]
- 4.Ioffe E, Stanley P. Proc Natl Acad Sci USA. 1994;91:728–732. doi: 10.1073/pnas.91.2.728. [DOI] [PMC free article] [PubMed] [Google Scholar]
- 5.Metzler M, Gertz A, Sarkar M, Schachter H, Schrader J W, Marth J D. EMBO J. 1994;13:2056–2065. doi: 10.1002/j.1460-2075.1994.tb06480.x. [DOI] [PMC free article] [PubMed] [Google Scholar]
- 6.Narasimhan S. J Biol Chem. 1982;257:10235–10242. [PubMed] [Google Scholar]
- 7.Yoshimura M, Nishikawa A, Ihara Y, Taniguchi S, Taniguchi N. Proc Natl Acad Sci USA. 1995;92:8754–8758. doi: 10.1073/pnas.92.19.8754. [DOI] [PMC free article] [PubMed] [Google Scholar]
- 8.Miyoshi E, Ihara Y, Hayashi N, Fusamoto H, Kamada T, Taniguchi N. J Biol Chem. 1995;270:28311–28315. doi: 10.1074/jbc.270.47.28311. [DOI] [PubMed] [Google Scholar]
- 9.Nishikawa A, Gu J, Fujii S, Taniguchi N. Biochim Biophys Acta. 1990;1035:313–318. doi: 10.1016/0304-4165(90)90094-d. [DOI] [PubMed] [Google Scholar]
- 10.Narasimhan S, Schachter H, Rajalakshmi S. J Biol Chem. 1988;263:1273–1281. [PubMed] [Google Scholar]
- 11.Miyoshi E, Nishikawa A, Ihara Y, Gu J, Sugiyama T, Hayashi N, Fusamoto H, Kamada T, Taniguchi N. Cancer Res. 1993;53:3899–3902. [PubMed] [Google Scholar]
- 12.Miyoshi E, Ihara Y, Nishikawa A, Saito H, Uozumi N, Hayashi N, Fusamoto H, Kamada T, Taniguchi N. Hepatology. 1995;22:1847–1855. [PubMed] [Google Scholar]
- 13.Nishikawa A, Ihara Y, Hatakeyama M, Kangawa K, Taniguchi N. J Biol Chem. 1992;267:18199–18204. [PubMed] [Google Scholar]
- 14.Toyonaga T, Hino O, Sugai S, Wakasugi S, Abe K, Shichiri M, Yamamura K. Proc Natl Acad Sci USA. 1994;91:614–618. doi: 10.1073/pnas.91.2.614. [DOI] [PMC free article] [PubMed] [Google Scholar]
- 15.Yamamura K, Kikutani H, Takahashi N, Taga T, Akira S, Kawai K, Fukuchi K, Kumahara Y, Honjyo T, Kishimoto T. J Biochem. 1984;96:357–363. doi: 10.1093/oxfordjournals.jbchem.a134845. [DOI] [PubMed] [Google Scholar]
- 16.Taniguchi N, Nishikawa A, Fujii S, Gu J. Methods Enzymol. 1989;179:397–408. doi: 10.1016/0076-6879(89)79139-4. [DOI] [PubMed] [Google Scholar]
- 17.Nishiura T, Fujii S, Kanayama Y, Nishikawa A, Tomiyama Y, et al. Cancer Res. 1990;50:5345–5350. [PubMed] [Google Scholar]
- 18.Kobata A, Yamashita K. Methods Enzymol. 1989;159:46–54. doi: 10.1016/0076-6879(89)79112-6. [DOI] [PubMed] [Google Scholar]
- 19.Yamashita K, Hitoi A, Kobata A. J Biol Chem. 1983;258:14753–14755. [PubMed] [Google Scholar]
- 20.McCormick S P A, Ng J K, Vénian M, Borén J, Pierotti V, Flynn L M, Grass D S, Connolly A, Young S G. J Biol Chem. 1996;271:11963–11970. doi: 10.1074/jbc.271.20.11963. [DOI] [PubMed] [Google Scholar]
- 21.Okada Y, Spiro R G. J Biol Chem. 1980;255:8865–8872. [PubMed] [Google Scholar]
- 22.Tokugawa K, Oguri S, Takeuchi M. Glycoconjugate J. 1996;13:53–56. [PubMed] [Google Scholar]
- 23.Srinivasan S R, Radhakrishnamurthy B, Berenson G S. Arch Biochem Biophys. 1975;170:334–340. doi: 10.1016/0003-9861(75)90125-3. [DOI] [PubMed] [Google Scholar]
- 24.Serafini-Cessi F, Franceschi C, Sperti S. Biochem J. 1979;183:381–388. doi: 10.1042/bj1830381. [DOI] [PMC free article] [PubMed] [Google Scholar]
- 25.Glickman R M, Sabesin S M. In: The Liver: Biology and Pathobiology. 2nd Ed. Arias I M, Jakoby W B, Popper H, Schachter D, Shafritz D A, editors. New York: Raven; 1988. pp. 331–354. [Google Scholar]
- 26.Albers K M, Davis F E, Parrone T N, Lee E Y, Liu Y, Vore M. J Cell Biol. 1995;128:157–169. doi: 10.1083/jcb.128.1.157. [DOI] [PMC free article] [PubMed] [Google Scholar]
- 27.Yao Z, McLeod R S. Biochim Biophys Acta. 1994;1212:152–166. doi: 10.1016/0005-2760(94)90249-6. [DOI] [PubMed] [Google Scholar]
- 28.Swaminathan N, Aladjem F. Biochemistry. 1976;15:1516–1522. doi: 10.1021/bi00652a024. [DOI] [PubMed] [Google Scholar]
- 29.Taniguchi T, Ishikawa Y, Tsunemitsu M, Fukuzaki H. Arch Biochem Biophys. 1989;273:197–205. doi: 10.1016/0003-9861(89)90179-3. [DOI] [PubMed] [Google Scholar]
- 30.Yamanaka S, Balestra M E, Ferrell L D, Fan J, Arnold K S, Taylor S, Taylor J M, Innerarity T L. Proc Natl Acad Sci USA. 1995;92:8483–8487. doi: 10.1073/pnas.92.18.8483. [DOI] [PMC free article] [PubMed] [Google Scholar]
- 31.Priatel J J, Sarkar M, Schachter H, Marth J D. Glycobiology. 1997;7:45–56. doi: 10.1093/glycob/7.1.45. [DOI] [PubMed] [Google Scholar]
- 32.Bhaumik M, Sundram S, Stanley P. Glycobiology. 1996;6:720. doi: 10.1093/glycob/6.7.695. [DOI] [PubMed] [Google Scholar]


