

Abstract
Purpose
To develop an eye-motion–tracking optical coherence tomographic (OCT) method and assess its effect on image registration and nerve fiber layer (NFL) thickness measurement reproducibility.
Methods
A system capable of tracking common fundus features based on reflectance changes was integrated into a commercial OCT unit (OCT II; Carl Zeiss Meditec, Inc., Dublin, CA) and tested on healthy subjects and patients with glaucoma. Twenty successive peripapillary NFL scans were obtained with tracking and 20 without tracking, for 40 images in each session for each eye. Subjects participated in one session on three different days. Composite OCT scans and composite fundus images were generated for assessment of eye tracking. NFL thickness measurement reproducibility was also assessed.
Results
Seven healthy and nine glaucomatous eyes of 16 subjects were recruited. A qualitative assessment of composite OCT scans and composite fundus images showed little motion artifact or blurring along edges and blood vessels during tracking; however, those structures were less clearly defined when tracking was disengaged. There was no significant reproducibility difference with and without tracking in both intra- and intersession NFL measurement SD calculations in any location. The mean retinal pixel SD was significantly smaller with tracking than without (490.9 ± 19.3 μm vs. 506.4 ± 31.8 μm, P = 0.005, paired t-test).
Conclusions
A retinal-tracking system was successfully developed and integrated into a commercial OCT unit. Tracking OCT improved the consistency of scan registration, but did not influence NFL thickness measurement reproducibility in this small sample study.
Optical coherence tomography (OCT) provides in vivo cross-sectional images of the retina with micrometer scale resolution.1 It is a valuable tool for the assessment of various ocular diseases including glaucoma, macular edema, and macular holes, where accurate and reproducible structural measurements are essential.2–4
In the second-generation commercial OCT (OCT II; Carl Zeiss Meditec, Inc., Dublin, CA), the peripapillary nerve fiber layer (NFL) scan consists of 100 A-scan samples in a circular pattern, and good fixation is necessary. Poor visual acuity can make fixation difficult for patients, and even healthy subjects can experience eye motion artifacts during scanning.5 Eye motion can cause incorrect sampling registration that directly affects the accuracy of measurements, and there is not an effective way to determine whether the actual measurements are obtained exactly in the desired location. When OCT II scans are acquired, a corresponding fundus photograph is recorded after the scan has been taken, showing the retinal placement of the peripapillary scan at the time of the photograph. However, because the photograph is not taken at the exact time the OCT scan is acquired, there is some uncertainty as to the precise sampling location (Fig. 1).
Figure 1.
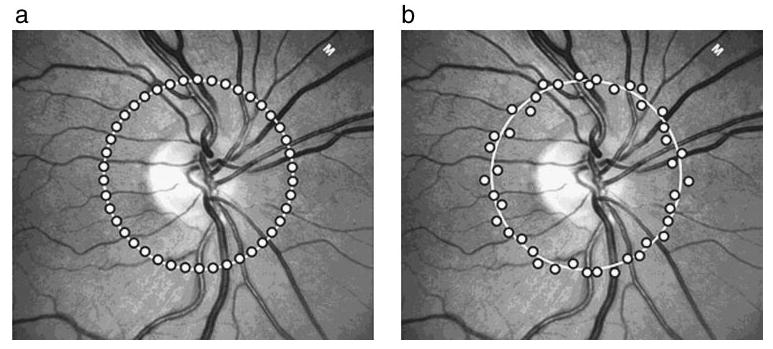
Sampling points with a peripapillary NFL scan. (a) Under ideal conditions when there is no eye movement, sampling points fall directly onto the planned scanning path. (b) In reality, sampling points may scatter around the planned scanning path as a result of eye motion.
There are two logical solutions for the problem of eye motion: (1) rapid scanning so that even very fast eye movements such as saccades have only negligible influence on the acquired image, and (2) eye-motion tracking so that image registration occurs along the designated scanning path. With the current iteration of the commercial OCT system (Stratus-OCT or OCT III; Carl Zeiss Meditec, Dublin, CA), scanning speed and resolution have been improved, but not enough to compensate for most eye movements. There are currently studies to develop the next generation OCT with a novel implementation of frequency domain scanning, which achieves ultrafast scanning speeds.6,7 Because these systems are capable of sampling at higher rates, they may minimize the effect of saccades. However, this cutting-edge technology is still in its experimental and developmental stage.
Alternatively, an eye-motion tracking system can be integrated relatively easily into the existing OCT unit without drastically modifying the original hardware. We hypothesized that eye tracking would help improve measurement reproducibility by stabilizing images and allow for reliable images to be obtained even when fixation is less than perfect and eye motion occurs. The purpose of this study was to assess the effect of an active retinal tracker on OCT image registration and NFL thickness measurement reproducibility.
Methods
Tracking System
A retinal-tracking system that incorporated a tracking beam directly into OCT II was developed in collaboration with Physical Sciences, Inc. (PSI; Andover, MA). This hardware-based eye-motion detection system differs from existing software-based eye trackers in both target and speed.5 Unlike eye trackers that use the anterior segment of the eye, this system targets common fundus features using reflectance. The tracking system has a refresh rate of 1000 samples per second, making it faster than conventional video frame tracking systems that have a refresh rate of only 30 samples per second.5 The higher speed makes it possible to track rapid eye movements, such as drifts, tremors, and saccades, that cannot be properly tracked with other systems.8 However, the system does not compensate for torsional and axial (front–back) motion, as some other systems do.9
This retinal-tracking system was added directly to the existing commercial OCT unit. Within the system were two additional mirrors. Both the tracking and OCT beams passed through these mirrors, which were used to control the optical path of the beams. No changes were made to the original OCT optics. Mirror position was controlled by a separate computer detecting the reflectance signal from a retinal target. The optic nerve head (ONH) region was chosen to be the tracking target for this study because of its areas of high reflectance.5
Although the optical paths of the OCT and retinal-tracking system were combined, the software and user interface for the tracking system were independent from that of the OCT II software. This independence allowed us to use the standard OCT II system software version 2.0 for image acquisition. Other implementations of this tracking system showed an accuracy of <0.05 ° (~15 μm). A complete description of the tracking OCT system can be found elsewhere.5,10
Clinical Trial and Procedure
Healthy and glaucomatous eyes were enrolled in this study. All subjects were enrolled according to the Declaration of Helsinki and provided written informed consent, as approved by the Tufts-New England Medical Center (NEMC) Human Investigation Review Committee. Healthy subjects were recruited from staff at the NEMC and PSI, and subjects with glaucoma were recruited from the patient population at NEMC. Inclusion criteria were best corrected visual acuity of 20/40 or better, refractive error between ±6.0 D, no media opacity, no retinal disease other than those attributed to glaucoma, and a reliable result on 24-2 standard Swedish interactive thresholding algorithm (SITA) visual field test. A reliable SITA was defined by less than 30% fixation losses and false-positive and false-negative responses. Healthy volunteers had a normal ocular examination and a visual field glaucoma hemifield test (GHT) result within normal limits. Patients with glaucoma had a GHT result outside normal limits or an NFL defect detected on biomicroscopic examination.
All subjects had one OCT scanning session per day on three different days within a month. A session was defined as 20 successive NFL peripapillary circular scans with tracking and 20 successive scans without tracking. The order of testing (with or without tracking) was randomized at each visit for each subject.
Analysis Methods
Image averaging to generate a composite image is a widely used analysis technique for improving signal-to-noise ratio and is novel to OCT image registration technology. Speckle noise, which is inherent to OCT scanning, may be reduced with image-averaging analysis.11 Composite OCT images and composite fundus images were created by averaging multiple images scanned at the same location with a software program of our own design. The software was developed in C# (VisualStudio.Net 2003; Microsoft, Redmond, WA).
Composite OCT images were generated by aligning the internal limiting membrane (ILM) of the 20 repeated OCT images from each session that were theoretically on the same scanning plane. The ILM was chosen because of its high reflectivity, which makes it the first prominent A-scan signal peak detected on the vitreous side. Therefore, it is one of the easiest and most reliable features to be detected within the retina.12,13 To create one composite image from the 20 OCT II images obtained in a session, a mean pixel intensity value was calculated for each pixel after alignment. To measure interimage pixel-to-pixel variability, a mean retinal pixel SD was calculated by averaging the variances of intensity values for each pixel between the ILM and retinal pigment epithelium within the set of 20 images.
A fundus image was saved as each OCT II image was collected. Composite fundus images were generated by simply adding the images without aligning them.
To evaluate tracker performance qualitatively, we examined composite OCT images and composite fundus images for accuracy. Accurate tracking was defined as a composite image with crisp edges. Shadowing artifacts created by vessels and other structural edges were used to determine whether the scan registration was consistent. On composite fundus images, blood vessels and structural features of optic nerve head were used for the qualitative assessment.
NFL thickness measurements were also obtained using our proprietary software. NFL segmentation algorithm failure was defined as the appearance of an obvious disruption in the detected NFL borders, and/or borders wandering for more than 5% (consecutive) or 20% (cumulative) of the entire image. Border wandering was recognized as the jumping of the detected border to and from different anatomic structures. Intravisit (within-subject within-date) and intervisit (within-subject between-dates) standard deviations (SDs) as well as intraclass correlation coefficients (ICCs) were calculated to quantify reproducibility. We applied the Bonferroni method to calculate a proper probability cutoff at an α level of 0.05 when we performed multiple comparisons.
Results
Seven healthy and nine glaucomatous eyes of 16 subjects were used for this study. Subjects with glaucoma were older than healthy subjects (mean age, 67.4 ± 13.0 years vs. 38.4 ± 8.2 years, respectively, P < 0.001, t-test).
Examples of both OCT and fundus composite images are shown in Figure 2. A qualitative assessment revealed blurring of the edges of the anatomic structures in both composite OCT and composite fundus images for all subjects without tracking. However, composite OCT tracking images showed much sharper edges in the layered retinal structures and better preserved vessel images with tracking than without, and composite fundus images showed more ONH detail and more clearly defined blood vessels with tracking. Mean retinal pixel SD was significantly smaller with tracking than without (490.9 ± 19.3 μm vs. 506.4 ± 31.8 μm, P = 0.005, paired t-test).
Figure 2.

Comparison of the composite OCT (left) and composite fundus images (right), with and without tracking. Top: single OCT image and corresponding fundus image. Middle: composite OCT and composite fundus images without tracking. In the composite OCT image, although the image is less noisy than the single image and there is noticeable improvement in visualization of the retinal structures, borders of the retinal layers and blood vessel shadows show blurry edges. The composite fundus image also shows a blurring effect at blood vessel edges and optic nerve head structures. Bottom: composite OCT and composite fundus images with tracking. Both composite OCT and composite fundus images show clear and crisp edges of the anatomic features that were blurry without tracking.
Of 1920 images, 1908 (99.4%) were automatically analyzed successfully for NFL thickness, and a total of 288 composite images were generated. NFL analysis failed in a total of 12 images, with and without tracking. These images were excluded from the study. Quantitatively, there was no difference in NFL thickness measurement, with or without tracking, in both healthy and glaucoma subjects (129.3 ± 14.4 μm vs. 128.6 ± 17.0 μm, healthy; 105.8 ± 18.2 μm vs. 104.6 ± 16.9 μm, glaucoma, respectively, both with P > 0.75, Wilcoxon test).
The glaucoma group tended to show greater NFL measurement SDs than did the healthy group in both intra- and inter-session SD calculations but the difference did not reach statistical significance, except for the intersession SD in the temporal quadrant with tracking (P = 0.001; Fig. 3). There was no significant difference between with and without tracking in both intra- and intersession SD calculations in any location. Figure 4 shows that ICCs were higher in healthy subjects in all segments except in the nasal segment, where patients with glaucoma had a higher ICC.
Figure 3.

NFL measurement SDs, with and without tracking. (a) Intrasession and (b) intersession SDs.
Figure 4.

ICCs for NFL measurements, with and without tracking.
Discussion
Tracking OCT improved the consistency of scan registration, as shown by both composite OCT and composite fundus images. Because both tracking and nontracking OCT images were aligned and added, signal-to-noise ratio actually improved for both instances and random speckle noise was suppressed. Although the fundus image that is acquired with OCT II provides a reference as to where the OCT scan path is in relation to the fundus, it is not equivalent to conventional fundus cameras in terms of image quality. However, enough retinal detail is present to provide an indication of the performance of our retinal tracker.
Mean pixel SD is a parameter that quantifies interimage pixel-to-pixel variability. It is an overall assessment of image registration consistency and the stabilization of images with the tracking system. This parameter is commonly used in other devices that create composite images such as the Heidelberg Retina Tomograph (Heidelberg Engineering GmbH, Heidelberg, Germany). That mean pixel SD was significantly minimized with the tracking system turned on indicates that there was less pixel-to-pixel variability with tracking than without. This finding suggests that there was an overall improvement in stabilizing image registration with the tracking system.
Quantitatively, mean NFL thickness was smaller in patients with glaucoma, as expected.4 However, we could not find statistically significant differences in NFL thickness measurements between those obtained with and without tracking, although most of the parameters showed smaller ICCs (hence better reproducibility) with tracking. This result may be due to the small sample size and directions of compensation. The initial design of this study with 16 subjects would have enough power to detect a 3-μm difference with the expected SD of 2.5 μm (α = 0.05). However, the actual difference of ~1 μm was much smaller than the a priori assumption, and there was no statistically significant difference. Also, our tracking system compensated for x and y motions only and did not compensate for torsional motion. There is a possibility that rotational motion affects scan registration and hence NFL thickness measurement reproducibility. Comparing the variability of individual A-scan-to-A-scan measurements as opposed to using overall mean NFL information may provide an alternate method of quantifying image registration consistency. However, because the OCT segmentation algorithm takes into account neighboring A-scan information, this influences the performance of the algorithm, and mean pixel SD is a more favorable method of checking consistency.
Although some limitations were observed, the concept of combining eye tracking with OCT technology should not be abandoned. The peripapillary NFL scan in OCT II consisted of 100 samples, but current commercial OCT samples 256 to 512 points along the circle. This increased sampling allows more A-scans to be acquired for increased transverse scan density, enhancing the ability to discriminate retinal layers. There is clinical potential for an active tracking system, as it permits long and consistent scanning and can therefore make raster scan acquisition possible. It would permit sessions of multiple images to be taken in precise locations, and three-dimensional composite structural maps could then be generated. This would provide improved visualization of retinal layers and structures. Signal averaging techniques demonstrated by Sander et al.11 may further be enhanced with this tracking system. Averaging was shown to enhance retinal images, and a tracking system would stabilize the OCT sampling location so that images can be acquired consistently. In addition, the system is an add-on to existing OCT devices, and drastic changes in OCT technology are not required.
In conclusion, a retinal-tracking system was successfully developed and integrated into a commercial OCT unit. Tracking OCT improved the consistency of scan registration, but did not influence NFL thickness measurement reproducibility in this study.
Acknowledgments
The authors thank James G. Fujimoto, PhD (Department of Electrical Engineering and Computer Science and Research Laboratory of Electronics, Massachusetts Institute of Technology, Cambridge, MA) for invaluable advice and help.
Footnotes
Disclosure: H. Ishikawa, None; M.L. Gabriele, None; G. Wollstein, None; R.D. Ferguson, Physical Sciences Inc. (E, F); D.X. Hammer, Physical Sciences Inc. (E, F); L.A. Paunescu, None; S.A. Beaton, None; J.S. Schuman, Carl Zeiss Meditec, Inc. (F, P)
Supported in part by National Eye Institute Grants R01-EY13178-05, R01-EY11289-16, P30-EY008098, and EY013036; Physical Sciences Inc.; Carl Zeiss Meditec, Inc.; The Eye and Ear Foundation (Pittsburgh); a grant from The Pennsylvania Lions Eye Research Fund, Inc.; and an unrestricted grant from Research to Prevent Blindness, Inc. JSS receives royalties from intellectual property licensed by Massachusetts Institute of Technology to Carl Zeiss Meditec.
References
- 1.Huang D, Swanson EA, Lin CP, et al. Optical coherence tomography. Science. 1991;254:1178–1181. doi: 10.1126/science.1957169. [DOI] [PMC free article] [PubMed] [Google Scholar]
- 2.Puliafito CA, Hee MR, Lin CP, et al. Imaging of macular diseases with optical coherence tomography. Ophthalmology. 1995;102:217–229. doi: 10.1016/s0161-6420(95)31032-9. [DOI] [PubMed] [Google Scholar]
- 3.Bowd C, Zangwill LM, Berry CC, et al. Detecting early glaucoma by assessment of retinal nerve fiber layer thickness and visual function. Invest Ophthalmol Vis Sci. 2001;42:1993–2003. [PubMed] [Google Scholar]
- 4.Schuman JS, Hee MR, Puliafito CA, et al. Quantification of nerve fiber layer thickness in normal and glaucomatous eyes using optical coherence tomography. Arch Ophthalmol. 1995;113:586–596. doi: 10.1001/archopht.1995.01100050054031. [DOI] [PubMed] [Google Scholar]
- 5.Ferguson RD, Hammer DX, Paunescu LA, Beaton S, Schuman JS. Tracking optical coherence tomography. Opt Lett. 2004;29:2139–2141. doi: 10.1364/ol.29.002139. [DOI] [PMC free article] [PubMed] [Google Scholar]
- 6.Wojtkowski M, Leitgeb R, Kowalczyk A, Bajraszewski T, Fercher AF. In vivo human retinal imaging by Fourier domain optical coherence tomography. J Biomed Opt. 2002;7:457–463. doi: 10.1117/1.1482379. [DOI] [PubMed] [Google Scholar]
- 7.Nassif NA, Cense B, Park BH, et al. In vivo high-resolution video-rate spectral-domain optical coherence tomography of the human retina and optic nerve. Opt Express. 2004;12:367–376. doi: 10.1364/opex.12.000367. [DOI] [PubMed] [Google Scholar]
- 8.Schor CM. Neural control of eye movements. In: Kaufman PL, Alm A, editors. Adler’s Physiology of the Eye. 10. St. Louis: Mosby; 2003. pp. 830–858. [Google Scholar]
- 9.Scherer H, Teiwes W, Clarke AH. Measuring three dimensions of eye movement in dynamic situations by means of videooculography. Acta Otolaryngol. 1991;111:182–187. doi: 10.3109/00016489109137372. [DOI] [PubMed] [Google Scholar]
- 10.Hammer DX, Ferguson RD, Magill JC, White MA, Elsner AE, Webb RH. Image stabilization for scanning laser ophthalmoscopy. Opt Express. 2002;10:1542–1549. doi: 10.1364/oe.10.001542. [DOI] [PubMed] [Google Scholar]
- 11.Sander B, Larsen M, Thrane L, Hougaard JL, Jorgensen TM. Enhanced optical coherence tomography imaging by multiple scan averaging. Br J Ophthalmol. 2005;89:207–212. doi: 10.1136/bjo.2004.045989. [DOI] [PMC free article] [PubMed] [Google Scholar]
- 12.Ishikawa H, Piette S, Liebmann JM, Ritch R. Detecting the inner and outer borders of the retinal nerve fiber layer using optical coherence tomography. Graefes Arch Clin Exp Ophthalmol. 2002;240:362–371. doi: 10.1007/s00417-002-0461-3. [DOI] [PubMed] [Google Scholar]
- 13.Ishikawa H, Stein DM, Wollstein G, Beaton S, Fujimoto JG, Schuman JS. Macular segmentation with optical coherence tomography. Invest Ophthalmol Vis Sci. 2005;46:2012–2017. doi: 10.1167/iovs.04-0335. [DOI] [PMC free article] [PubMed] [Google Scholar]