A recent survey of children at primary schools in England found a marked decline in timetabled physical education between 1994 and 1999.1 Sport England expressed concern about the impact of competing priorities, such as numeracy and literacy, on curricular physical education and concluded that children from poorer backgrounds would be worst affected. We used accelerometers to measure the impact of timetabled physical education at school on overall physical activity in children.
Participants, methods, and results
We monitored physical activity during waking hours for seven days using accelerometers (Manufacturing Technology, Fort Walton Beach, FL2) in 215 children (120 boys and 95 girls aged 7.0-10.5 (mean 9.0) years) from three schools with different sporting facilities and opportunity for physical education in the curriculum. School 1, a private preparatory school with some boarding pupils, had extensive facilities and 9.0 hours a week of physical education in the curriculum. School 2, a village school awarded Activemark gold status for its focus on physical activity, offered 2.2 hours of timetabled physical education a week. School 3, an inner city school with limited sporting provision, offered 1.8 hours of physical education a week.
The accelerometer electronically measures clock time, duration and intensity of movement, and is highly reproducible.3 Compliance was defined as complete recordings over at least four school days and one day of the weekend. Parents completed questionnaires assessing their income on a six point scale. We used analysis of variance to compare means between schools. Least significant difference P values are quoted.
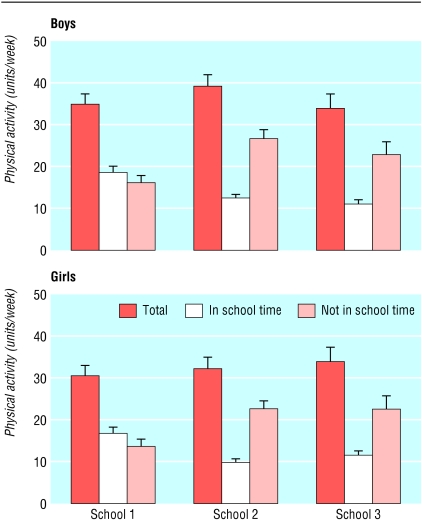
A total of 74% (85 boys and 74 girls) complied with their accelerometers; compliant and non-compliant children did not differ in body mass index (kg/m2) or household income. As expected, pupils in School 1 recorded the most activity in school time but this was barely twice that of pupils in Schools 2 or 3 (both P < 0.001) despite timetabling more than four times the amount of physical education (figure). Surprisingly, total physical activity between schools was similar because children in Schools 2 and 3 did correspondingly more activity out of school than children at School 1 (both P < 0.001). Among the boys, total activity was higher in School 2 than in School 1 and School 3 (both P = 0.02) with mean (standard deviation) units of activity a week of 39.1 (6.8), 34.7 (7.7), and 33.8 (7.8).
Figure 1.
Mean physical activity done by children at three primary schools (error bars show upper limit of 95% confidence interval)
In general, girls did less physical activity a week than boys (32.7 (6.8) v 35.9 (7.7) units; P = 0.007), but their patterns according to school were the same. Mean household incomes were 5.5, 4.3, and 2.7 units in the three schools (all P < 0.001).
Comment
The total amount of physical activity done by primary school children does not depend on how much physical education is timetabled at school because children compensate out of school. This is unexpected, but encouraging, because the amount of timetabled physical education offered in School 1 is unlikely to be bettered elsewhere, and children from School 3 (the poorest) were not adversely affected. Less encouraging is that girls do significantly less physical activity than boys yet are known to have higher insulin resistance and triglyceride levels.4 It may be relevant that more girls than boys develop type 2 diabetes in childhood.
We cannot comment on whether physical activity among primary school children has declined, but we found no evidence that children from poorer backgrounds are adversely affected—they recorded the same overall physical activity as the most privileged children. The survey by Sport England was conducted by questionnaire, and its conclusions differ from ours.1 We will publish data on the intensity of physical activity and metabolic health of the children elsewhere. Our findings need confirmation but give cause for reflection on methods of collecting activity data, the provision of physical education in school, and the competing demands of the school curriculum.
Our study is part of EarlyBird, a 12 year programme investigating childhood factors which lead to diabetes in later life. We thank Claire Snow for collecting and inputting the data and Jonathan Williams for inputting the data.
Contributors: TJW and LDV conceived the study. KMM, TJW, and LDV designed the study. KMM collected and managed the data. KMM, BSM, and JK analysed the data. All authors interpreted the data and wrote the paper. TJW is the guarantor.
Funding: South and Southwest NHS Executive Research and Development.
Competing interests: None declared.
Ethical approval: Plymouth local research ethics committee of the South and West Devon Health Authority.
References
- 1.Rowe N, Champion R. Young people and sport national survey 1999. London: Sport England, 2000.
- 2.Ekelund U, Sjostrom M, Yngve A, Poortvliet E, Nilsson A, Froberg K, et al. Physical activity assessed by activity monitor and doubly labelled water in children. Med Sci Sports Exerc 2001;33: 275-81. [DOI] [PubMed] [Google Scholar]
- 3.Metcalf BS, Curnow JS, Evans C, Voss LD, Wilkin TJ. Technical reliability of the CSA activity monitor (EarlyBird 8). Med Sci Sports Exerc 2002;34: 1533-7. [DOI] [PubMed] [Google Scholar]
- 4.Murphy MJ, Mallam KM, Voss LD, Jeffery AN, Kirkby J, Wilkin TJ. Girls at five are intrinsically more insulin resistant than boys: the programming hypotheses revisited (EarlyBird 6). Pediatrics. In press. [DOI] [PubMed]


