Abstract
Objective: To review 16 years of National Collegiate Athletic Association (NCAA) injury surveillance data for men's baseball and identify potential areas for injury prevention initiatives.
Background: Prevention and management of collegiate baseball injuries may be facilitated through injury research aimed at defining the nature of injuries inherent in the sport. Through the NCAA Injury Surveillance System, 16 years of collegiate baseball data were collected for the academic years 1988–1989 through 2003–2004.
Main Results: College baseball has a relatively low rate of injury compared with other NCAA sports, but 25% of injuries are severe and result in 10+ days of time loss from participation. The rate of injury was 3 times higher in a game situation than in practice (5.78 versus 1.85 injuries per 1000 athlete-exposures [A-Es], rate ratio = 3.1, 95% confidence interval = 3.0, 3.3, P < .01). Practice injury rates were almost twice as high in the preseason as in the regular season (2.97 versus 1.58 per 1000 A-Es, rate ratio = 1.9, 95% confidence interval = 1.8, 2.0, P < .01). A total of 10% of all game injuries occurred from impact with a batted ball, an injury rate of 0.56 injuries per 1000 game A-Es. Sliding was involved in 13% of game injuries.
Recommendations: Proper preseason conditioning is important to reduce injuries. Athletic trainers covering practices and games should be prepared to deal with serious, life-threatening injuries from batted balls and other injury mechanisms. Further study of batted-ball injuries is warranted, and the use of breakaway bases to prevent sliding injuries should be supported in college baseball.
Keywords: athletic injuries, injury prevention, batted-ball injuries, breakaway bases
T he National Collegiate Athletic Association (NCAA) conducted its first men's baseball championship in 1947. In the 1988–1989 academic year, 668 schools were sponsoring varsity men's baseball teams, with approximately 19 670 participants. 1 By 2003–2004, the number of varsity teams had increased 39% to 867, involving 27 262 participants. Participation growth during this time was apparent in all 3 divisions but particularly in Divisions II and III.
SAMPLING AND METHODS
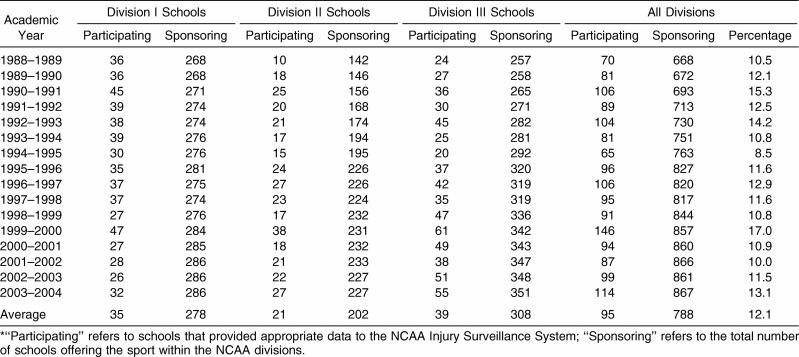
Over the 16-year period from 1988–1989 through 2003– 2004, an average of 12.1% of schools sponsoring varsity men's baseball programs participated in annual NCAA Injury Surveillance System (ISS) data collection ( Table 1). The sampling process, data collection methods, injury and exposure definitions, inclusion criteria, and data analysis methods are described in detail in the “Introduction and Methods” article in this special issue. 2
Table 1. School Participation Frequency (in Total Numbers) by Year and National Collegiate Athletic Association (NCAA) Division, Men's Baseball, 1988–1989 Through 2003–2004*.
RESULTS
Game and Practice Athlete-Exposures
The average annual numbers of games, practices, and athletes participating for each NCAA division, condensed over the study period, are shown in Table 2. Division I averaged 4 more games than Division II and 15 more games than Division III each year, although each division held a similar number of practices. The average number of game and practice participants was similar across divisions.
Table 2. Average Annual Games, Practices, and Athletes Participating by National Collegiate Athletic Association Division per School, Men's Baseball, 1988–1989 Through 2003–2004.
Injury Rate by Activity, Division, and Season
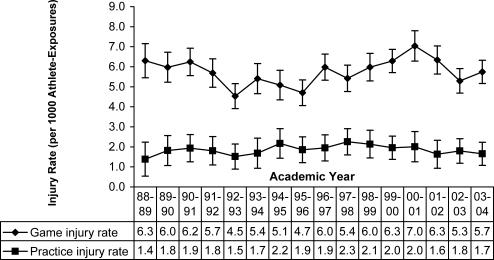
Game and practice injury rates over time, combined across divisions, with 95% confidence intervals (CIs), are displayed in Figure 1. Over the 16 years of the study, the rate of injury was 3 times higher in a game situation than in a practice (5.78 versus 1.85 injuries per 1000 athlete-exposures (A-Es), rate ratio = 3.1, 95% CI = 3.0, 3.3). Analysis of game and practice rates over time indicated no change in either the game injury rate (average annual change = 0.4%; P = .54) or the practice injury rate (average annual change = 0.4%; P = .53).
Figure 1. Injury rates and 95% confidence intervals per 1000 athlete-exposures by games, practices, and academic year, men's baseball, 1988–1989 through 2003–2004 (n = 4453 game injuries and 3893 practice injuries). Game time trend, P = .54. Average annual change = 0.4% (95% confidence interval = −0.8, 1.6). Practice time trend, P = .53. Average annual change = 0.4% (95% confidence interval = −0.9, 1.8) .
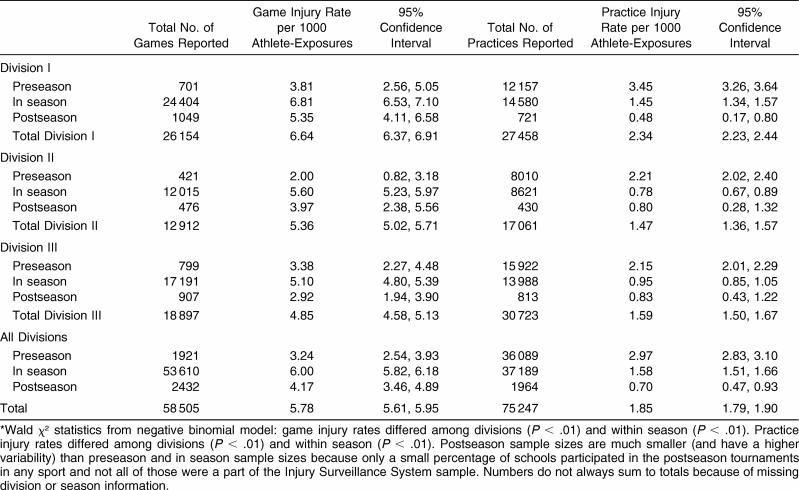
The total number of games and practices and associated injury rates, condensed over years, by division and season (preseason, in season, and postseason) are presented in Table 3. Over the 16-year period, 4453 injuries from more than 58 000 games and 3893 injuries from more than 75 000 practices were reported. Significant differences were noted across divisions ( P < .01), with injury rates in Division I being higher than those in Divisions II and III for games (I versus II: 6.64 versus 5.36 injuries per 1000 A-Es, rate ratio = 1.2, 95% CI = 1.2, 1.3; I versus III: 6.64 versus 4.85 injuries per 1000 A-Es, rate ratio = 1.4, 95% CI = 1.3, 1.5) and practices (I versus II: 2.34 versus 1.47 injuries per 1000 A-Es, rate ratio = 1.6, 95% CI = 1.5, 1.7; I versus III: 2.34 versus 1.59 injuries per 1000 A-Es, rate ratio = 1.5, 95% CI = 1.4, 1.6). Combining divisions, significant differences were seen within season ( P < .01). Practice injury rates were almost twice as high in the preseason as in the regular season (2.97 versus 1.58 injuries per 1000 A-Es, rate ratio = 1.9, 95% CI = 1.8, 2.0), and game injury rates were higher in the regular season than in the postseason (6.00 versus 4.17 per 1000 A-Es, rate ratio = 1.4, 95% CI = 1.2, 1.7).
Table 3. Games and Practices With Associated Injury Rates by National Collegiate Athletics Association Division and Season, Men's Baseball, 1988–1989 Through 2003–2004*.
Body Parts Injured Most Often and Specific Injuries
The frequency of injury to 5 general body parts (head/neck, upper extremity, trunk/back, lower extremity, and other/system) for games and practices, with years and divisions combined, is shown in Table 4. Approximately 45% of all game and practice injuries were to the upper extremity. The second most common body area injured in both activities was the lower extremity, accounting for about one third of injuries.
Table 4. Percentage of Game and Practice Injuries by Major Body Part, Men's Baseball, 1988–1989 Through 2003–2004.
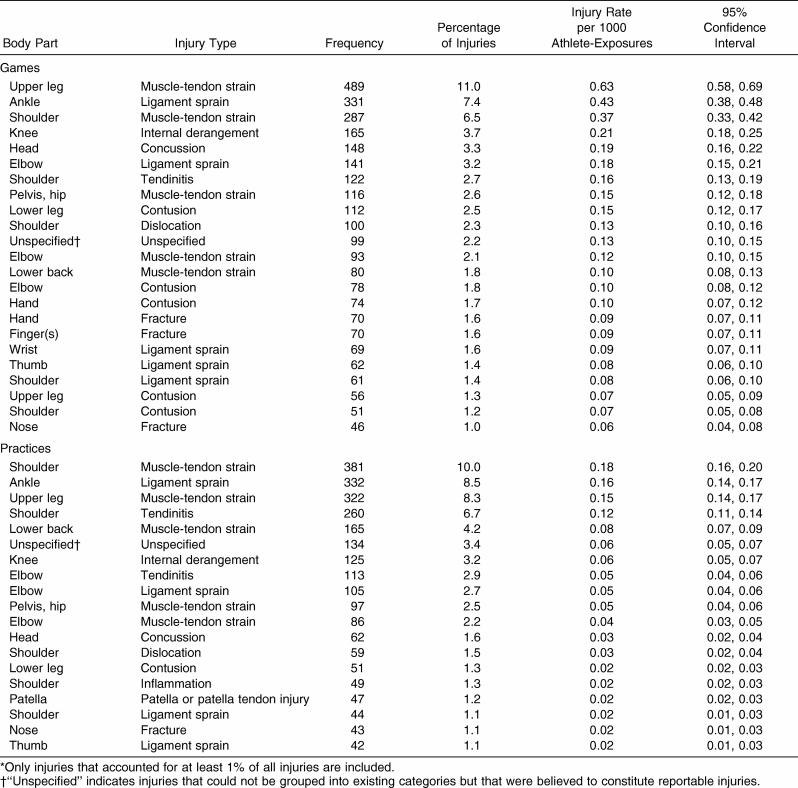
The most common injured body part and injury type combinations for games and practices, with years and divisions combined, are displayed in Table 5; all injuries that accounted for at least 1% of reported injuries over the 16-year sampling period were included. In games, the most frequent injuries were upper leg muscle–tendon strain (11.0%), ankle ligament sprain (7.4%), and shoulder muscle–tendon strain (6.5%). In practice, the most frequent injuries were shoulder muscle–tendon strain (10.0%), ankle ligament sprain (8.5%), and upper leg muscle–tendon strain (8.3%). A participant was twice as likely to sustain a shoulder strain in a game as in a practice (0.37 versus 0.18 injuries per 1000 A-Es, rate ratio = 2.1, 95% CI = 2.0, 2.2), almost 3 times as likely to sustain an ankle-ligament sprain or acute elbow injury (for games: elbow ligament sprain, muscle-tendon sprain, and contusion; for practices: elbow tendinitis, ligament sprain, and muscle-tendon strain) in a game as in a practice (ankle-ligament sprain: 0.43 versus 0.16 injuries per 1000 A-Es, rate ratio = 2.7, 95% CI = 2.6, 2.8; acute elbow injury: 0.40 versus 0.14 injuries per 1000 A-Es, rate ratio = 2.9, 95% CI = 2.7, 3.0), and more than 4 times as likely to sustain an upper-leg muscle-tendon strain in a game as in a practice (0.63 versus 0.15, rate ratio = 4.2, 95% CI = 4.0, 4.4).
Table 5. Most Common Game and Practice Injuries, Men's Baseball, 1988–1989 Through 2003–2004*.
Mechanism of Injury
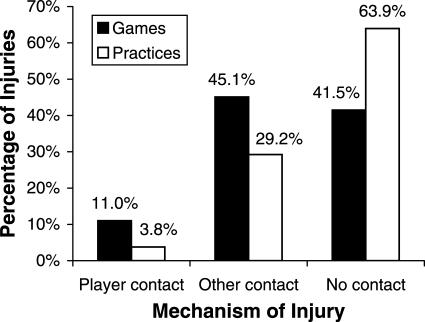
The 3 primary injury mechanisms—player contact, other contact (eg, walls, balls, ground), and no contact—in games and practices with division and years combined are presented in Figure 2. The majority (approximately 45%) of game injuries resulted from contact with something other than a competitor, such as the ground, base, ball, bat, or wall, and another 42% of game injuries were from no-contact mechanisms, such as throwing or pulling a muscle while running. Almost two thirds of practice injuries were associated with no-contact mechanisms.
Figure 2. Game and practice injury mechanisms, all injuries, men's baseball, 1988–1989 through 2003–2004 (n = 4453 game injuries and 3983 practice injuries). “Other contact” refers to contact with items such as walls, balls, or the ground. Injury mechanism was unavailable for 2% of game injuries and 3% of practice injuries.
Severe Injuries: 10+ Days of Activity Time Loss
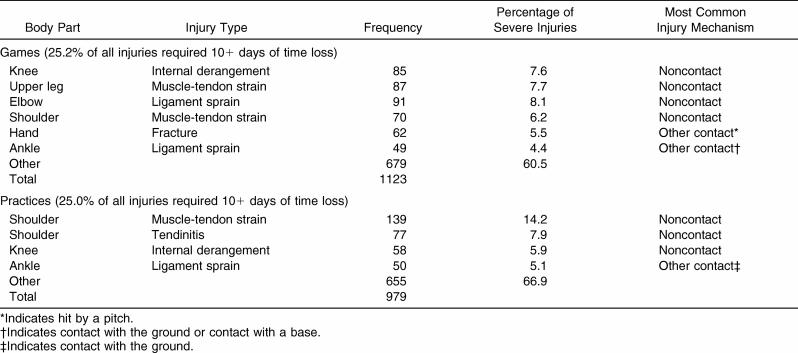
The top injuries that resulted in at least 10 consecutive days of restricted or total loss of participation and their primary injury mechanisms combined across divisions and years are shown in Table 6. For this analysis, time loss of 10+ days was considered a measure of severe injury. One quarter of both game and practice injuries restricted participation for at least 10 days. In games, lower extremity (knee, upper leg, and ankle) sprains and strains accounted for 19.7% of these more-severe injuries, whereas shoulder and elbow injuries accounted for another 14.3%. In practices, shoulder injuries accounted for the majority of severe time loss injuries.
Table 6. Most Common Game and Practice Injuries Resulting in 10+ Days of Activity Time Loss, Men's Baseball, 1988–1989 Through 2003–2004.
Game Injuries
Game positions played at the time of injury are displayed in Figure 3. The batter, baserunner, and pitcher accounted for almost 60% of all game injuries. Game injury mechanisms from 1992–1993 through 2003–2004 are presented in more detail in Figure 4 (this analysis was limited to these years because the baseball injury questions were revised in 1992– 1993). Throwing (pitching) accounted for 15% of all reported game injuries, whereas other nonthrowing, noncontact injuries accounted for 19%. A total of 8% were associated with contact with the base (fixed or breakaway) and approximately 10% of all game injuries involved being hit by a batted ball.
Figure 3. Game player position at time of injury, men's baseball, 1988–1989 through 2003–2004 (n = 4453).
Figure 4. Sport-specific game injury mechanisms, men's baseball, 1992–1993 through 2003–2004 (n = 3428). Readers should be cautious interpreting these data. Some categories are based on small sample sizes, and no rates can be calculated due to lack of exposure data by detailed injury mechanism.
Batted-Ball Impact Injuries in Games
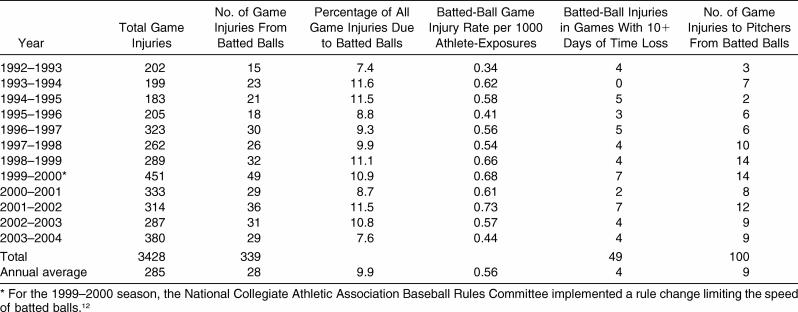
The frequency and rate of impact with batted-ball game injuries from 1992–1993 through 2003–2004 are shown in Table 7. Again, this analysis was limited to these years because specific injury questions regarding impact with a batted ball were added to the system in 1992–1993. On average, 10% of all game injuries were due to impact with a batted ball. The annual injury rate from batted-ball impact was 0.56 and ranged from 0.34 to 0.73 injuries per 1000 game A-Es over these 11 years.
Table 7. Game Injuries From Impact With Batted Balls by Year, Men's Baseball, 1992–1993 Through 2003–2004.
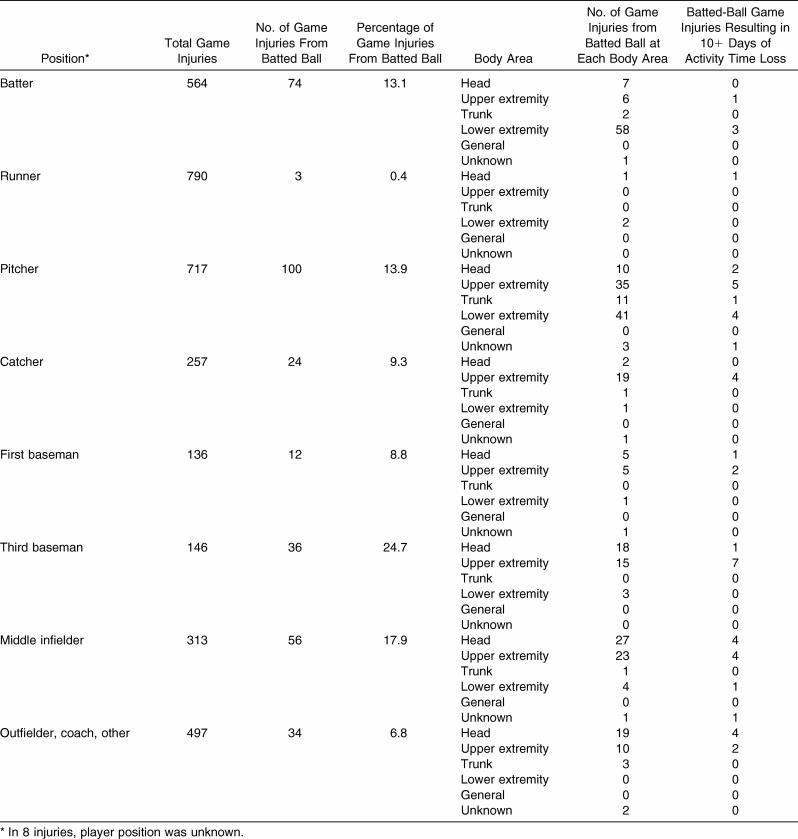
Game injuries from impact with a batted ball by position, body part injured, and severity from 1992–1993 are displayed in Table 8. Approximately 14% (49/339) of batted-ball injuries across all positions restricted participation for 10 or more days. Third basemen (24.7%) and middle infielders (17.9%) had the highest percentage of injuries at their positions resulting from impact with a batted ball, whereas pitchers had the greatest absolute number of injuries (n = 100). Pitchers received 13.9% (100/717) of their injuries from batted balls, with most (in terms of number and severity [10+ days' time loss]) occurring to the lower and upper extremities. Pitcher was the position accounting for most (13/49, 26.5%) of the severe injuries from batted balls.
Table 8. Game Injuries From Impact With Batted Balls by Player Position and Body Area, Men's Baseball, 1992–1993 Through 2003– 2004.
In 1999–2000, the NCAA implemented rule changes regarding bat design that were intended to limit the speed of batted balls (see “Commentary” section for details of the rule changes). We specifically examined the effects of this rule change on the incidence of batted-ball injuries. Injury data were evaluated from 1992–1993 through 1998–1999 and then for 1999–2000 through 2003–2004. The overall injury rate from batted balls has not changed significantly since the rule change was implemented for the 1999–2000 season (1992– 1993 through 1998–1999: injury rate = 0.53 per 1000 A-Es; 1999–2000 through 2003–2004: injury rate = 0.60 per 1000 A-Es; rate difference = 0.07, 95% CI = −0.19, 0.05, P = .24). Pitchers, the group the rule change was primarily aimed at protecting, also did not see a significant change in the rate of injuries since the rule change (1992–1993 through 1998– 1999: injury rate = 0.15 per 1000 A-Es; 1999–2000 through 2003–2004: injury rate = 0.18 per 1000 A-Es; rate difference = −0.03; 95% CI = −0.91, 0.04, P = .44).
COMMENTARY
Injury Incidence
The 16-year injury rates reported for practices (1.85 injuries per 1000 A-Es) and games (5.78 injuries per 1000 A-Es) are very similar to those in previously published studies. McFarland and Wasik 3 noted an overall practice and game injury rate of 5.83 injuries per 1000 A-Es for collegiate baseball players in a single team over 3 seasons of play.
An important finding of this study was the number of injuries resulting in a time loss of 10+ days (25% of all practice and game injuries, Table 6). This finding is supported by data from McFarland and Wasik, 3 who also found, using a more conservative definition of serious injury (≥21 days of time loss), that 25% of injuries in their series were considered severe. Interestingly, they reported that any injury keeping a player out for more than 10 days also kept the player out for more than 21 days.
No fatal injuries were recorded during this 16-year study. However, only 12.1% of schools sponsoring collegiate baseball participated in data collection. As stated earlier in this issue, 2 rare but high-profile events, such as deaths or a well-publicized injury to a star player, may not be included in the database if the school associated with the event was not part of the sample. McFarland and Wasik 3 also reported no fatalities in their 3-year, single-institution study of collegiate baseball injuries. However, Mueller and Cantu 4 from the National Center for Catastrophic Sport Injury Research (NCCSIR) reported 3 fatalities in collegiate baseball players between the fall of 1982 and spring of 2005. Boden et al, 5 examining the same data source between September 1981 and June 2002, noted 4 fatalities in collegiate baseball players. Both studies from the NCCSIR were specifically designed to seek and to identify catastrophic injuries and, therefore, are likely to provide much more accurate representations of the actual number of fatalities associated with collegiate baseball participation.
Boden et al 5 examined 21 years' (1981–2002) worth of nonfatal catastrophic college baseball injury cases accumulated by the NCCSIR and found only 8 cases of direct catastrophic baseball injuries. The NCCSIR defines a catastrophic sports injury as a “sport injury that resulted in a brain or spinal cord injury or skull or spinal fracture,” a serious injury as a severe injury that resulted in no permanent functional disability, a direct injury as one that “resulted directly from participation in the skills of the sport,” and an indirect injury as one “caused by systemic failure as a result of exertion while participating in a sport activity or by a complication which was secondary to a nonfatal injury.” 4 Boden et al 5 calculated that the total direct catastrophic injury rate was 1.7 per 100 000 collegiate baseball players and the total incidence of fatalities was 0.86 per 100 000 collegiate baseball players. A subsequent report by the NCCSIR identified only 3 catastrophic injuries in collegiate baseball players between 1983 and 2005, demonstrating a low risk of such events. (Injuries per 100 000 participants: direct fatalities = 0.57, direct nonfatal injuries = 0.57, direct serious injuries = 0.95, indirect fatalities = 0.40, indirect nonfatal injuries = 0.00, indirect serious injuries = 0.00. 4)
Overall, baseball has a relatively low injury rate compared with other sports. Over the 16-year sample period, baseball demonstrated the lowest practice injury rate (1.8 injuries per 1000 A-Es) 6 and the third lowest game injury rate (5.8 injuries per 1000 A-Es) 7 compared with the other 14 sports for which injury data were collected. Based on previous NCAA reports, the incidence of severe baseball injuries (10+ days lost) compared with other NCAA sports was also relatively low. In 2004–2005, baseball posted the third lowest practice severe injury rate (1.3 injuries per 1000 A-Es) 8 and the fourth lowest game severe injury rate (2.8 injuries per 1000 A-Es). 9 Despite the comparatively low general and severe injury rates reported compared with other sports, the 16-year finding that 25% of all baseball injuries were considered severe (10+ days of time loss) warrants consideration.
Body Region
The injury distribution according to body region reported in the current study ( Table 4) was what one would expect in baseball. Previous authors 3 who combined game and practice injury frequencies by body part reported the greatest number of injuries to the upper extremity (58%), followed by the lower extremity (27%), trunk/back (15%), and head/neck (7%).
The data reported here show that 23.4% and 16.0% of all injuries during practices and games, respectively, were to the shoulder. Previously published college baseball data (combined practices and games) showed that shoulder injuries accounted for 24% of all injuries. 3 During the current study's 16-year reporting period, 1623 shoulder injuries were recorded, of which 972 (59.5%) were associated with throwing. Pitching accounted for 709 (73.0%) of these injuries.
Elbow injuries accounted for 9.3% of game injuries and 10.8% of practice injuries. We report a total of 836 elbow injuries, of which 593 (70.9%) were associated with throwing. A very high percentage of elbow injuries associated with throwing occurred during pitching (n = 465, 78.4%). In their smaller sample of collegiate baseball players, McFarland and Wasik 3 found that 12% of the total injury complaints were related to the elbow and were responsible for 4% of all lost participation time.
The high percentage of injuries to pitchers also has been reported in Major League Baseball. Conte et al 10 studied disability days in Major League Baseball and found that injuries to pitchers represented an average of 48.4% of those on the disabled list and 56.9% of the total disabled-list days. However, shoulder injuries only accounted for an average of 27.8% and elbow injuries accounted for an average of 22% of disabled-list days for all disabled-list reports over a 5-year period. 10 Collectively, these injury data from multiple studies in collegiate and professional baseball players tend to substantiate the clinical experience and observation that most shoulder and elbow injuries are attributed to throwing and most of those injuries are related to pitching.
Games Versus Practices
Injuries were 3 times more likely during games than during practices. Although this analysis does not enable us to determine the exact reason for the difference, we speculate that the overall increased incidence of injuries during games is due to the effect of heightened intensity during competition. During games, players are more likely to play harder and more competitively in order to win. Clinical experience suggests that this will lead to pitchers throwing harder or through pain and players running into walls, diving for balls, colliding with other players, or performing more risky behaviors than during practices. The effects of throwing harder and throwing through pain may be supported by the fact that shoulder injuries were twice as likely and elbow injuries 3 times as likely during games than during practices. Support for increased intensity during base running or when chasing fly balls is found in the fourfold increase in the upper-leg muscle–tendon strain injury rate in games versus practices.
Game injuries were greatest during the regular season compared with the preseason and postseason. This difference is attributed in part to the effect of competition mentioned above; players are simply more likely to “go all out” during an in-season game compared with the preseason. Preseason games are essentially controlled scrimmages. Limits are placed on the pitcher's number of pitches, with an emphasis on building conditioning for the season. Intensity during postseason play is typically believed to be the greatest for athletes. However, athletes participating in postseason play may be more highly skilled and highly conditioned, resulting in a form of natural selection and, thus, a lower injury rate.
An important finding well-supported by clinical experience was that injuries during practices were greatest during the preseason. We attribute this finding primarily to the effects of deconditioning and overload during the preseason. During the preseason, players are often going from little or no practice to long hours on the field. No time restrictions are placed on practices until school starts. Furthermore, many players are trying to make the team in the preseason, and despite deconditioning, they may be playing with greater intensity in order to secure a spot on the roster. Overuse conditions of the upper extremity are observed frequently during the preseason, particularly in pitchers, as players try to build up endurance and power. Over all seasons, shoulder and elbow injuries accounted for more than 30% of practice injuries, and the majority of severe practice injuries were to the shoulders.
Once school starts, team practices, lifting sessions, and games are limited to 20 hours per week. This restriction may help to reduce the incidence of overuse injuries, because players spend fewer hours training. Another potential precursor to increased injury rates during the preseason is the use of spiked shoes, which players must reacclimate to and wear for long periods of time. Lower extremity overuse injuries such as shin splints and anterior knee pain are observed frequently during the preseason.
Two thirds of preseason injuries were noncontact in mechanism, suggesting acute strains or overuse injuries. Proper conditioning and activity progressions during the preseason are critical to preventing injuries. In 2006–2007, the championship season will be restricted to 132 consecutive days, altering the start date of the preseason and thereby effectively limiting the length of time during which games can be played. 11 Historically, many teams have begun practicing in early January, but now baseball practices during the championship season will not be allowed before February 1. 11 This change may have the negative consequence of shortening the preseason for many teams. Considering that the preseason practice injury rate was nearly double that of regular-season practice, a rule change condensing the preseason into a shorter period of time could result in increased preseason and in-season injuries. In addition, games will not be allowed before the last week of February, but the total number of games played will not be reduced. 11 These limitations will result in an increased frequency of games per week. Ultimately, this should result in the same number of game A-Es over a shorter period of time, which may affect recovery time and possibly the number of innings pitched for pitchers. Considering that injuries were 3 times more likely during games than during practices, playing the same number of games in a shorter period of time could result in an increased game injury rate. The effects of this change should be evaluated after an appropriate sample period.
Batted-Ball Impact Injuries
In 1998, the NCAA Baseball Rules Committee recommended a rule change to require a maximum batted-ball exit velocity of 93 miles per hour, plus 1 mile per hour deviation for test variance, for all bats used in NCAA contests. 12 In addition, a recommendation was made “to decrease the maximum allowable diameter from 2-3/4 inches to 2-5/8 inches and the length-to-weight unit differential from 5 to 3, without the grip (a 34-inch-long bat can weigh no less than 31 ounces without the grip).” 12 These recommendations were approved by the NCAA Executive Committee and implemented for the 1999–2000 spring season. 13
Our analysis indicates that the rule change implemented by the NCAA during the 1999–2000 season in an effort to reduce batted-ball speed has not altered the overall injury rate from batted balls or the injury rate to pitchers from batted balls. Overall, injuries from batted balls during games for all positions accounted for an average of approximately 10% of all game injuries ( Table 7). Over the period of data collected prior to the rule change (1992–1993 to 1998–1999), pitchers injured by batted balls accounted for 3% of all games injuries annually. 12 These data are consistent with the current data presented here for the entire study period (1992–1993 through 2003– 2004) in which batted-ball injuries to pitchers still accounted for only 3% of all game injuries (100/3428). Despite this relatively low percentage of batted-ball injuries to overall injuries in pitchers, our analysis ( Table 8) indicates that pitcher was the position that sustained the greatest absolute number of injuries from batted balls (100/339, 29.5%), although third base and middle infielders had a higher percentage of severe batted-ball injuries relative to all injuries at their position. For most positions, including pitchers, the majority of batted-ball and severe batted-ball injuries were to the lower and upper extremities and not to the head. Pitchers had the greatest number of severe batted-ball injuries (13/49, 24.5%) of any position. In a separate study, 5 of a reported 41 catastrophic injuries in high school and college baseball players over 21 years, 14 (34.2%) were pitchers hit by a batted ball and 3 (7.3%) were non-pitchers hit by a batted ball.
Impact injuries to baseball players, including pitchers, from batted balls could have potentially fatal consequences, including commotio cordis (arrhythmia or sudden death from blunt trauma to the chest in the absence of cardiovascular abnormality). 5, 15, 16 Sudden death from batted-ball impact has received significant attention in youth baseball and recreational softball and baseball. 15– 17 Of the 4 fatalities in collegiate baseball players reported by Boden et al, 5 the mechanism and subsequent injury were as follows: (1) collision of fielders, resulting in a head injury (aneurysm); (2) fielder hit by a batted ball, resulting in a head injury (coma); (3) collision of a base runner and fielder, resulting in a cervical fracture (paralysis); and (4) base runner hit by a thrown ball, resulting in commotio cordis. Although small, the risk of catastrophic injuries from batted balls and other injury mechanisms requires that an appropriate emergency action plan, including rapid access to an automated external defibrillator, be in place for all collegiate baseball practices and games. 18
Sliding Injuries
It is not possible to calculate injury rates from sliding from these data because the total number of slides (exposures) was not recorded. However, 345 and 247 injuries (13% of 4453 game injuries) resulted from head-first and feet-first slides, respectively (data not shown). In a separate, prospective analysis 19 of 3 Division I baseball teams, the overall injury rate for sliding was 6.01 per 1000 slides. The game injury rate was greatest for feet-first slides (7.31 per 1000 slides), followed by dive-backs (5.75 per 1000 dive-backs) and head-first slides (3.53 per 1000 slides).
Data from the present study show that contact with stationary bases resulted in 439 injuries, compared with contact with breakaway bases, which resulted in only 40 injuries. These data should be interpreted with caution because we do not know how many game and practice fields were equipped with breakaway bases. Therefore, we are unable to comment on how much the use of breakaway bases affected injury incidence. However, previous literature supports the use of breakaway, or impact, bases for reducing the number of sliding-related injuries in baseball and softball. 20– 24 In a prospective study, Janda et al 24 reported on sliding injuries over 2 seasons using stationary and breakaway bases in 19 collegiate and professional baseball teams. Breakaway bases (468 games played) were used at each participating team's home fields, and stationary bases (498 games played) were used at all away games. When breakaway bases were used, only 0.41 sliding injuries occurred per 100 games, compared with an injury rate of 2.01 sliding injuries per 100 games at sites with stationary bases. This resulted in an 80% ( P < .05) reduction in sliding-related injuries from the use of breakaway bases.
Collegiate baseball rules have been developed to reduce the number of injuries related to sliding. In collegiate baseball, the base runner must slide directly into the base and may not attempt to contact the middle infielders, slide outside the base path, or even slide through the base. 25 Any attempt to do so, as long as the infielder is not in front of the base, results in an automatic double play. 25 In addition to these sliding safety rules, the use of breakaway or impact bases should be promoted in collegiate baseball.
Future Research
A significant area for future researchers in collegiate baseball is in shoulder and elbow injury prevention. Anecdotal reports suggest that screening for glenohumeral internal rotation deficits or scapular malposition or motion abnormalities in throwers may prevent subsequent shoulder and elbow injury. 26, 27 However, prospective studies have not yet been conducted to confirm the importance of these conditions in the eventual development of shoulder and elbow injuries. Ultimately, the ability to assess preseason participation readiness may help to prevent the significant number of injuries that occur as the result of poor conditioning and overuse.
In addition to research aimed at injury prevention, investigation of the long-term health consequences of collegiate baseball participation is needed. Data from professional baseball players suggest that although these former athletes have an increased lifespan, 28, 29 they also suffer from a greater incidence of arthritis and restricted movement associated with injuries sustained during baseball participation. 30 The long-term effects of collegiate baseball injuries on health-related quality of life warrant further study. Finally, further research into the rule changes aimed at reducing batted-ball speed to reduce batted-ball injuries and base-related injuries is needed.
Summary
In conclusion, although collegiate baseball players have a relatively low rate of injury compared with other NCAA sports, approximately 25% of all injuries that occur are severe in terms of time loss. Injuries are much more likely to occur during games; the greatest number of game injuries occur in season, whereas the greatest number of practice injuries occur during the preseason. Proper preseason conditioning to prevent injuries is important to reduce these injuries, particularly throwing injuries in pitchers. Athletic trainers covering practices and games also should be prepared to deal with serious and life-threatening injuries from batted balls and other injury mechanisms. The use of breakaway bases to prevent sliding injuries should be supported in collegiate baseball. Future research into injury screening and prevention, as well as the long-term health consequences of injuries, should be encouraged.
DISCLAIMER
The conclusions in the Commentary section of this article are those of the Commentary authors and do not necessarily represent the views of the National Collegiate Athletic Association.
REFERENCES
- 1981/82–2004/05 NCAA Sports Sponsorship and Participation Rates Report. Indianapolis, IN: National Collegiate Athletic Association; 2006.
- Dick R, Agel J, Marshall SW. National Collegiate Athletic Association Injury Surveillance System commentaries: introduction and methods. J Athl Train. 2007;42:173–182. [PMC free article] [PubMed] [Google Scholar]
- McFarland EG, Wasik M. Epidemiology of collegiate baseball injuries. Clin J Sport Med. 1998;8:10–13. doi: 10.1097/00042752-199801000-00003. [DOI] [PubMed] [Google Scholar]
- Mueller F, Cantu R. National Center for Catastrophic Sport Injury Research: twenty-third annual report, fall of 1982–spring of 2005. Available at: http://www.unc.edu/depts/nccsi/AllSport.htm. Accessed September 6, 2006 .
- Boden BP, Tacchetti R, Mueller FO. Catastrophic injuries in high school and college baseball players. Am J Sports Med. 2004;32:1189–1196. doi: 10.1177/0363546503262161. [DOI] [PubMed] [Google Scholar]
- National Collegiate Athletic Association. Practice injury rates summary (all sports) Available at: http://www1.ncaa.org/membership/ed_outreach/health-safety/iss/GameandPractice_Comparisons/Fig1_2005.pdf. Accessed September 16, 2006 .
- National Collegiate Athletic Association. Game injury rate summary (all sports) Available at: http://www1.ncaa.org/membership/ed_outreach/health-safety/iss/GameandPractice_Comparisons/Fig2_2005.pdf. Accessed September 16, 2006 .
- National Collegiate Athletic Association. Practice injuries resulting in 7+ days of time loss. Available at: http://www1.ncaa.org/membership/ed_outreach/health-safety/iss/GameandPractice_Comparisons/Fig4_2005.pd. Accessed September 16, 2006 .
- National Collegiate Athletic Association. Game injuries resulting in 7+ days of time loss. Available at: http://www1.ncaa.org/membership/ed_outreach/health-safety/iss/GameandPractice_Comparisons/Fig5_2005.pdf. Accessed September 16, 2006 .
- Conte S, Requa RK, Garrick JG. Disability days in Major League Baseball. Am J Sports Med. 2001;29:431–436. doi: 10.1177/03635465010290040801. [DOI] [PubMed] [Google Scholar]
- 2006–2007 National Collegiate Athletic Association Division I Manual. Indianapolis, IN: National Collegiate Athletic Association; 2006.
- Rowe B, Breidenthal T. NCAA committee recommends baseball bat performance standard, new specs for 1999. Available at: http://www.ncaa.org/releases/rules/1998/1998080501ru.htm. Accessed July 27, 2006 .
- Renfro W. NCAA Executive Committee approves bat changes. Available at: http://www.ncaa.org/releases/divi/1998081201d1.htm. Accessed July 27, 2006 .
- Dick R. A discussion of the baseball bat issue related to injury from a batted ball. NCAA News. April 1999:4 .
- Nicholls RL, Elliott BC, Miller K. Impact injuries in baseball: prevalence, aetiology and the role of equipment performance. Sports Med. 2004;34:17–25. doi: 10.2165/00007256-200434010-00003. [DOI] [PubMed] [Google Scholar]
- Janda DH. Blunt impact to the chest and sudden death in young athletes. Clin J Sport Med. 1996;6:68. doi: 10.1097/00042752-199601000-00019. [DOI] [PubMed] [Google Scholar]
- Mueller FO, Marshall SW, Kirby DP. Injuries in Little League Baseball from 1987 through 1996: implications for prevention. Physician Sportsmed. 2001;29(7):41–48. doi: 10.3810/psm.2001.07.874. [DOI] [PubMed] [Google Scholar]
- Andersen JC, Courson RW, Kleiner DM, McLoda TA. National Athletic Trainers' Association position statement: emergency planning in athletics. J Athl Train. 2002;37:99–104. [PMC free article] [PubMed] [Google Scholar]
- Hosey RG, Puffer JC. Baseball and softball sliding injuries: incidence, and the effect of technique in collegiate baseball and softball players. Am J Sports Med. 2000;28:360–363. doi: 10.1177/03635465000280031301. [DOI] [PubMed] [Google Scholar]
- Janda D, Maguire R, Mackesy D, Hawkins R, Fowler P, Boyd J. Sliding injuries in college and professional baseball: a prospective study comparing standard and break-away bases. Clin J Sports Med. 1993;3:78–81. [Google Scholar]
- Sendre RA, Keating TM, Hornak JE, Newitt PA. Use of the Hollywood Impact Base and standard stationary base to reduce sliding and base-running injuries in baseball and softball. Am J Sports Med. 1994;22:450–453. doi: 10.1177/036354659402200403. [DOI] [PubMed] [Google Scholar]
- Janda DH, Wild DE, Hensinger RN. Softball injuries: aetiology and prevention. Sports Med. 1992;13:285–291. doi: 10.2165/00007256-199213040-00005. [DOI] [PubMed] [Google Scholar]
- Janda DH, Bir C, Kedroske B. A comparison of standard vs. breakaway bases: an analysis of a preventative intervention for softball and baseball foot and ankle injuries. Foot Ankle Int. 2001;22:810–816. doi: 10.1177/107110070102201006. [DOI] [PubMed] [Google Scholar]
- Janda DH, Wojtys EM, Hankin FM, Benedict ME. Softball sliding injuries: a prospective study comparing standard and modified bases. JAMA. 1988;259:1848–1850. doi: 10.1001/jama.259.12.1848. [DOI] [PubMed] [Google Scholar]
- National Collegiate Athletic Association. 2006 Baseball Rules and Interpretations. Indianapolis, IN: National Collegiate Athletic Association; 2006.
- Burkhart SS, Morgan CD, Kibler WB. The disabled throwing shoulder: spectrum of pathology, part I. Pathoanatomy and biomechanics. Arthroscopy. 2003;19:404–420. doi: 10.1053/jars.2003.50128. [DOI] [PubMed] [Google Scholar]
- Burkhart SS, Morgan CD, Kibler WB. The disabled throwing shoulder: spectrum of pathology, part III. The SICK scapula, scapular dyskinesis, the kinetic chain, and rehabilitation. Arthroscopy. 2003;19:641–661. doi: 10.1016/s0749-8063(03)00389-x. [DOI] [PubMed] [Google Scholar]
- Abel EL, Kruger ML. Longevity of Major League Baseball players. Res Sports Med. 2005;13:1–5. doi: 10.1080/15438620590922031. [DOI] [PubMed] [Google Scholar]
- Abel EL, Kruger ML. The healthy worker effect in Major League Baseball revisited. Res Sports Med. 2006;14:83–87. doi: 10.1080/15438620500528406. [DOI] [PubMed] [Google Scholar]
- Meir RA, Weatherby RP, Rolfe MI. A preliminary investigation into the long-term injury consequences reported by retired baseball players. J Sci Med Sport. In press . [DOI] [PubMed]


