Abstract
Objective: To review 16 years of National Collegiate Athletic Association (NCAA) injury surveillance data for men's basketball and identify potential areas for injury prevention initiatives.
Background: Collegiate men's basketball is a contact sport in which numerous anatomical structures are susceptible to both acute and overuse injuries. To date, no comprehensive reporting of injury patterns in NCAA men's basketball has been published.
Main Results: The overall rate of injury was 9.9 per 1000 athlete-exposures for games and 4.3 per 1000 athlete-exposures for practices. Approximately 60% of all injuries were to the lower extremity, with ankle ligament sprains being the most common injury overall and knee internal derangements being the most common injury causing athletes to miss more than 10 days of participation. A trend of increasing incidence of injuries to the head and face was noted over the 16-year span of the study, which may be related to an observed increase in physical contact in men's basketball over the past 2 decades.
Recommendations: These results provide the most comprehensive description of injury patterns in NCAA men's basketball to date. Many of the most common injuries seen in men's basketball, such as ankle ligament sprains and knee internal derangements, may be at least partially preventable with interventions such as taping and bracing and neuromuscular training. However, randomized controlled trials assessing the efficacy of such preventive measures among collegiate men's basketball players are clearly lacking. The increase in head and facial injuries may indicate that officials need to assess the increased tolerance for physical contact in men's basketball seen over the past 2 decades.
Keywords: athletic injuries, injury prevention, ankle injuries, knee injuries, head injuries, facial injuries
T he National Collegiate Athletic Association (NCAA) conducted its first men's basketball championship in 1938. In the 1988–1989 academic year, 768 schools were sponsoring varsity men's basketball teams, with a total of 12 203 participants. By 2003–2004, the number of varsity teams had increased 30% to 997, involving 16 028 participants. 1 Participation growth during this time has been apparent in all 3 NCAA divisions but particularly in Divisions II and III.
SAMPLING AND METHODS
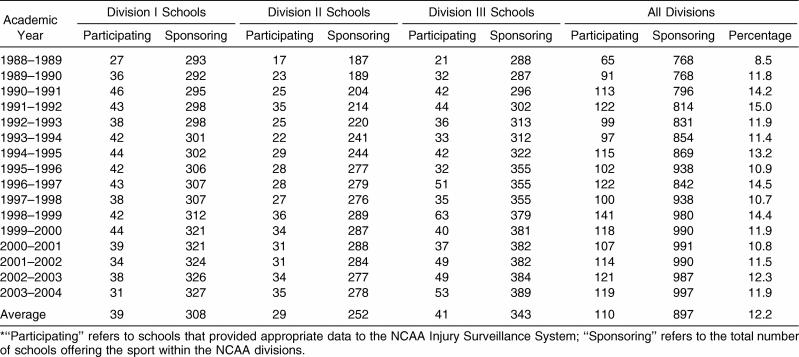
Over the 16-year period from 1988–1989 through 2003– 2004, an average of 12.2% of schools sponsoring varsity men's basketball programs participated in annual NCAA Injury Surveillance System (ISS) data collection ( Table 1). The sampling process, data collection methods, injury and exposure definitions, inclusion criteria, and data analysis methods are described in detail in the “Introduction and Methods” article in this special issue. 2
Table 1. School Participation Frequency (in Total Numbers) by Year and National Collegiate Athletic Association (NCAA) Division, Men's Basketball, 1988–1989 Through 2003–2004*.
RESULTS
Game and Practice Athlete-Exposures
The average annual numbers of games, practices, and athletes participating for each NCAA division, condensed over the study period, are shown in Table 2. Division I averaged 12 more practices than Division II and 21 more than Division III. Division I annually played 1 and 4 more games than Divisions II and III, respectively. Mean numbers of game participants were similar in all divisions; Division III averaged 2 to 3 more practice participants than the other divisions.
Table 2. Average Annual Games, Practices, and Athletes Participating by National Collegiate Athletic Association Division per School, Men's Basketball, 1988–1989 Through 2003–2004.
Injury Rate by Activity, Division, and Season
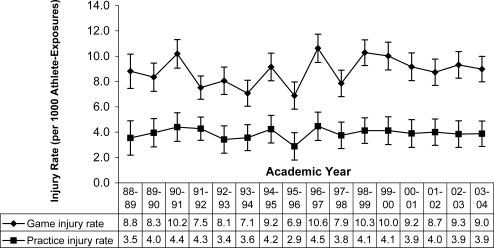
Game and practice injury rates over time combined across divisions with 95% confidence intervals (CIs) are displayed in Figure 1. Over the 16 years of the study, the rate of injury in game situations was 2 times higher than in practices (9.9 versus 4.3 injuries per 1000 athlete-exposures [A-Es], rate ratio = 2.3, 95% CI = 2.2, 2.4). No changes were noted in game rates (0.8%, P = .28) or practice injury rates (0.0%, P = .98) over the sample period.
Figure 1. Injury rates and 95% confidence intervals per 1000 athlete-exposures by games, practices, and academic year, men's basketball, 1988–1989 through 2003–2004 (n = 4211 game and 7833 practice injuries). Game time trend P = .28. Average annual change in game injury rate = −0.8 (95% confidence interval = −0.6, 2.2). Practice time trend P = .98. Average annual change in practice injury rate = 0.0 (95% confidence interval = −1.1, 1.0) .
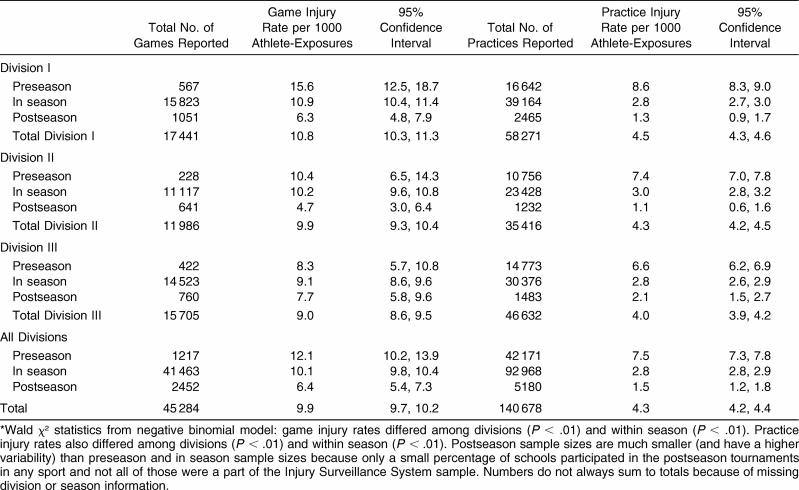
The total numbers of games and practices and associated injury rates, condensed over years, by division and season (preseason, in season, and postseason) are presented in Table 3. Over the 16-year period, 4211 injuries from more than 45 000 games and 7833 injuries from more than 140 000 practices were reported. Game injury rates were significantly higher in Division I than in Division III (10.8 versus 9.0 per 1000 A-Es, rate ratio = 1.2, 95% CI = 1.1, 1.3, P < .01). Across divisions, preseason practice injury rates were almost 3 times higher than in-season practice rates (7.5 versus 2.8 per 1000 A-Es, rate ratio = 2.7, 95% CI = 2.6, 2.8, P < .01), whereas in-season practice injury rates were significantly higher than postseason practice rates (2.8 versus 1.5 per 1000 A-Es, rate ratio = 1.9, 95% CI = 1.5, 2.3, P < .01). In-season game injury rates were significantly higher than postseason rates (10.1 versus 6.4 per 1000 A-Es, rate ratio = 1.6, 95% CI = 1.3, 1.9, P < .01).
Table 3. Games and Practices With Associated Injury Rates by National Collegiate Athletic Association Division and Season, Men's Basketball, 1988–1989 Through 2003–2004*.
Body Parts Injured Most Often and Specific Injuries
The frequency of injury to 5 general body parts (head/neck, upper extremity, trunk/back, lower extremity, and other/system) for games and practices, with years and divisions combined, is shown in Table 4. Approximately 60% of all game and practice injuries were to the lower extremity.
Table 4. Percentage of Game and Practice Injuries by Major Body Part, Men's Basketball, 1988–1989 Through 2003–2004.
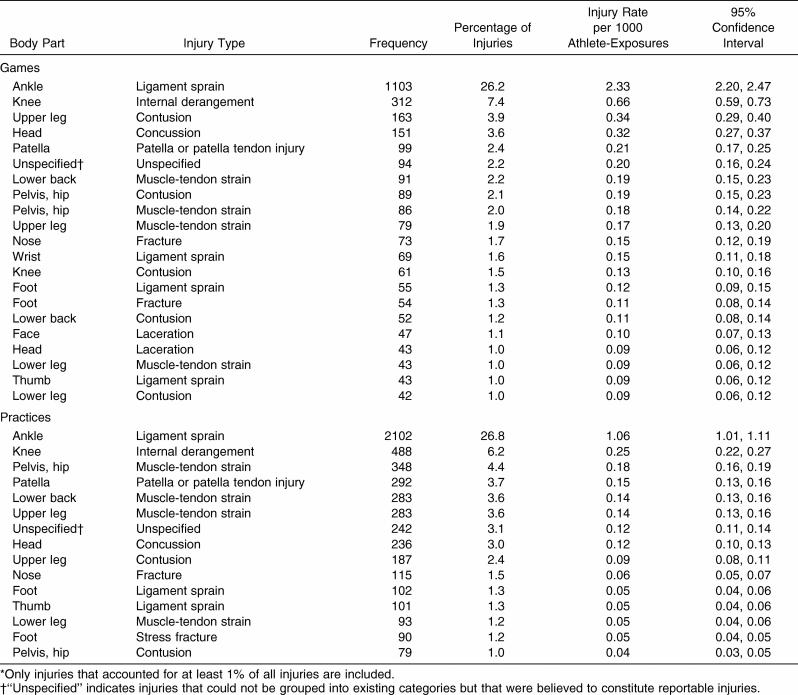
The most common body part and injury type combinations for games and practices, with years and divisions combined, are displayed in Table 5. All injuries that accounted for at least 1% of reported injuries over the 16-year sampling period were included. In games, ankle ligament sprains (26.2%), knee internal derangements (7.4%) and patellar injuries (2.4%), upper leg contusions (3.9%), and concussions (3.6%) accounted for the majority of injuries. In practices, ankle ligament sprains accounted for 26.8% of all reported injuries, and knee internal derangements (6.2%) and patellar injuries (3.7%) together accounted for almost 10% of reported injuries. Concussions represented 3.0% of reported injuries. A participant was more than twice as likely to sustain an ankle ligament sprain or knee internal derangement in a game than in a practice (ankle: 2.33 versus 1.06 injuries per 1000 A-Es, rate ratio = 2.2, 95% CI = 2.1, 2.3; knee: 0.66 versus 0.25 injuries per 1000 A-Es, rate ratio = 2.6, 95% CI = 2.5, 2.7) and almost 3 times as likely to sustain a concussion in a game as in a practice (0.32 versus 0.12 injuries per 1000 A-Es, rate ratio = 2.7, 95% CI = 2.6, 2.8).
Table 5. Most Common Game and Practice Injuries, Men's Basketball, 1988–1989 Through 2003–2004*.
Mechanism of Injury
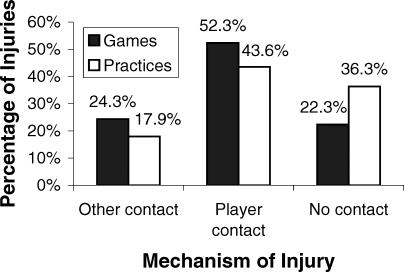
The 3 primary injury mechanisms—player contact, other contact (eg, contact with balls, standards, or the ground), and no contact in games and practices, with divisions and years combined, are presented in Figure 2. Most game (52.3%) and practice (43.6%) injuries resulted from player contact. The remaining game injuries were equally distributed between no contact (22.3%) and other contact (24.3%), whereas no contact was the second highest injury mechanism in practices (36.3%).
Figure 2. Game and practice injury mechanisms, all injuries, men's basketball, 1988–1989 through 2003–2004 (n = 4211 game injuries and 7833 practice injuries). “Other contact” refers to contact with items such as balls, standards, or the ground. Injury mechanism was unavailable for 1% of game injuries and 2% of practice injuries.
Severe Injuries: 10+ Days of Activity Time Loss
The most common injuries that resulted in at least 10 consecutive days of restricted or total loss of participation and their primary injury mechanism, combined across divisions and years, are shown in Table 6. Time loss of 10+ days was, for this analysis, considered a measure of severe injury. Approximately 18% of both game and practice injuries restricted participation for at least 10 days. In both games and practices, lower extremity (knee, ankle, and foot) problems accounted for most of these more severe injuries. Player contact was the most common injury mechanism for severe ankle sprains; severe knee injuries were most frequently associated with no contact.
Table 6. Most Common Game and Practice Injuries Resulting in 10+ Days of Activity Time Loss, Men's Basketball, 1988–1989 Through 2003–2004.
Game Injuries
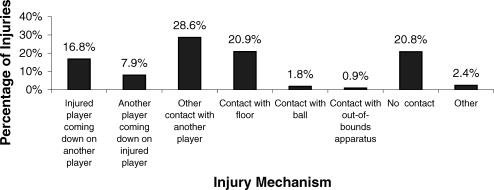
Game injury mechanisms are displayed in more detail in Figure 3. More than 50% of game injuries were associated with player contact. Contact with the floor accounted for 20.9% of game injuries, and there was no apparent contact for 20.8% of game injuries. Very few injuries were associated with contact with the standard or rim or with running into an out-of-bounds apparatus.
Figure 3. Sport-specific game injury mechanisms, men's basketball, 1988–1989 through 2003–2004 (n = 4211).
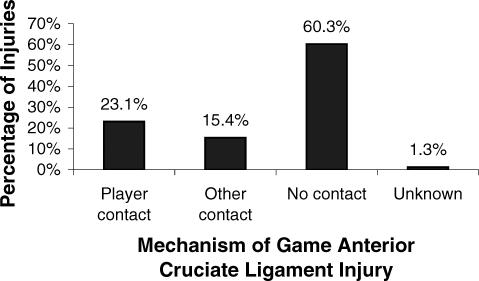
The mechanism of anterior cruciate ligament (ACL) injuries in games over all years is shown in Figure 4. These injuries accounted for 1.8% of all game injuries in men's basketball (0.18 injuries per 1000 A-Es). A total of 60.3% of these injuries occurred from no contact.
Figure 4. Game anterior cruciate ligament injury mechanisms, men's basketball, 1988–1989 through 2003–2004 (n = 78).
Trends in Specific Injuries
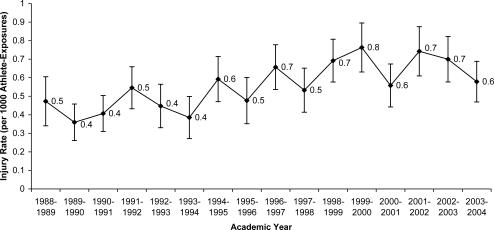
The injury rates by year for head and facial injuries over all years, for games and practices combined, are presented in Figure 5. Injuries to the head and face increased substantially over the course of the study, with an average annual increase of 6.2% ( P < .01).
Figure 5. Game and practice head and facial injuries (including ear, eye, nose, mouth, teeth, tongue, jaw, chin, neck), men's basketball, 1988–1989 through 2003–2004 (n = 1466). Average annual change in injury rate = −6.2%. Time trend P < .01 .
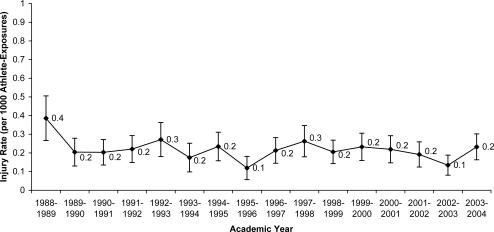
The injury rates by year for overuse injuries of the lower extremities, for games and practices combined, are shown in Figure 6. For the purposes of this analysis, overuse injuries of the lower extremities were considered to include any inflammation, stress fracture, or tendinitis of the knee, patella, lower leg, ankle, heel, or foot. No substantial change in the rate of these injuries was noted over the course of the study, with a nonsignificant average annual decrease of 1.9% ( P = .12).
Figure 6. Game and practice overuse injuries of the lower extremity (any inflammation, stress fracture, or tendinitis of the knee, patella, lower leg, ankle, heel, or foot), men's basketball, 1988–1989 through 2003–2004 (n = 531). Time trend P = .12. Average annual decrease in injury rate = −1.9% .
COMMENTARY
The rate of practice injuries in NCAA men's basketball (4.3 per 1000 A-Es) was similar to that previously reported for Canadian collegiate men's basketball (4.5 per 1000 A-Es; computed from Table 6 of Meeuwisse et al [2003]). 3 However, the incidence of game injuries was considerably higher in the NCAA (9.9 per 1000 A-Es) than in the Canadian collegiate league (6.0 per 1000 A-Es). 3 In contrast, the rate of injuries during professional games in the National Basketball Association was nearly twice that seen in the NCAA (19.3 to 21.4 per 1000 A-Es). 4, 5
Although the number of participants in practices typically includes an entire roster, this is frequently not the case in games. Because practices usually result in a greater number of A-Es than games, the types and intensity of the activities that characterize practices and games must be considered. The speed of some activities during practices may equal that of games, but practices often are composed predominantly of instruction and execution of sport-specific techniques and repetitions of movement patterns and sequences. In other words, much of the activity during practices is orchestrated and predictable. In games, fewer players generally participate, but the activity is usually at a very high level of intensity. This high-intensity physical effort and its associated fatigue, combined with a more unpredictable, competitive environment, may predispose game participants to acute injury compared with practice participants. As such, injuries during games were more likely to be due to player contact or other contact than were injuries occurring during practice.
The majority of the reported injuries sustained in practices and games were soft tissue injuries to the lower extremity and lower back. Because basketball is characterized by sprinting, changes of direction, lateral movement, jumping, and, more importantly, landing, these data are not surprising.
Ankle ligament sprains were the most common injury seen during both practices and games, accounting for more than a quarter of all injuries in both cases. This finding is consistent with previous reports of injury incidence during basketball participation. 3–8 Incurring ankle sprains while playing basketball may be considered de rigueur for elite players, with more than 90% of elite players reporting a history of at least 1 ankle sprain. 9 The incidence of recurrent ankle sprains has been reported to exceed 75% among basketball players at various levels of competition. 9–11 Our data demonstrated a 26% rate of recurrent ankle sprains. In fact, a history of a previous sprain has consistently been shown to be the most common predisposing factor for an athlete sustaining an ankle sprain. 12 Interventions such as prophylactic taping, 13 bracing, 14 and balance training 15 have been shown to be effective in preventing ankle sprains in basketball players, especially among those with previous sprains. However, injury prevention studies of NCAA men's basketball players specifically are clearly lacking.
Although ankle ligament sprains were the most common injury overall, the most frequent injuries resulting in a loss of more than 10 days of participation involved knee internal derangements. These injuries tended to be noncontact in nature. Considerable attention has been paid to the issue of noncontact ACL injuries in female basketball players in the past decade, 16 but the relatively high frequency of these noncontact knee injuries in men's basketball players should not be dismissed. Neuromuscular training programs have been shown to effectively prevent knee injuries in female athletes, 17 and the same interventions may also be beneficial in preventing serious knee injuries in males.
Two interesting trends may indicate how men's basketball evolved over the 16-year study period. The incidence of head and facial injuries increased substantially, whereas the rate of lower extremity overuse injuries remained relatively steady. Dramatic changes in the style of play and the amount of time allowed and required for athletes to train specifically for this sport may help to explain these results.
Our opinion is that men's collegiate basketball has become an increasingly physical contact sport that favors size and strength over finesse. Physical play is difficult to express objectively, but one illustrative trend may be the increase in the number of acute injuries to the head. Simply explained, any injury to the head in basketball is either due to direct contact or occurs subsequent to contact. Direct blows to the head result in concussions, lacerations, fractures, and eye and dental injuries. Usually these injuries are accidental or incidental in nature, but the steady rise (65% more game head injuries in the last 3 seasons of data collection, versus the first 3 seasons) in the number of such injuries indicates that more “accidental” or “incidental” contact is occurring. In fact, over the data collection period, for games and practices combined, 55% more acute injuries affected the head and face than the hand and wrist (631 head or facial injuries versus 404 hand or wrist injuries). This finding is interesting considering that that hand and wrist are “in play” at all times and are integral to participation, whereas the head would not be technically considered “at risk” during basketball play, compared with sports involving airborne implements or collisions.
One increasingly common preventive measure in response to the increase in head and facial injuries is the use of mouthguards by collegiate basketball players. Although mouthguards significantly reduce the incidence of dental injuries, they have not been shown to substantially decrease the risk of concussions. 18 If the increase in head and facial injuries is to be counteracted, a change in rule enforcement by referees may be needed.
Surprisingly, the number of reported overuse lower extremity injuries remained static (nonsignificant decrease) during the data collection period. A total of 29% fewer injuries were classified as inflammation, stress fracture, or tendinitis associated with the lower extremity during the last 3 seasons of data collection, as compared with the first 3 seasons. The number of games allowable in NCAA men's basketball remained relatively consistent over the data collection period. However, the amount of time allowed by the NCAA for coach-supervised basketball activity increased. The collegiate basketball season used to begin in mid October and concluded at the end of March. College basketball coaching staffs were then allowed to supervise up to 8 hours per week of conditioning during the preseason (beginning on the first day of the academic calendar) and postseason (ending at the end of the academic calendar). Beginning in 1995, basketball coaching staffs were allowed to conduct 2 additional hours per week of “individual instruction” with their players during the preseason and postseason. Furthermore, in the late 1980s it was unusual for all members of a basketball team to maintain academic course loads during the summer months, allowing continued on-campus, sport-specific strength training and conditioning. Summer course loads are now commonplace at most Division 1 programs, and, in fact, in 2000 the NCAA passed legislation allowing incoming players (freshmen and transfers) to enroll in school as students during the summer before their first seasons, in effect allowing these young athletes to begin weight training, conditioning, and “open gym/pickup” play with their teammates. Despite the dramatic increase in the time dedicated to basketball-related activities over the past 2 decades, the number of reported overuse injuries has not risen. However, the fact that some overuse injuries do not result in time loss because athletes “play through them” may lead to underreporting in this category.
The increased amount of activity may actually explain why overuse injuries have not risen. The added supervision and physical preparation have likely contributed to injury prevention. Perhaps the added allowable supervised activity in the summer and preseason better prepares players for the physical demands of the season. Preseason practice injury rates (including the period of time from the first allowable regular practice until the first game) are much higher (by an almost threefold measure) than regular-season practice injury rates. This factor may accurately reflect the greater physical demands of preseason practices. The lower injury rate during in-season practices may be attributable to a greater percentage of practice time being devoted to game preparation and execution, with an associated decrease in practice time dedicated to drills and conditioning, during regular-season practices.
The style in which men's collegiate basketball is now played is substantially different than it was in the 1980s. The number of injuries sustained overall in collegiate basketball has not changed appreciably, but the types of injuries are different. Physical contact has become a normal component of college basketball and is the dominant cause of player injury. The rate of overuse injuries now is lower than 20 years ago, despite an increase in the amount of time players dedicate to basketball-specific training and playing. The increase in allowable coaching and individual skill instruction and supervised conditioning during the 16-season data collection period likely contributed to a decrease in the injury rate during practices. Also, we must not ignore the concomitant adaptation of athletic training and sports medicine clinicians to the changing culture of collegiate basketball. Collegiate basketball teams often have a certified athletic trainer at all practices and games, and most collegiate basketball players have year-round access to athletic training services at their schools. It is likely that increased coverage and sport-specific preventive care has contributed to maintaining a low injury rate in a sport that has evolved in a way that would lead many to expect an increase in sport-related injuries.
In conclusion, the majority of injuries incurred by collegiate men's basketball players were to the lower extremity, with ankle ligament sprains being the most common injury overall and noncontact knee injuries being the most common serious injury. We need to study the efficacy of preventive measures, such as ankle taping and bracing and balance and neuromuscular training, in this population. A concerning trend is the increased incidence of head and facial injuries in basketball players. This increase is likely due to the heightened level of physical contact now seen in men's collegiate basketball.
DISCLAIMER
The conclusions in the Commentary section of this article are those of the Commentary authors and do not necessarily represent the views of the National Collegiate Athletic Association.
REFERENCES
- National Collegiate Athletic Association. 1981-82–2004-05 NCAA Sports Sponsorship and Participation Rates Report. Indianapolis, IN: National Collegiate Athletic Association; 2006
- Dick R, Agel J, Marshall SW. National Collegiate Athletic Association Injury Surveillance System commentaries: introduction and methods. J Athl Train. 2007;42:173–182. [PMC free article] [PubMed] [Google Scholar]
- Meeuwisse WH, Sellmer R, Hagel BE. Rates and risks of injury during intercollegiate basketball. Am J Sports Med. 2003;31:379–385. doi: 10.1177/03635465030310030901. [DOI] [PubMed] [Google Scholar]
- Starkey C. Injuries and illnesses in the National Basketball Association: a 10-year perspective. J Athl Train. 2000;35:161–167. [PMC free article] [PubMed] [Google Scholar]
- Deitch JR, Starkey C, Walters SL, Moseley JB. Injury risk in professional basketball players: a comparison of Women's National Basketball Association and National Basketball Association athletes. Am J Sports Med. 2006;34:1077–1083. doi: 10.1177/0363546505285383. [DOI] [PubMed] [Google Scholar]
- Zelisko JA, Noble HB, Porter M. A comparison of men's and women's professional basketball injuries. Am J Sports Med. 1982;10:297–299. doi: 10.1177/036354658201000507. [DOI] [PubMed] [Google Scholar]
- Colliander E, Eriksson E, Herkel M, Skold P. Injuries in Swedish elite basketball. Orthopedics. 1986;9:225–227. doi: 10.3928/0147-7447-19860201-14. [DOI] [PubMed] [Google Scholar]
- Prebble TB, Chyou PH, Wittman L, McCormick J, Collins K, Zoch T. Basketball injuries in a rural area. WMJ. 1999;98:22–24. [PubMed] [Google Scholar]
- Leanderson J, Nemeth G, Eriksson E. Ankle injuries in basketball players. Knee Surg Sports Traumatol Arthrosc. 1993;1:200–202. doi: 10.1007/BF01560206. [DOI] [PubMed] [Google Scholar]
- Smith RW, Reischl SF. Treatment of ankle sprains in young athletes. Am J Sports Med. 1986;14:465–471. doi: 10.1177/036354658601400606. [DOI] [PubMed] [Google Scholar]
- Yeung MS, Chan K, So CH, Yuan WY. An epidemiological survey on ankle sprain. Br J Sports Med. 1994;28:112–116. doi: 10.1136/bjsm.28.2.112. [DOI] [PMC free article] [PubMed] [Google Scholar]
- Beynnon BD, Murphy DF, Alosa DM. Predictive factors for lateral ankle sprains: a literature review. J Athl Train. 2002;37:376–380. [PMC free article] [PubMed] [Google Scholar]
- Garrick JG, Requa RK. Role of external support in the prevention of ankle sprains. Med Sci Sports. 1973;5:200–203. [PubMed] [Google Scholar]
- Sitler M, Ryan J, Wheeler B. The efficacy of a semirigid ankle stabilizer to reduce acute ankle injuries in basketball: a randomized clinical study at West Point. Am J Sports Med. 1994;22:454–461. doi: 10.1177/036354659402200404. et al. [DOI] [PubMed] [Google Scholar]
- McGuine TA, Keene JS. The effect of a balance training program on the risk of ankle sprains in high school athletes. Am J Sports Med. 2006;34:1103–1011. doi: 10.1177/0363546505284191. [DOI] [PubMed] [Google Scholar]
- Agel J, Arendt EA, Bershadsky B. Anterior cruciate ligament injury in National Collegiate Athletic Association basketball and soccer: a 13-year review. Am J Sports Med. 2005;33:524–530. doi: 10.1177/0363546504269937. [DOI] [PubMed] [Google Scholar]
- Hewett TE, Ford KR, Myer GD. Anterior cruciate ligament injuries in female athletes. Part 2. A meta-analysis of neuromuscular interventions aimed at injury prevention. Am J Sports Med. 2006;34:490–498. doi: 10.1177/0363546505282619. [DOI] [PubMed] [Google Scholar]
- Labella CR, Smith BW, Sigurdsson A. Effect of mouthguards on dental injuries and concussions in college basketball. Med Sci Sports Exerc. 2002;34:41–44. doi: 10.1097/00005768-200201000-00007. [DOI] [PubMed] [Google Scholar]


