Abstract
Objective: To review 16 years of National Collegiate Athletic Association (NCAA) injury surveillance data for women's softball and to identify potential areas for injury prevention initiatives.
Background: The NCAA Injury Surveillance System has tracked injuries in all divisions of NCAA softball from the 1988– 1989 to the 2003–2004 seasons. This report describes what was found and why the findings are important for the safety, enhancement, and continued growth of the sport.
Main Results: Across all divisions, preseason practice injury rates were more than double the regular-season practice injury rates (3.65 versus 1.68 injuries per 1000 athlete-exposures, rate ratio = 2.2, 95% confidence interval [CI] = 2.0, 2.4, P < .01). The rate of injury in a game was 1.6 times that in a practice (4.30 versus 2.67 injuries per 1000 athlete-exposures, rate ratio = 1.6, 95% CI = 1.5, 1.7). A total of 51.2% of game injuries resulted from “other-contact” mechanisms, whereas 55% of practice injuries resulted from noncontact mechanisms. In games, ankle ligament sprains and knee internal derangements accounted for 19% of injuries. Twenty-three percent of all game injuries were due to sliding, most of which were ankle sprains. In practices, ankle ligament sprains, quadriceps and hamstring strains, shoulder strains and tendinitis, knee internal derangements, and lower back strains (combined) accounted for 38% of injuries.
Recommendations: Ankle ligament sprains, knee internal derangements, sliding injuries, and overuse shoulder and low back injuries were among the most common conditions in NCAA women's softball. Preventive efforts should focus on sliding technique regardless of skill level, potential equipment changes, neuromuscular training programs, position-specific throwing programs, and mechanisms of low back injury. Further research is needed on the development and effects of these preventive efforts, as well as in the area of windmill-pitching biomechanics.
Keywords: athletic injuries, injury prevention, ankle injuries, knee injuries
T he National Collegiate Athletic Association (NCAA) conducted its first women's fast-pitch softball championship in 1982. In the 1988–1989 academic year, 550 schools were sponsoring varsity softball teams, with 9389 participants. By 2003–2004, the number of varsity teams had increased 65% to 912, involving 16 079 participants. 1 Participation growth during this time was apparent in all 3 divisions but particularly in Division II.
SAMPLING AND METHODS
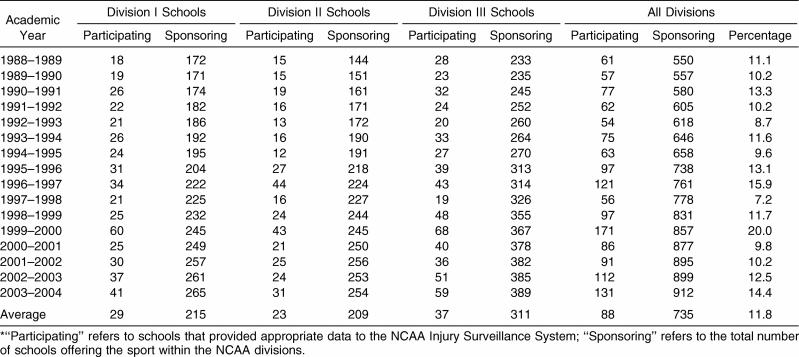
Over the 16-year period from 1988–1989 through 2003– 2004, an average of 11.8% of schools sponsoring varsity fast-pitch softball programs participated in annual NCAA Injury Surveillance System (ISS) data collection ( Table 1). The sampling process, data collection methods, injury and exposure definitions, inclusion criteria, and data analysis methods are described in detail in the “Introduction and Methods” article in this special issue. 2
Table 1. School Participation Frequency (in Total Numbers) by Year and National Collegiate Athletic Association (NCAA) Division, Women's Softball, 1988–1989 Through 2003–2004*.
RESULTS
Game and Practice Athlete-Exposures
The average annual numbers of games, practices, and athletes participating for each NCAA division, condensed over the study period, are shown in Table 2. Division I annually averaged 3 more games than Division II and 16 more games than Division III. Divisions I and II averaged 4 more practices annually than Division III. The practice squad size and game participants were similar across divisions.
Table 2. Average Annual Games, Practices and Athletes Participating by National Collegiate Athletic Association Division per School, Women's Softball, 1988–1989 Through 2003–2004.
Injury Rate by Activity, Division, and Season
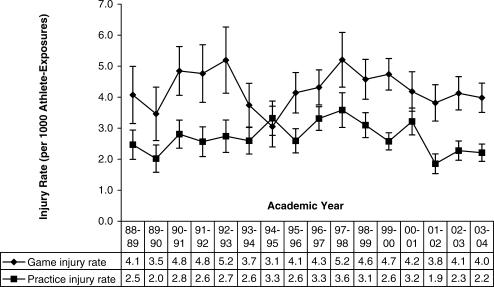
Game and practice injury rates over time, combined across divisions, with 95% confidence intervals (CIs), are displayed in Figure 1. Over the 16 years of the study, the rate of injury was 1.6 times higher in games than in practices (4.3 versus 2.7 injuries per 1000 athlete-exposures [A-Es], rate ratio = 1.6, 95% CI = 1.5, 1.7). Analysis of game and practice rates over time indicated nonsignificant annual decreases in game (−0.2%, P = .74) and practice (−0.8%, P = .43) injury rates.
Figure 1. Injury rates and 95% confidence intervals per 1000 athlete-exposures by games, practices, and academic year, women's softball, 1988–1989 through 2003–2004 (n = 2537 game injuries and 2799 practice injuries). Game time trend P = .74. Average annual change in game injury rate = −0.2% (95% confidence interval = −1.6, 1.2). Practice time trend P = .43. Average annual change in practice injury rate = −0.8% (95% confidence interval = −2.8, 1.2) .
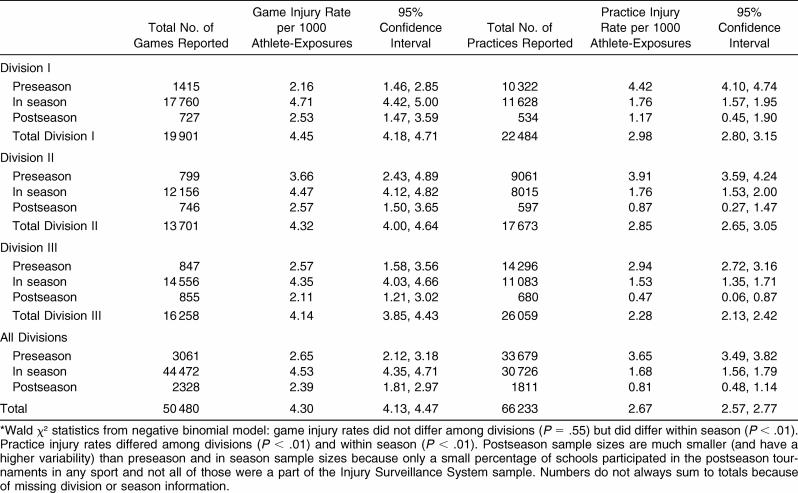
The total number of games and practices and associated injury rates condensed over years by division and season (preseason, in season, and postseason) are presented in Table 3. Over the 16-year period, 2537 injuries from more than 50 000 games and 2799 injuries from more than 66 000 practices were reported. Game injury rates were similar across divisions, but Division I had a higher practice injury rate than Division III (2.98 versus 2.28 injuries per 1000 A-Es, rate ratio = 1.3, 95% CI = 1.3, 1.6, P < .01). Preseason practice rates across divisions were more than double regular-season injury rates (3.65 versus 1.68 injuries per 1000 A-Es, rate ratio = 2.2, 95% CI = 2.0, 2.4, P < .01). In-season game and practice injury rates were higher than postseason game and practice injury rates (games: 4.53 versus 2.39 injuries per 1000 A-Es, rate ratio = 1.9, 95% CI = 1.5, 2.4, P < .01; practices: 1.68 versus 0.81 injuries per 1000 A-Es, rate ratio = 2.1, 95% CI = 1.4, 3.2, P < .01).
Table 3. Games and Practices With Associated Injury Rates by National Collegiate Athletic Association Division and Season, Women's Softball, 1988–1989 Through 2003–2004*.
Body Parts Injured Most Often and Specific Injuries
The frequency of injury to 5 general body parts (head/neck, upper extremity, trunk/back, lower extremity, and other/system) for games and practices, with years and divisions combined, is shown in Table 4. Of all game and practice injuries, approximately 42% were to the lower extremity and 33% to the upper extremity. Of all practice injuries, 12.3% were to the trunk or back, which exceeded the 9.6% that were to the head or neck. During games, this pattern was reversed, with 13.4% of injuries involving the head or neck and 7.2% involving the trunk or back.
Table 4. Percentage of Game and Practice Injuries by Major Body Part, Women's Softball, 1988–1989 Through 2003–2004.
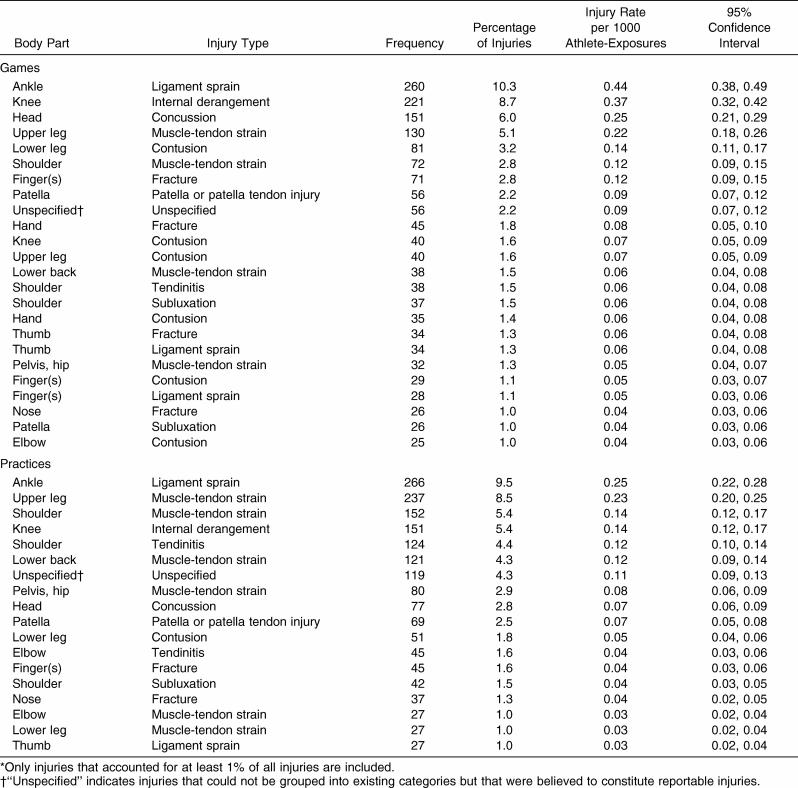
The most common body part and injury type combinations for games and practices with years and divisions combined are displayed in Table 5; all injuries that accounted for at least 1% of reported injuries over the 16-year sampling period are included. In games, ankle ligament sprains and knee internal derangements (combined) accounted for 19.0% of injuries. Concussions accounted for another 6%. Upper leg strains, lower leg contusions, and shoulder strains also were frequent. In practices, ankle ligament sprains, quadriceps and hamstring strains, shoulder strains and tendinitis, knee internal derangements, and low back strains were the leading injuries. In a game versus a practice, a participant was more than 3 times as likely to sustain a concussion (0.25 versus 0.07 injuries per 1000 A-Es, rate ratio = 3.6, 95% CI = 3.4, 3.8), more than twice as likely to sustain a knee internal derangement (0.37 versus 0.14 injuries per 1000 A-Es, rate ratio = 2.6, 95% CI = 2.5, 2.8), and almost twice as likely to sustain an ankle ligament sprain (0.44 versus 0.25 injuries per 1000 A-Es, rate ratio = 1.8, 95% CI = 1.7, 1.9). A participant was equally likely in a game or a practice to sustain a shoulder strain or upper leg strain (shoulder: 0.12 versus 0.14 injuries per 1000 A-Es, rate ratio = 0.9, 95% CI = 0.8, 0.9; upper leg: 0.22 versus 0.23 injuries per 1000 A-Es, rate ratio = 1.0, 95% CI = 0.9, 1.0).
Table 5. Most Common Game and Practice Injuries, Women's Softball, 1988–1989 Through 2003–2004*.
Mechanism of Injury
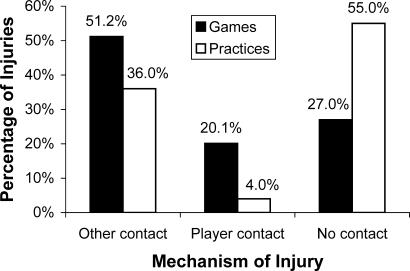
The 3 primary injury mechanisms—player contact, other contact (eg, ball, bases, fence, ground), and no contact—in games and practices with division and years combined are presented in Figure 2. Most game injuries (51.2%) resulted from contact with something other than a competitor, such as the ground, base, ball, or wall, and another 27.0% of game injuries were from no contact, such as throwing or straining a muscle while running. Sliding (under the category of “other contact”) accounted for 23.0% of all game injuries (game injury rate = 0.89 injuries per 1000 A-Es), whereas the rate was much lower in practice (practice injury rate = 0.02 injuries per 1000 A-Es). A total of 55.0% of practice injuries were associated with noncontact mechanisms.
Figure 2. Game and practice injury mechanisms, all injuries, women's softball, 1988–1989 through 2003–2004 (n = 2537 game injuries and 2799 practice injuries). “Other contact” refers to contact with items such as balls, bases, or the ground. Injury mechanism was unavailable for 2% of game injuries and 5% of practice injuries.
Severe Injuries: 10+ Days of Activity Time Loss
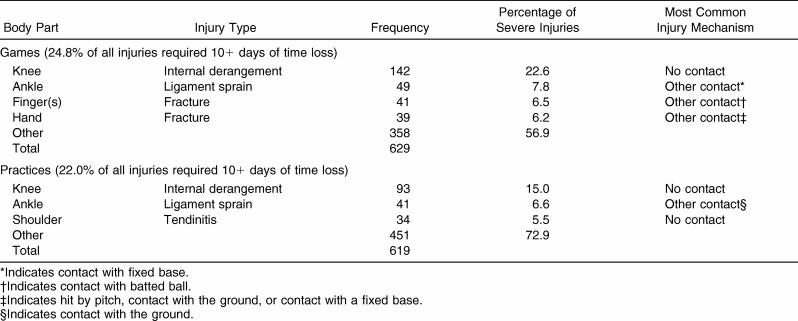
The top injuries that resulted in at least 10 consecutive days of restricted or total loss of participation and their primary injury mechanisms combined across divisions and years are shown in Table 6. For this analysis, time loss of 10+ days was considered a measure of severe injury. More than 22% of both game and practice injuries restricted participation for at least 10 days. In games, knee internal derangements and ankle ligament sprains occurred most frequently, accounting for 30.4% of these more-severe time loss injuries, whereas finger and hand fractures represented another 12.7%.
Table 6. Most Common Game and Practice Injuries Resulting in 10+ Days of Activity Time Loss, Women's Softball, 1988–1989 Through 2003–2004.
Game Injuries
The positions played at the time of injury during games are displayed in Figure 3. The base runner, batter, pitcher, and catcher were the positions with the highest risk of injury. These positions accounted for 62.3% of game injuries.
Figure 3. Game injuries by player position, women's softball, 1988–1989 through 2003–2004 (n = 2537).
Game injury mechanisms are presented in more detail in Figure 4. Player contact accounted for 20.1% of all game injuries, whereas contact with the ground accounted for 13.6% of all injuries. (Note that if an athlete fell due to player contact and sustained a knee abrasion from scraping the ground, the reported injury mechanism would be contact with the ground. 2) Of game injuries, 11.2% involved being hit by a batted ball; throwing (pitching) accounted for another 6.3%. Contact with a base accounted for almost 10% of game injuries, and 43.3% of these injuries were ankle ligament sprains.
Figure 4. Game injury mechanisms in detail, women's softball, 1992–1993 through 2003–2004 (n = 2153).
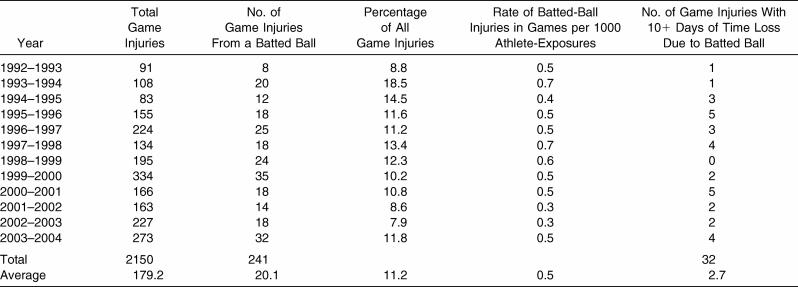
The frequency and rate of game injuries from impact with a batted ball from 1992–1993 through 2003–2004 are shown in Table 7. (The dataset is limited to these years because specific injury questions regarding impact with a batted ball were added to the system in 1992–1993.) On average, 11.2% of all game injuries occurred from impact with a batted ball. A total of 13.2% of batted ball injuries across all positions restricted participation for 10 or more days.
Table 7. Game Injuries From Impact With a Batted Ball, Women's Softball, 1992–1993 Through 2003–2004.
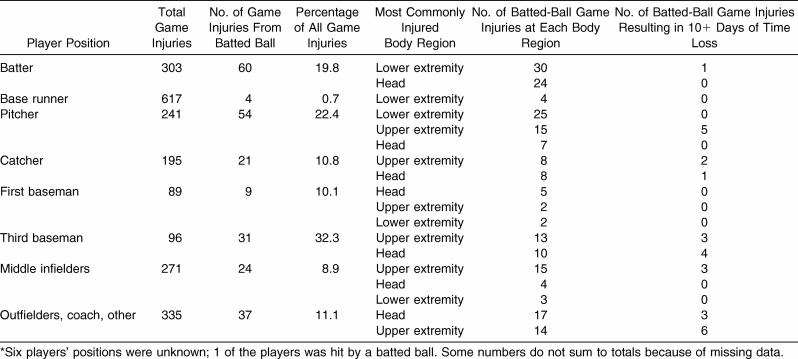
Game injuries from impact with a batted ball by position and injury type from 1992–1993 through 2003–2004 are displayed in Table 8. Batters and pitchers had the highest absolute number of injuries due to impact with a batted ball in games. A total of 22% of the total game injuries to pitchers occurred from batted balls, and about one third of game injuries to third basemen involved batted balls. Only 2.6% (7/241) of injuries to pitchers involved a batted ball to the head, compared with 8% for batters (24/303) and 9% for third basemen (10/96). Four of the 8 head injuries from batted balls that resulted in 10+ days of time loss involved the third baseman.
Table 8. Game Injuries by Position Due to Impact With a Batted Ball, Women's Softball, 1992–1993 Through 2003–2004*.
COMMENTARY
A total of 9% of game injuries occurred due to contact with a fixed base ( Figure 4), and of these, 43.3% resulted in ankle ligament sprains. In addition, 7.8% of all game injuries resulting in 10+ days of activity time loss were ankle ligament sprains, and the most common mechanism of those injuries was contact with a fixed base ( Table 6). Athletes were nearly twice as likely to sustain an ankle ligament sprain in a game as in a practice (0.44 versus 0.25, rate ratio = 1.8). Sliding injuries accounted for 23% of all game injuries (n = 580), and the injury rate for sliding was 0.89 injuries per 1000 A-Es for games but only 0.02 per 1000 A-Es for practices (n = 175). The higher rate of ankle ligament sprains and sliding injuries in games versus practices likely is related to many factors, including hesitation or late decision to slide and an increase in aggressiveness during games versus practices. Feet-first and head-first slides are both common in women's collegiate softball, but feet-first slides are used more often, 3 which may partially explain the incidence of ankle ligament sprains in the current study. In the only study investigating college softball sliding injuries, 3 the authors collected injury incident data during 422 Division I softball games (4756 game-exposures) and 215 Division I baseball games (2840 game-exposures). They reported that softball players employed an average of 3.30 feet-first slides per game and 1.34 head-first slides per game. The sliding injury rate for softball was 12.76 per 1000 slides, which was significantly greater than the sliding injury rate for baseball (6.20 per 1000 slides, P = .02). Most softball injuries due to sliding were contusions (33%) and ankle ligament sprains (19%). 3 The researchers defined injury as “any acute ailment that occurred during a slide in a game situation and that required medical attention or for which medical treatment was deemed necessary by the athletic training staff,” which differs from the definition of injury used in the current study. Although these differences make direct comparisons difficult, the results of that study support the injury trends here. Both the current study and the literature 3 appear consistent with the clinical practice of certified athletic trainers, who likely have observed the injurious effects of sliding, which can lead to extensive treatment, rehabilitation, and/or activity time loss.
Discussions regarding noncontact knee injuries often naturally focus on sports such as soccer and basketball, rather than on women's softball; however, it is important to note the incidence of these injuries in softball. Knee internal derangement accounted for 8.7% of game injuries (31% of which were anterior cruciate ligament [ACL] injuries) and 5.4% of practice injuries (38% of which were ACL injuries) ( Table 5). Notably, noncontact mechanisms resulting in knee internal derangement accounted for the greatest amount of activity time loss ( Table 6). A recent review of the literature highlights the primary extrinsic (physical and visual perturbations, bracing, shoe-surface interaction) and intrinsic (anatomical, hormonal, neuromuscular, and biomechanical differences between the sexes) factors leading to noncontact ACL injuries. 4 A specific investigation into ACL injuries and women's collegiate softball likely would reveal that multiple extrinsic and intrinsic factors contributed to the knee injury rate in the current study and would help to identify which ACL risk factors should be of primary concern in women's collegiate softball.
Upper extremity injuries represented approximately 33% of game and practice injuries ( Table 4). When 8 collegiate softball teams were surveyed during the 1989 NCAA championship tournament, 42% of injuries (11 of 26 injuries) resulted in time loss. 5 Of these injuries, 27% involved overuse of the upper extremity. Upper extremity injuries occurring late in the season may be an indication of the gradual development of overuse injuries during the course of a potential 70-game season. Gradual-onset overuse injuries may be a particular concern for pitchers. When 181 NCAA collegiate softball pitchers across all divisions were surveyed, 70% of reported injuries (92 of the 131 injuries) were categorized as chronic or overuse, with most of these being shoulder and low back injuries. 6 The development of injuries throughout a season is an area in need of further investigation, because a change in injury patterns over the course of the season could necessitate changes in conditioning.
A disparity in practice versus game injury mechanisms is apparent in the results. More than half of all practice injuries were due to noncontact mechanisms, and preseason practices carried the greatest injury risk compared with in-season and postseason practices ( Table 3, Figure 2). The high rate of noncontact and preseason practice injuries may be partially attributable to a lack of appropriate conditioning in the off-season. Research suggests that sport-specific preseason conditioning is important in reducing the incidence of injury during the regular season. 7 Athletes may enter the preseason unprepared for the intensity and frequency of conditioning, practices, and games, as well as the heat and fatigue they may encounter. Certified athletic trainers' clinical experiences treating athletes after their off-season apart from the team support this idea. Also, strain and tendinitis injuries often occur due to noncontact mechanisms, and the findings of this study indicate that these types of injuries occurred more commonly in practices than in games ( Table 5). Furthermore, practices often entail conditioning that might incorporate foot planting and decelerating, which may place athletes in a more vulnerable position for noncontact ACL injury. 4, 8
In contrast to practice injuries, about half of all game injuries occurred due to contact with something other than another person (eg, ball, base, ground), with the highest injury rate occurring during the regular season as opposed to the preseason or postseason ( Table 3, Figure 2). Unlike games, practices often involve developing specific skills at various stations, rehearsing particular game scenarios, conditioning, the use of protective screens, and a less-competitive atmosphere. These factors create a practice environment in which the likelihood of contact with another person or with a base is less than in a game. Aggressive, game-like base running is also less common in practices, which decreases the likelihood of late and hesitant decisions about sliding. Furthermore, rarely is a pitcher pitching at full speed to her teammates, with the infield and outfield completely intact during practice, decreasing the chances of impact from a batted ball. Perhaps these are explanations for why contact injuries, sliding injuries, and concussions are more frequent during games than practices.
These results illuminate areas in need of injury-prevention interventions; one such area is base-related injuries. Breakaway bases may be a means to reduce sliding injuries. Sliding injuries were assessed over the course of 2 consecutive seasons in 19 NCAA and professional minor league baseball teams. 10 Stationary bases were used for 498 games and breakaway bases for 486 games. Ten sliding injuries (7 ankle sprains, 3 knee injuries) occurred using the stationary bases, and 2 sliding injuries (1 shoulder contusion, 1 ankle fracture before reaching the base) occurred using the breakaway bases, translating into 2.01 injuries every 100 games using stationary bases versus 0.41 injuries every 100 games using breakaway bases. The ankle sprains resulted in an average of 12 days of missed activity. A foot-and-leg model equipped with load cells to measure the ankle forces upon horizontal impact has been used to assess the forces generated when contacting a standard base compared with 7 breakaway bases. 11 All 7 breakaway bases significantly reduced ankle forces compared with the standard fixed base. Although breakaway bases appear to be advantageous, implementation of these bases may be hindered by such issues as concerns over use of nontraditional equipment in the sport and insufficient knowledge of safety issues. 12 Minimally, the factors that contribute to sliding injuries, such as poor technique and a late decision or hesitation about sliding, should be addressed consistently in team practices as strategies to reduce sliding injuries.
In addition to sliding injuries, much like other collegiate sports, preventing knee injuries is a concern in women's collegiate softball. It is important to discuss noncontact ACL injuries in relationship to women's softball because of the likelihood that knee internal derangement injuries involve the ACL. A total of 65% of all injuries in these data were noncontact. Noncontact ACL injury often is associated with a planted foot and deceleration, resulting in a valgus knee position due to a combination of motions and rotations at the hip, knee, and ankle that potentially include hip adduction and internal rotation, knee abduction, tibial external rotation and anterior translation, and ankle eversion. 4, 8 This position is common in competitive athletics, including women's softball, but adequate neuromuscular control may provide knee stability without injury. 4 In a recent meta-analysis of neuromuscular ACL interventions, 13 the findings of 6 randomized controlled trials or prospective cohort studies were assessed for effectiveness. The authors concluded that neuromuscular training may reduce ACL injuries in females if the training includes plyometrics, balance, and strengthening exercises performed once per week for at least 6 weeks. 13 Developing preventive neuromuscular training programs specific to softball and research on the effects of the training on ACL injury rates in collegiate softball players may be important areas for future investigation.
Shoulder injuries are another primary area of preventive concern for collegiate softball players. Although the results do not specify the number of shoulder injuries that can be categorized as chronic or overuse, shoulder strains and shoulder tendinitis were common chronic/overuse injuries that accounted for almost 10% of practice injuries ( Table 5). Furthermore, 5.5% of practice injuries resulting in 10+ days of activity time loss were attributable to shoulder tendinitis ( Table 6). A common misconception is that the windmill motion of softball pitching creates less stress on the arm than the overhead motion of baseball pitching does. However, the degree of shoulder distraction stress on elite softball pitchers during the 1996 Olympic Games averaged 80% ± 22% of their body weight (range = 50% to 149%), which is comparable to that of professional baseball players (mean = 108% ± 16% body weight, range = 83% to 139% body weight) and may put softball pitchers at risk for overuse injury. 14, 15 When 181 NCAA female pitchers were surveyed, 25% of their injuries were categorized as chronic/overuse shoulder injuries. 6 Pitch counts need to be more of a priority for coaches, pitchers, and certified athletic trainers, with an emphasis on the quality versus the quantity of pitches during practice. 6 Furthermore, position-specific interval throwing programs have been designed based on NCAA softball game data, field dimensions, common softball injuries, and general tissue-healing concepts. 16 These programs are not only important for rehabilitation but also may be a beneficial component of the conditioning regimens for all position players. 16
Low back strains accounted for 4.3% of practice injuries in the current study ( Table 5). In an investigation of injuries to collegiate softball pitchers, 17% of the chronic/overuse injuries were to the low back. 6 The literature suggests that more attention be directed to identifying risk factors for these injuries, such as investigating the role of the deep abdominal muscles, such as the transversus abdominis and lumbar multifidus, as key spinal stabilizers. 17 The isolated cocontraction of the transversus abdominis and lumbar multifidus is achieved by drawing in the abdominal wall, especially in the lower abdomen, while maintaining a pelvic-neutral posture. 17 Once cocontraction is achieved in a static position, the athlete progresses to maintaining activation of these muscles during functional, sport-specific exercises. 18 Evidence suggests that training of the transversus abdominis and multifidus muscles is beneficial in the treatment of acute and chronic low back conditions. 19, 20 Training and conditioning of the core musculature is common in athletes but often emphasizes the larger muscles (eg, erector spinae, external oblique, rectus abdominis, gluteals) with less focus on the deep stabilizing muscles (eg, transversus abdominis, multifidus). These deep stabilizing muscles may appear intuitively less functional, and the initial difficulty in isolative contraction may make the exercises less desirable, but focusing on these muscles may have a substantial effect on low back stability and risk of injury.
With the popularity and growth of women's softball on both the collegiate and professional levels, the need for more injury-related research is apparent. A focus on sliding technique, no matter the skill level, is important, as is exploration of other avenues for preventing sliding injuries. Perhaps the development of ACL-protective neuromuscular training programs specific to softball will improve knee injury rates in this population. A few authors 15, 21, 22 have analyzed the muscle activation, motion, and forces created during windmill pitching and have suggested that pitchers may be at risk for overuse injury. Additional biomechanical studies such as these, which also take into consideration various types of pitches and the effects of pitch count on injury, would be beneficial in determining the extent of overuse injury, its developmental course, and preventive plans. Similarly, implementing research-based, position-specific interval throwing programs in the preseason and understanding their effects on injury is another area of research that may prove beneficial. Lastly, evaluation of the role of the deep abdominal muscles in the prevention and rehabilitation of low back injury in softball players may be appropriate.
In conclusion, women's softball has experienced tremendous growth over the past 16 seasons; however, the amount of published work on collegiate softball injuries is quite sparse. 3, 5, 6, 23 Although more research is needed, the current results as well as the previous literature highlight some of the more pressing areas of injury concern, provide the foundation for further research, and offer the impetus to advance prevention and rehabilitation strategies.
DISCLAIMER
The conclusions in the Commentary section of this article are those of the Commentary authors and do not necessarily represent the views of the National Collegiate Athletic Association.
REFERENCES
- 1981/82–2004/05 NCAA Sports Sponsorship and Participation Rates Report. Indianapolis, IN: National Collegiate Athletic Association; 2006.
- Dick R, Agel J, Marshall SW. National Collegiate Athletic Association Injury Surveillance System commentaries: introduction and methods. J Athl Train. 2007;42:173–182. [PMC free article] [PubMed] [Google Scholar]
- Hosey RG, Puffer JC. Baseball and softball sliding injuries: incidence, and the effect of technique in collegiate baseball and softball players. Am J Sports Med. 2000;28:360–363. doi: 10.1177/03635465000280031301. [DOI] [PubMed] [Google Scholar]
- Hewett TE, Myer GD, Ford KR. Anterior cruciate ligament injuries in female athletes, part 1: mechanisms and risk factors. Am J Sports Med. 2006;34:299–311. doi: 10.1177/0363546505284183. [DOI] [PubMed] [Google Scholar]
- Loosli AR, Requa RK, Garrick JG, Hanley E. Injuries to pitchers in women's collegiate fast-pitch softball. Am J Sports Med. 1992;20:35–37. doi: 10.1177/036354659202000110. [DOI] [PubMed] [Google Scholar]
- Hill JL, Humphries B, Weidner T, Newton RU. Female collegiate windmill pitchers: influences to injury incidence. J Strength Cond Res. 2004;18:426–431. doi: 10.1519/1533-4287(2004)18<426:FCWPIT>2.0.CO;2. [DOI] [PubMed] [Google Scholar]
- Heidt RS, Jr, Sweeterman LM, Carlonas RL, Traub JA, Tekulve FX. Avoidance of soccer injuries with preseason conditioning. Am J Sports Med. 2000;28:659–662. doi: 10.1177/03635465000280050601. [DOI] [PubMed] [Google Scholar]
- Boden BP, Dean GS, Feagin JA, Jr, Garrett WE., Jr. Mechanisms of anterior cruciate ligament injury. Orthopedics. 2000;23:573–578. doi: 10.3928/0147-7447-20000601-15. [DOI] [PubMed] [Google Scholar]
- Janda DH, Hankin FM, Wojtys EM. Softball injuries: cost, cause and prevention. Am Fam Physician. 1986;33:143–144. [PubMed] [Google Scholar]
- Janda DH, Maguire R, Mackesy D, Hawkins RJ, Fowler P, Boyd J. Sliding injuries in college and professional baseball: a prospective study comparing standard and break-away bases. Clin J Sport Med. 1993;3:78–81. [Google Scholar]
- Janda DH, Bir C, Kedroske B. A comparison of standard vs. breakaway bases: an analysis of a preventative intervention for softball and baseball foot and ankle injuries. Foot Ankle Int. 2001;22:810–816. doi: 10.1177/107110070102201006. [DOI] [PubMed] [Google Scholar]
- Janda DH. The prevention of baseball and softball injuries. Clin Orthop Relat Res. 2003;409:20–28. doi: 10.1097/01.blo.0000057789.10364.e3. [DOI] [PubMed] [Google Scholar]
- Hewett TE, Ford KR, Myer GD. Anterior cruciate ligament injuries in female athletes, part 2: a meta-analysis of neuromuscular interventions aimed at injury prevention. Am J Sports Med. 2006;34:490–498. doi: 10.1177/0363546505282619. [DOI] [PubMed] [Google Scholar]
- Werner SL, Gill TJ, Murray TA, Cook TD, Hawkins RJ. Relationships between throwing mechanics and shoulder distraction in professional baseball pitchers. Am J Sports Med. 2001;29:354–358. doi: 10.1177/03635465010290031701. [DOI] [PubMed] [Google Scholar]
- Werner SL, Jones DG, Guido JA, Jr, Brunet ME. Kinematics and kinetics of elite windmill softball pitching. Am J Sports Med. 2006;34:597–603. doi: 10.1177/0363546505281796. [DOI] [PubMed] [Google Scholar]
- Axe MJ, Windley TC, Snyder-Mackler L. Data-based interval throwing programs for collegiate softball players. J Athl Train. 2002;37:194–203. [PMC free article] [PubMed] [Google Scholar]
- Richardson CA, Jull GA. Muscle control-pain control: what exercises would you prescribe? Man Ther. 1995;1:2–10. doi: 10.1054/math.1995.0243. [DOI] [PubMed] [Google Scholar]
- Fredericson M, Moore T. Muscular balance, core stability, and injury prevention for middle- and long-distance runners. Phys Med Rehabil Clin N Am. 2005;16:669–689. doi: 10.1016/j.pmr.2005.03.001. [DOI] [PubMed] [Google Scholar]
- O'Sullivan PB, Phyty GD, Twomey LT, Allison GT. Evaluation of specific stabilizing exercise in the treatment of chronic low back pain with radiologic diagnosis of spondylolysis or spondylolisthesis. Spine. 1997;22:2959–2967. doi: 10.1097/00007632-199712150-00020. [DOI] [PubMed] [Google Scholar]
- Hides JA, Richardson CA, Jull GA. Multifidus muscle recovery is not automatic after resolution of acute, first-episode low back pain. Spine. 1996;21:2763–2769. doi: 10.1097/00007632-199612010-00011. [DOI] [PubMed] [Google Scholar]
- Barrentine SW, Fleisig GS, Whiteside JA, Escamilla RF, Andrews JR. Biomechanics of windmill softball pitching with implications about injury mechanisms at the shoulder and elbow. J Orthop Sports Phys Ther. 1998;28:405–415. doi: 10.2519/jospt.1998.28.6.405. [DOI] [PubMed] [Google Scholar]
- Werner SL, Guido JA, McNeice RP, Richardson JL, Delude NA, Stewart GW. Biomechanics of youth windmill softball pitching. Am J Sports Med. 2005;33:552–560. doi: 10.1177/0363546504269253. [DOI] [PubMed] [Google Scholar]
- Clarke KS, Buckley WE. Women's injuries in collegiate sports: a preliminary comparative overview of three seasons. Am J Sports Med. 1980;8:187–191. doi: 10.1177/036354658000800308. [DOI] [PubMed] [Google Scholar]


