Abstract
Objective: To review 16 years of National Collegiate Athletic Association (NCAA) injury surveillance data for men's football and identify potential areas for injury prevention initiatives.
Background: Football is a high-velocity collision sport in which injuries are expected. Football tends to have one of the highest injury rates in sports. Epidemiologic data helps certified athletic trainers and other clinicians identify injury trends and patterns to appropriately design and institute injury prevention protocols and then measure their effects.
Main Results: During the 16-year reporting period, about 19% of the Division I, II, and III NCAA institutions sponsoring football participated in the Injury Surveillance System. The results from the 16-year study period show little variation in the injury rates over time: games averaged 36 injuries per 1000 athlete-exposures (A-Es); fall practice, approximately 4 injuries per 1000 A-Es; and spring practice, about 10 injuries per 1000 A-Es. The game injury rate was more than 9 times higher than the in-season practice injury rate (35.90 versus 3.80 injuries per 1000 A-Es, rate ratio = 9.1, 95% confidence interval = 9.0, 9.2), and the spring practice injury rate was more than 2 times higher than the fall practice injury rate (9.62 versus 3.80 injuries per 1000 A-Es, rate ratio = 2.5, 95% confidence interval = 2.5, 2.6). The rate ratio for games versus fall practices was greatest for upper leg contusions (18.1 per 1000 A-Es), acromioclavicular joint sprains (14.0 per 1000 A-Es), knee internal derangements (13.4 per 1000 A-Es), ankle ligament sprains (12.0 per 1000 A-Es), and concussions (11.1 per 1000 A-Es).
Recommendations: Football is a complex sport that requires a range of skills performed by athletes with a wide variety of body shapes and types. Injury risks are greatest during games. Thus, injury prevention measures should focus on position-specific activities to reduce the injury rate. As equipment technology improves for the helmet, shoulder pads, and other protective devices, appropriate injury surveillance procedures should be performed to determine the effect of the new equipment on injury rates. A consistent evaluation of injury trends and patterns will assist decision makers in designing injury prevention techniques in areas that warrant the greatest attention and suggesting rule changes and modifications based on the data.
Keywords: athletic injuries, injury prevention, concussions, knee injuries, ankle injuries, heat illness
T he game of football has been played competitively at the collegiate level in the United States for more than 100 years. In fact, it was safety concerns about the early game of football, and its notorious “flying wedge” formation, that led to the establishment of the National Collegiate Athletic Association (NCAA) during the first decade of the 20th century. At the urging of President Theodore Roosevelt, colleges banded together with the goal of reforming football to limit the injuries (and fatalities) in the young sport.
The NCAA conducted its first football championship in 1978. In the 1988–1989 academic year, 524 schools were sponsoring varsity football teams, with approximately 47 942 participants. By 2003–2004, the number of varsity teams had increased 18% to 621, involving 59 980 participants. 1 Participation growth during this time was apparent in all 3 divisions but particularly in Divisions I and II. In addition to traditional practice sessions during the fall, the NCAA also sanctions a short spring practice season for Divisions I and II. Spring football is a maximum 15-day, formal, off-season team practice. No official competitive games are played in the spring season.
SAMPLING AND METHODS
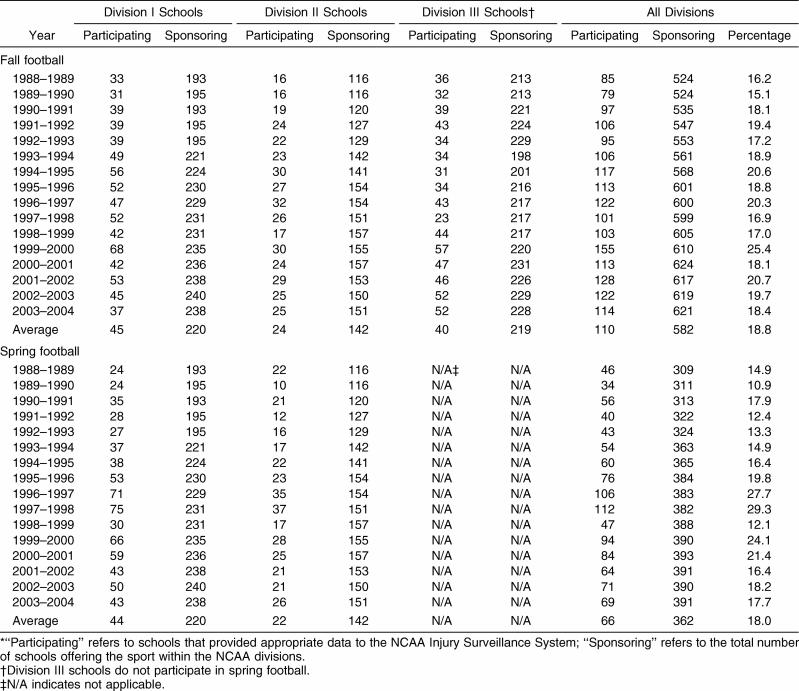
During the 16-year period from 1988–1989 through 2003– 2004, an average of 18.8% of schools sponsoring varsity football programs participated in annual fall NCAA Injury Surveillance System (ISS) data collection ( Table 1). A similar percentage (18.0%) of Division I and II schools participated in spring football data collection during the same period. The sampling process, data collection methods, injury and exposure definitions, inclusion criteria, and data analysis methods are described in detail in the “Introduction and Methods” article in this special issue. 2
Table 1. School Participation Frequency (in Total Numbers) by Year and National Collegiate Athletic Association (NCAA) Division, Men's Football, 1988–1989 Through 2003–2004*.
RESULTS
Game and Practice Athlete-Exposures
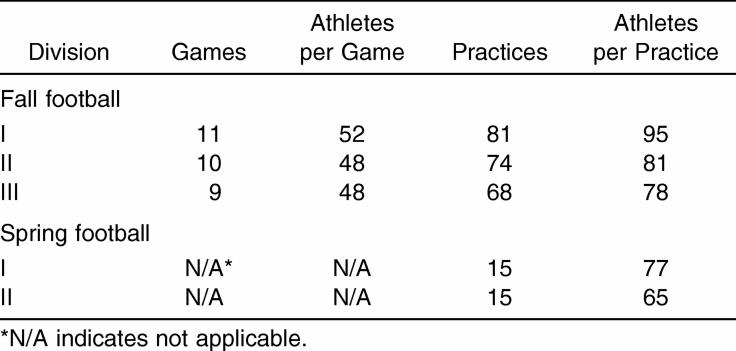
The average annual numbers of games, fall practices, spring practices, and athletes participating for each NCAA division, condensed over the study period, are shown in Table 2. For fall football, Division I averaged 7 more practices than Division II and 13 more than Division III. Division I also had a larger practice squad size than either of the other 2 divisions. Division I averaged 1 to 2 more games and 4 more game participants than Divisions II and III. In spring practices, both divisions averaged 15 practices, and Division I averaged 12 more participants per practice than Division II.
Table 2. Average Annual Games, Practices, and Athletes Participating by National Collegiate Athletic Association Division per School, Men's Football, 1988–1989 Through 2003–2004.
Injury Rate by Activity, Division, and Season
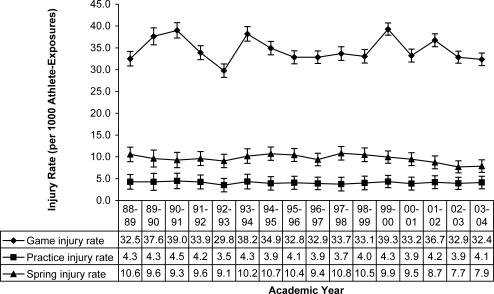
Fall game, fall practice, and spring practice injury rates over time, combined across divisions, with 95% confidence intervals (CIs), are displayed in Figure 1. Over the 16 years of the study, the rate of injury in games was 9 times higher than the practice injury rate (35.90 versus 3.80 injuries per 1000 athlete-exposures [A-Es], rate ratio = 9.4, 95% CI = 9.3, 9.5), and the risk of injury in spring practice was more than twice that in fall practice (9.62 versus 3.80 injuries per 1000 A-Es, rate ratio = 2.5, 95% CI = 2.5, 2.6; data not shown). No statistically significant decreases were identified in the fall game (average annual change of −0.2%, P = .69) or the fall practice (average annual change of −0.4%, P = .82). The spring practice (average annual change of −1.1%, P = .03) injury rates decreased during the sample period.
Figure 1. Injury rates and 95% confidence intervals per 1000 athlete-exposures by games, practices, and academic years, men's football, 1988–1989 through 2003–2004 (n = 30 797 game injuries, 42 355 fall practice injuries, and 10 943 spring practice injuries). Practice injury counts for 1996–1997 were imputed from adjacent years. Game time trend P = .69. Average annual change = −0.2% (95% confidence interval = −1.1, 0.7). Fall practice time trend P = .82. Average annual change = −0.4% (95% confidence interval = −3.5, 2.8). Spring practice time trend P = .03. Average annual change = −1.1% (95% confidence interval = −2.1, −0.1) .
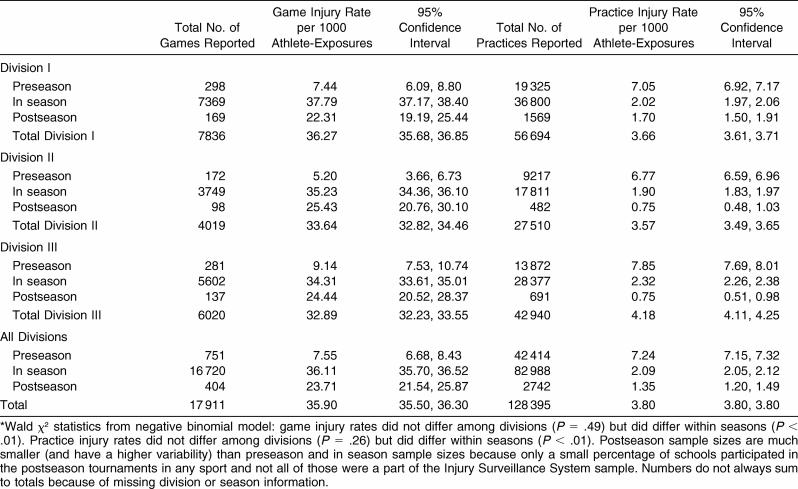
The total number of fall games, fall practices, and spring practices with associated injury rates condensed over years by division and season (preseason, in season, and postseason) are presented in Tables 3 and 4. During the 16-year period, 30 797 injuries from almost 18 000 games, 42 355 injuries from more than 128 000 fall practices, and 10 943 injuries from more than 15 000 spring practices were reported. Fall game and practice injury rates did not differ significantly across divisions. However, fall preseason practice injury rates were more than 3 times as high as in season or postseason practice injury rates (fall preseason versus regular season: 7.24 versus 2.09 injuries per 1000 A-Es, rate ratio = 3.5, 95% CI = 3.4, 3.5, P < .01; fall preseason versus postseason: 7.24 versus 1.35 injuries per 1000 A-Es, rate ratio = 5.4, 95% CI = 4.8, 6.0, P < .01), whereas in-season game injury rates were approximately 50% higher than postseason game injury rates (36.11 versus 23.71 injuries per 1000 A-Es, rate ratio = 1.5, 95% CI = 1.4, 1.7, P < .01). Spring practice injury rates were one third higher than preseason fall practice rates (9.62 versus 7.24 injuries per 1000 A-Es, rate ratio = 1.3, 95% CI = 1.3, 1.4, P < .01) and more than 2 times higher than the overall fall practice injury rate (9.62 versus 3.80 injuries per 1000 A-Es, rate ratio = 2.5, 95% confidence interval = 2.5, 2.6, P < .01).
Table 3. Games and Practices With Associated Injury Rates by National Collegiate Athletic Association Division and Season, Men's Football, 1988–1989 Through 2003–2004*.
Table 4. Practice Injury Rates, Men's Spring Football, 1988–1989 Through 2003–2004*.
Body Parts Injured Most Often andSpecific Injuries
The frequency of injury to 5 general body parts (head/neck, upper extremity, trunk/back, lower extremity, and other/system) for fall games, fall practices, and spring practices, with years and divisions combined, is shown in Table 5. The breakdown of injury frequency for each body region was similar for fall and spring practices and regular-season games. More than 50% of all injuries in the 3 activities were to the lower extremity. Systemic injuries, primarily heat illness, accounted for 6% of fall practice time-loss events.
Table 5. Percentage of Game and Practice Injuries by Major Body Part, Men's Football, 1988–1989 Through 2003–2004.
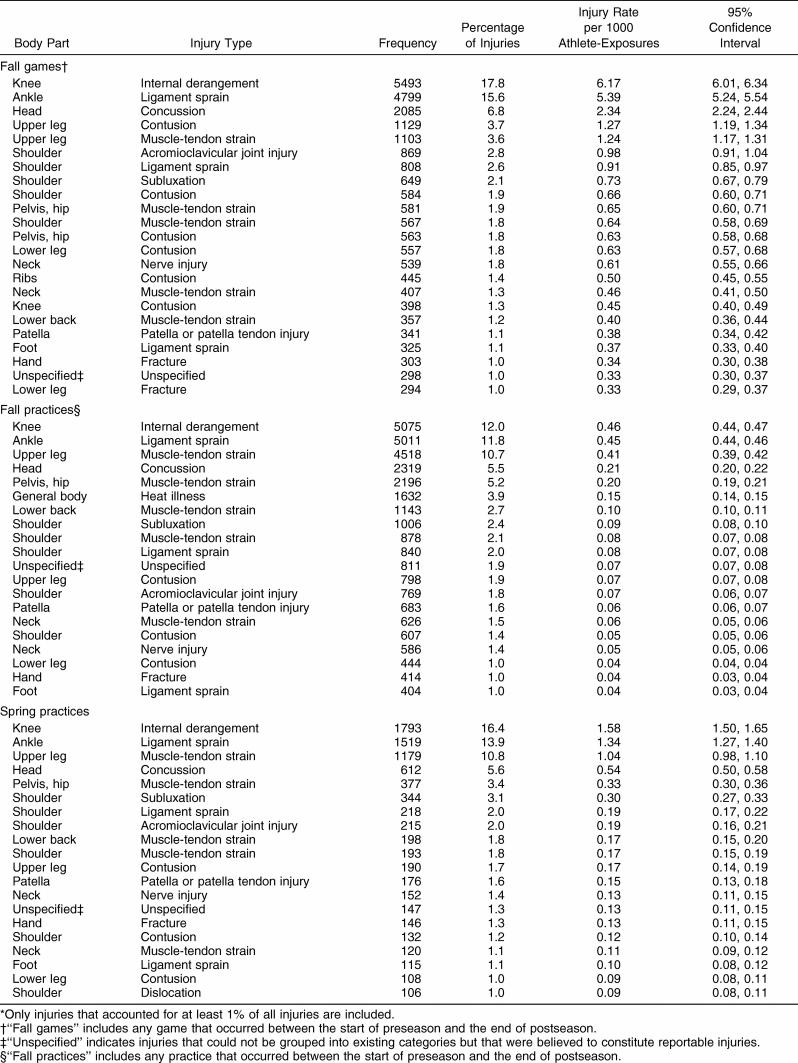
The most common injured body part and injury type combinations for games and practices with years and divisions combined are displayed in Table 6. All injuries that accounted for at least 1% of reported injuries during the 16-year sampling period were included. In fall games, knee internal derangements (17.8%), ankle ligament sprains (15.6%), and concussions (6.8%) accounted for the majority of injuries. A variety of shoulder problems also was reported. In fall practices, knee internal derangements (12.0%), ankle ligament sprains (11.8%), upper leg muscle-tendon strains (10.7%), and concussions (5.5%) were the most frequently reported. Heat illness totaled 3.9% of fall practice injuries. Spring practice injuries followed the fall practice injury pattern, with knee internal derangements (16.4%), ankle ligament sprains (13.9%), upper leg muscle-tendon strains (10.8%), and concussions (5.6%) accounting for 46.7% of all reported injuries. Heat illness totaled less than 0.5% of spring practice injuries. Compared with a fall practice, a participant in an in-season game was 18 times more likely to sustain an upper leg contusion (1.27 versus 0.07 injuries per 1000 A-Es, rate ratio = 18.1, 95% CI = 16.6, 19.9, P < .01), 14 times as likely to sustain an acromioclavicular joint sprain (0.98 versus 0.07 injuries per 1000 A-Es, rate ratio = 14.0, 95% CI = 12.7, 15.4, P < .01), 13 times as likely to sustain knee internal derangement (6.17 versus 0.46 injuries per 1000 A-Es, rate ratio = 13.4, 95% CI = 12.9, 13.9, P < .01), 12 times more likely to sustain an ankle ligament sprain (5.39 versus 0.45, rate ratio = 12.0, 95% CI = 11.5, 12.5, P < .01), and 11 times as likely to sustain a concussion (2.34 versus 0.21 injuries per 1000 A-Es, rate ratio = 11.1, 95% CI = 10.5, 11.8, P < .01).
Table 6. Most Common Game and Practice Injuries, Men's Football, 1988–1989 Through 2003–2004*.
Mechanism of Injury
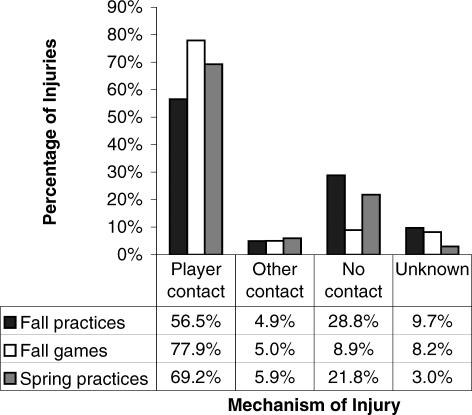
The 3 primary injury mechanisms—player contact, other contact (eg, balls, blocking dummies, ground), and no contact—in fall games, fall practices, and spring practices with division and years combined are displayed in Figure 2. The majority of game (78%, n = 23 993), fall practice (57%, n = 223 950), and spring practice (69%, n = 7578) injuries resulted from player contact. Noncontact (ie, no direct contact to the injured body part) was the second highest injury mechanism in all 3 activities but was less than half as frequent as player contact.
Figure 2. Game and practice injury mechanisms, all injuries, men's football, 1988–1989 through 2003–2004 (n = 30 797 game injuries, 42 355 fall practice injuries, and 10 943 spring practice injuries). “Other contact” refers to contact with items such as balls, blocking dummies, or the ground.
Severe Injuries: 10+ Days of Activity Time Loss
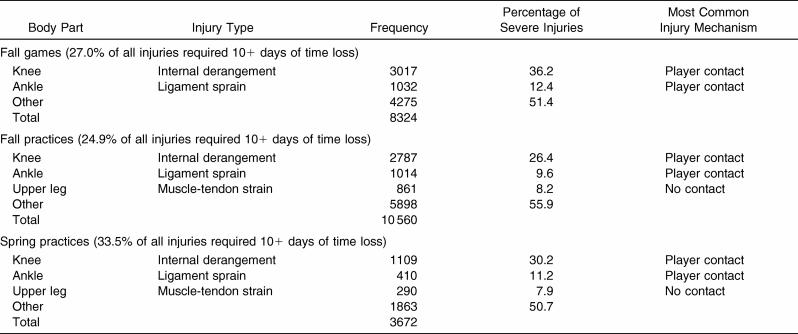
The top injuries that resulted in at least 10 consecutive days of restricted or total loss of participation and their primary injury mechanisms, combined across divisions and years, are presented in Table 7. Time loss of 10+ days was, for this analysis, considered a measure of severe injury. A total of 27% of fall game injuries, 25% of fall practice injuries, and 34% of spring practice injuries resulted in a loss of participation for at least 10 days. In all 3 activities, knee and ankle problems, primarily resulting from player contact, accounted for most of the severe injuries. Concussions represented 4% of severe time-loss injuries in games and 3% in both fall and spring practices (data not shown). The time-loss data may be more variable for spring practices due to the limited “season” length (up to 15 practices) for that activity.
Table 7. Most Common Game and Practice Injuries Resulting in 10+ Days of Activity Time Loss, Men's Football, 1988–1989 Through 2003–2004.
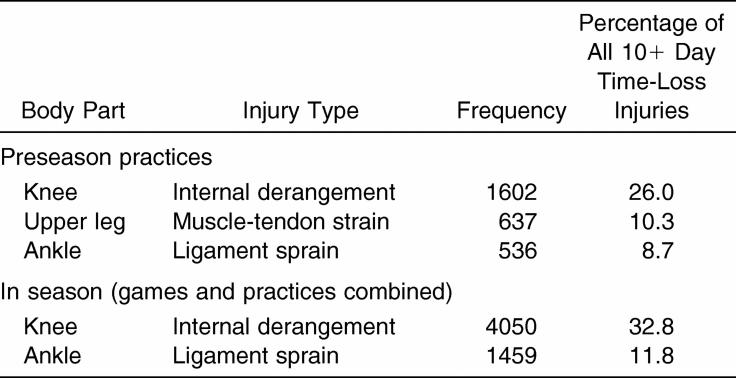
The top severe (10+ days of time loss) injuries in the fall preseason and in season (games and practices combined) are presented in Table 8. The percentages of knee and ankle injuries were similar between the preseason and the regular season, but muscle–tendon strains of the upper leg were more common in preseason practices.
Table 8. Summary of Preseason (Practice) Versus In Season (Game and Practice) 10+ Day Time-Loss Injuries, Men's Football, 1988–1989 Through 2003–2004.
Heat Illness
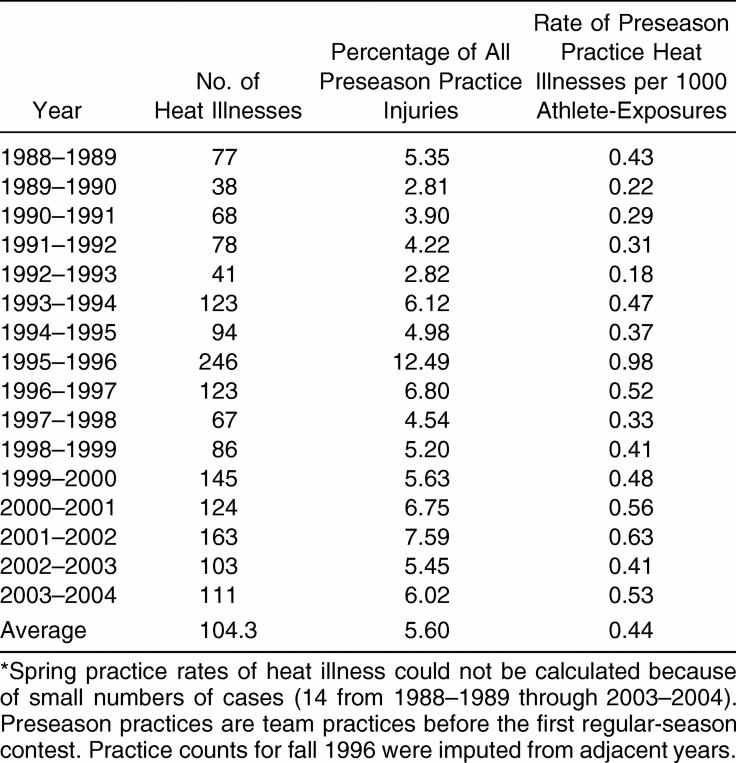
Heat illness rates by year in preseason fall practices from 1988–1989 through 2003–2004 are shown in Table 9. The table indicates that the rate of reported heat illnesses in preseason fall practices was relatively stable over the years. (Note that, due to missing data, the practice injury rate for 1996– 1997 was imputed from adjacent years). We caution that these data contain only heat illnesses that resulted in time lost from the sport.
Table 9. Fall Preseason Heat Illness by Year, Men's Football, 1988–1989 Through 2003–2004*.
Game Injuries
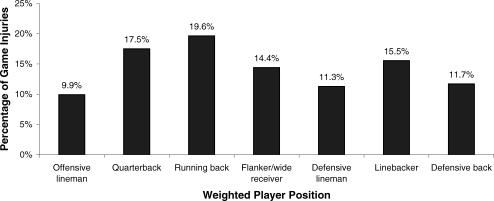
The general game injury distribution by weighted position (over all years of analysis) is shown in Figure 3. The percentages of injury by position were calculated and then divided by the number of players at each position (“position weight”) as follows: offensive line = 6, wide receiver = 2, quarterback = 1, running back = 2, defensive line = 4, linebacker = 3, and defensive back = 4. The offensive players with the highest number of injuries (by weighted position) were the quarterback (18%) and the running back (20%). All 3 general defensive positions accounted for approximately 15% of reported game injuries.
Figure 3. Game injuries by weighted position, men's fall football, 1988–1989 through 2003–2004. Percentages of injury by position were calculated and then divided by the weight of position as follows: offensive line = 6, wide receiver = 2, quarterback = 1, running back = 2, defensive line = 4, linebacker = 3, and defensive back = 4.
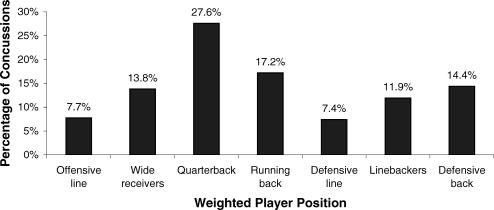
The game concussion injury distribution by weighted position (over all years of analysis) is shown in Figure 4. The offensive players with the highest number of concussions (by weighted position) were the running back (17%) and the quarterback (28%). The defensive player with the highest number of concussions was the defensive back (14%). Offensive players appeared to receive a higher number of concussions than defensive players.
Figure 4. Game concussion injuries by weighted position, men's fall football, 1988–1989 through 2003–2004. Percentages of injury by position were calculated and then divided by the weight of position as follows: offensive line = 6, wide receiver = 2, quarterback = 1, running back = 2, defensive line = 4, linebacker = 3, and defensive back = 4.
Rule Changes
We analyzed the data for spring football, comparing 1988– 1989 through 1996–1997 and 1997–1998 through 2003–2004 seasons, to assess the effect of a rule change that limited the amount of contact in spring practice (see “Commentary” section). The injury rate was slightly greater for the former time span than the latter, a finding that was statistically significant ( P < .01) but perhaps not clinically significant given that the difference was only 0.38 injuries per 1000 A-Es. However, the spring injury rate declined gradually and steadily since the highest injury rate (11.08 per 1000 A-Es) reported for the 1997–1998 season ( Figure 1).
We also assessed the effect of the spring practice rule change on the rate of anterior cruciate ligament (ACL) injuries and concussions. The ACL injury rates between the 2 periods were similar with 187 injuries for 1988–1989 through 1996– 1997 for an injury rate = 0.32 per 1000 A-Es, and 191 injuries for 1997–1998 through 2003–2004 for an injury rate = 0.34 per 1000 A-Es. The rate ratio comparing the 2 periods was 0.94. However, the number of reported concussions actually increased between the 2 periods: 225 concussions occurred in the 1988–1989 through 1996–1997 seasons (0.39 per 1000 A-Es) and 388 concussions in the 1997–1998 through 2003–2004 seasons (0.69 per 1000 A-Es), for a rate ratio of 0.57, 95% CI = 0.48, 0.67.
Knee Injuries
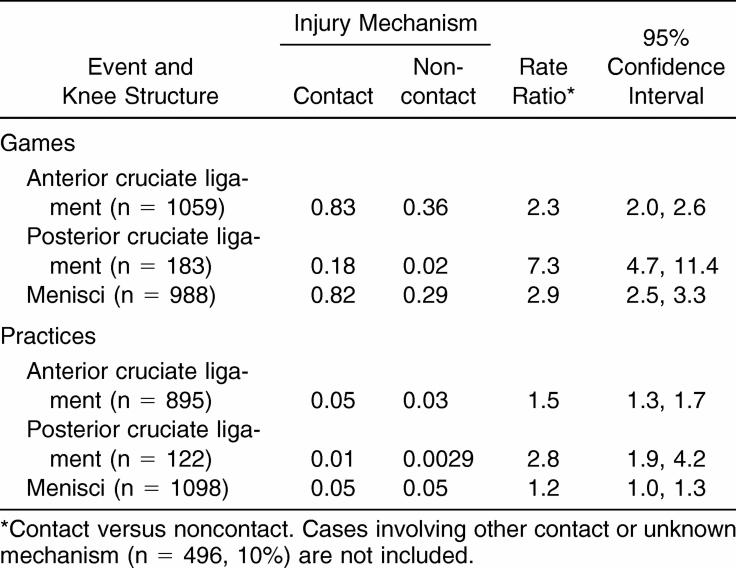
Approximately 85% of knee internal derangements were classified as new injuries. There were 3 major types of knee injuries (n = 4841) during games and practices: ACL, posterior cruciate ligament (PCL), and menisci. Athletes were more likely to injure the ACL, PCL, and menisci in fall games versus practices, and the contact injury mechanisms were more frequent than noncontact injury mechanisms for all 3 types of injury ( Table 10).
Table 10. Game and Practice Injury Rates and Mechanisms for Knee Structures per 1000 Athlete-Exposures, Men's Fall Football, 1988–1989 Through 2003–2004.
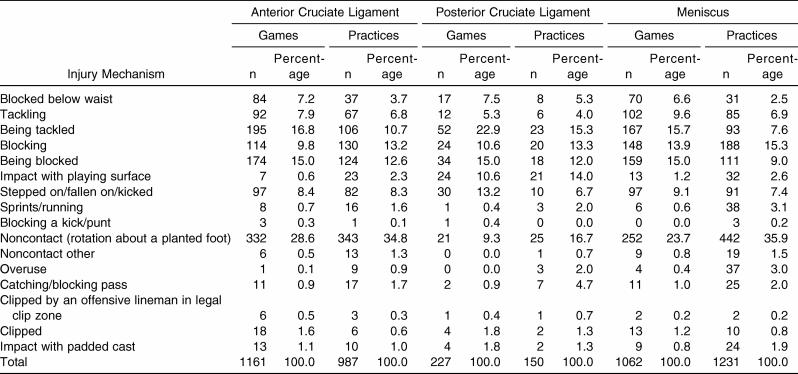
Further description of the mechanism of knee injury is provided in Table 11. Potentially illegal plays (blocking below the waist, clipping in the legal zone, and clipping) accounted for 7% of the ACL injuries, 9% of the PCL injuries, and 6% of the meniscus injuries.
Table 11. Knee Injury Mechanisms for Games and Practices in Detail, Men's Fall Football, 1988–1989 Through 2003–2004*.
A total of 45% of all knee internal derangements (n = 4767) resulted in less than 10 days of time loss. However, for those knee injuries with more than 10 days of time loss, Table 12 presents a summary of treatments (operative versus nonoperative). For the reported ACL injuries (n = 2159), 78% of the cases were operative, but we have no data on the operative procedures performed and, therefore, cannot assume that all the patients received some type of ACL reconstruction. When the PCL was injured, 39% underwent a surgical procedure. A limitation of this study was the inability to identify isolated versus multiple ligament injuries in the treatment and surgical intervention.
Table 12. Treatment of Anterior and Posterior Cruciate Ligament Injuries With 10+ Days of Time Loss, Men's Fall Football, 1988– 1989 Through 2003–2004*.
Shoulder Injuries
The most frequent shoulder injuries were acromioclavicular joint injury, ligament sprains, dislocations/subluxations, contusions, muscle-tendon strains, and nerve injuries ( Table 13). All these injuries occurred at a greater than 10-fold higher rate in games relative to practices.
Table 13. Injury Rates and Rate Ratios for Selected Game and Practice Shoulder Injuries, Men's Fall Football, 1988–1989 Through 2003–2004.
COMMENTARY
Football is a high-impact collision sport, with injuries occurring in both contact and noncontact situations. It is also a complex sport that requires athletes to perform different skills and activities, depending on the position played. The sport has a major fall season and a minor spring season. Players' physical characteristics (eg, age, height, weight) vary widely, both within a team and among NCAA divisions.
The results from this 16-year study period showed little variation in the individual injury rates for games, fall practices, or spring practices over time ( Figure 1). This is likely because the basic characteristics of the team and the typical exposure to football have not changed drastically over the years. Powell, 3 using data from the late 1970s and early 1980s (the National Athletic Injury/Illness Reporting System, or NAIRS), reported that the average team consisted of 93 players exposed to 82 practices sessions, and the average game squad was 51 players who team averaged 11 games. The data from the ISS are virtually identical ( Table 2) to the NAIRS data. Thus, exposure frequency in collegiate football has not changed much since NAIRS began in 1974. Differences among Divisions I, II, and III in their injury rates for preseason practices and in-season practices and games also appeared to be minimal.
The ISS injury rates were approximately 36 per 1000 A-Es for fall games, 4 per 1000 A-Es for fall practices, and 10 per 1000 A-Es for spring practices. Powell and Dompier 4 reported that the time-loss football injury rate was 9.3 per 1000 A-Es in Division I, 10.2 per 1000 A-Es in Division II, and 10.4 per 1000 A-Es in Division III during 2 seasons (2000–2001 and 2001–2002 academic years). Although these injury rates are lower than those seen in the ISS data, Powell and Dompier 4 did not distinguish between games and practices.
Other findings were that the game injury rate was more than 9 times higher than the in-season practice injury rate and that the spring injury rate was 2 times higher than the fall in-season practice injury rate. The game and practice injury rates are consistent with the data previously published by Powell. 3 He reported the game injury rate was 8 to 9 times greater than the fall practice rate and stated that injury prevention programs should focus on game conditions rather than practices. However, when placed in the context for football, these differences in the injury rates between games and practices are logical. The intensity level and speed are generally considered higher in games than in practices, increasing the magnitude of collisions and, thus, increasing the risk of injury. Most player-to-player contact occurs during games, preseason practices, and spring practices. Practice times are usually longer and involve more contact work during the preseason and spring season, possibly accounting for the higher injury rates in these sessions.
In spring football, the concept of practice may be vastly different than in the fall season. The roster is typically smaller in the spring, with the seniors having reached the end of eligibility and the new signees not yet in school; therefore, the number of repetitions and injury exposures are increased for all participants. Also, the level of competition may be higher in the spring. In the fall, many teams scrimmage with their first teams versus their second teams or practice offense and defense with their first and second teams versus scout teams, simulating the opponents' plays. In the spring season, to prepare for the upcoming fall season and without needing to be ready for a game each week, many teams have significantly more contact work than in the fall season, often against a higher level of competition (eg, first-team offense scrimmaging first-team defense) than typically seen in the fall season. In this instance, the football coaches may have the greatest influence on the injury rate, as they determine the amount of actual contact or hitting, the intensity level, who is contacted (eg, first string versus fourth string), how much contact is received during any given practice, and use of proper techniques and enforcement of the rules (eg, spearing). Games tend to reduce the influence of the coaches over the quantity and nature of body contact, as the game is played at high speed and high intensity and players expect to be involved in contacts.
Location of Injuries
It is important for the certified athletic trainer not only to examine the frequency of injury ( Table 5) in games and practices but to consider how the injury rate varies among games and fall and spring practices. The game-to-practice rate ratio indicates that upper leg contusions, acromioclavicular joint injury, knee internal derangements, ankle ligament sprains, and concussions occur at greater than 10-fold higher rates in games compared with practices. The certified athletic trainer must be alert to these conditions and be prepared to evaluate the athlete and render emergency care during games. The frequency distribution for the top 5 injury types for games, fall practices, and spring practices was about the same, accounting for approximately 45% of the total injuries for that session type. In fact, the top 5 injury types were identical between fall practices and spring practices (knee internal derangement, ankle ligament sprain, upper leg muscle-tendon strain, concussion, and pelvis, hip muscle strain). Although the percentage of knee internal derangements was 4.4% greater during spring practices, few differences were seen in the percentages of injuries for upper leg muscle-tendon strain (0.1%), concussion (0.1%), and pelvis, hip muscle-tendon strain (1.8%) among the seasons. However, for games, upper leg contusions were the fourth most common injury, and the percentages of knee internal derangements, ankle ligament sprains, and concussions also increased over those for fall and spring practices. Buckley and Powell 5 found a similar distribution pattern of injury frequency by body part using the NAIRS data, and Orchard and Powell 6 reported that the knee accounted for 13% and the ankle for 12% of all injuries in National Football League games from 1989–1998. As previously discussed, more contact and higher-velocity collisions would result in a higher number of injuries during games.
Spring Practice Injuries
In 1997, in an attempt to decrease the injury rate disparity between fall and spring football, the NCAA Committee on Competitive Safeguards and Medical Aspects of Sports recommended changes in spring practices that limited the amount of full-team, full-contact practice. 7 Of the 15 practices allowed for spring football, 3 are mandated to be noncontact, and headgear is the only piece of protective equipment allowed during noncontact practices. The first 2 practices must be noncontact, and 1 other noncontact practice must be among the 15 practices. Of the 12 permissible contact practices, 8 may involve tackling, and no more than 3 of the 8 tackling sessions may be devoted primarily (greater than 50% of practice time) to 11-on-11 scrimmages. This rule went into effect for the 1997– 1998 spring practices. Our analyses detected a statistically significant decline in the rate of spring practice injuries ( P < .01) after the rule change.
Albright et al, 8 in a controlled study using the Big Ten Conference Sports Injury Surveillance System, analyzed the spring football injury rate before and after the implementation of the new practice rule. From 1992 to 1997, they reported a spring injury rate of 19.8 per 1000 A-Es; the rate declined to 16.4 per 1000 A-Es for the 1998–2000 seasons (2 seasons of spring football data) for a decrease of 1.2 times. The authors concluded that the injury rate in spring practices was three-fold greater than for fall practices, 8 and this rate is similar to the ISS data. Both the ISS data and the Albright et al 8 study demonstrate variations in the overall injury rate with the implementation of the spring practice rule. We believe this topic requires further study to determine the longitudinal effect of this rule change.
We also wanted to determine the effects of the spring practice rule change on knee injuries and concussions. The injury rate for ACL injuries between the 2 periods was approximately the same, as evidenced by a rate ratio close to 1. Even though the type of protective equipment worn during practice between the 2 periods differed, the activities fundamental to the sport of football remained the same. Athletes still participated in drills and activity sessions during spring football, which did not change the number of ACL injuries. The rate of reported concussions increased between the 2 periods. We attribute this increased number of concussions in the latter period in part to greater knowledge and recognition by certified athletic trainers and the medical staffs to the signs and symptoms of concussion and to better management of this injury. 9, 10 Thus, the increased rate of concussion during the second period may not necessarily be due to an actual increase in the number of concussions or the change in practice rules but to better and more accurate recognition by certified athletic trainers. It will be interesting to continue to monitor this trend of concussions during spring football practice in future investigations.
Preseason Acclimatization Period
The other major rule change implemented by the NCAA was the 5-day acclimatization period for preseason football that went into effect in the 2002–2003 season. The rule states that during the first 5 days of practice, student-athletes shall not engage in more than 1 on-field practice per day, not to exceed 3 hours in length. During the first 2 days of the acclimatization period, helmets are the only piece of protective equipment participants may wear. During the third and fourth days of the acclimatization period, helmets and shoulder pads are the only pieces of protective equipment student-athletes may wear. During the final day of the 5-day period and on any days thereafter, student-athletes may practice in full pads. However, after the 5-day acclimatization period, an institution may not conduct multiple on-field practice sessions on consecutive days. Student-athletes cannot engage in more than 3 hours of on-field practice activities on those days during which 1 practice is permitted. Student-athletes shall not engage in more than 5 hours of on-field activities on those days during which more than 1 practice is permitted. On those days when institutions conduct multiple practice sessions, student-athletes must be provided with at least 3 hours of continuous recovery time between the end of the first practice and the start of the last practice that day. Only 1 season of data with the new acclimatization rule change was available, which was insufficient for comparing injury rates or determining heat illness trends before and after the rule change. Future researchers should assess changes in these rates with the implementation of this new rule.
Knee Injuries
Knee injuries are common in football players. Athletes were more likely to injure the ACL, PCL, and menisci in games versus practices, and contact injury mechanisms were more frequent than noncontact injury mechanisms. Although we do not know the exact mechanisms of all injuries, most of the significant knee injuries (especially of the ACL) are believed to occur with the foot planted and force applied. With contact mechanisms, the athlete who is injured may not be able to pick his foot up and eliminate the ground contact.
Injury prevention measures should continue to focus on the use of safe sport techniques and elimination of illegal plays. Neuromuscular training programs have shown promise in reducing ACL injury risk in females but have not been thoroughly studied in males.
Shoulder Injuries
The shoulder is a complex joint that receives substantial loads and axial forces during football. As with the other major joints, the greatest risk of injury was during games. The fall game versus practice rate ratios were all above 10 for acromioclavicular joint injury, ligament sprains, contusions, and nerve injuries ( Table 13). Although the ISS cannot differentiate among the types of dislocations or the specific nerves involved, certified athletic trainers should be cognizant of these injury patterns. Anecdotally, in our clinical experience, we are seeing more shoulder injuries in linemen: in particular, labral conditions and posterior glenohumeral instability. In recent years, offensive linemen have started using blocking techniques in which they punch and block the opponent using extended arms. Although effective for blocking, this technique places greater stress on the glenoid labrum and posterior capsule structures, which could be a factor in increased labral injuries and posterior shoulder instability. This topic requires further analysis.
Exertional Heat Illnesses and Concussions
The other 2 injury trends that merit further attention are exertional heat illness and sport-related concussion, as both are high-profile issues with the potential for catastrophic outcomes. The National Athletic Trainers' Association has published position statements to guide practitioners in the recognition and management of exertional heat illness 11 and sport-related concussions. 12 The preseason period (defined as the first day of practice to the last practice before the first game) has been postulated to be the period when athletes are at the greatest risk of heat illness. We found an overall heat illness injury rate of 0.44 per 1000 A-Es for the preseason period, which accounted for 5.6% of all the reported injuries during this time ( Table 9). Almost all heat illnesses occurred in preseason practices (n = 1567/1632), but it is important to remember that not all game heat illnesses may be captured because the ISS injury definition states that only injuries resulting in time loss are reportable. In a study of 5 NCAA football institutions in the southeastern United States from August through October 2003, Cooper et al 13 noted an overall heat-related injury rate of 4.10 per 1000 A-Es and reported that exertional heat cramps accounted for 73% of the total exertional heat illnesses, followed by heat exhaustion at 21% and heat syncope at 6%. The first 3 weeks of August presented the greatest risk of exertional heat illnesses to collegiate football players. Certified athletic trainers must continually monitor athletes' responses during games and practices for signs and symptoms of exertional heat illnesses and the environment.
The percentage of concussion was 5.5% for fall practices (0.21 per 1000 A-Es), 6.8% for games (2.34 per 1000 A-Es), and 5.6% (0.05 per 1000 A-Es) for spring practices. When the frequencies are standardized using A-Es, the fall game injury rate was 11 times higher than the fall practice rate ( Table 6). Several authors have reported similar or lower concussion injury rates, 14, 15 but this percentage of concussions is similar to that in another report. 16 Clearly, the greatest risk of concussion is in games, which have the greatest risk of high-speed collisions. Using an accelerometer system, Duma et al 17 estimated that the average peak head linear acceleration was 32 ± 25 g in collegiate football players.
In the ISS data, the quarterback and running back had the greatest frequency of game concussions ( Figure 4). It is not surprising that the offensive player who was struck in the open field was more susceptible to concussion than the other positions. In a previous report of concussion in collegiate football players, 14 the concussion injury rate for the quarterback was 0.83 per 1000 A-Es; for the running back, 0.71 per 1000 A-Es; and for the wide receiver, 0.54 per 1000 A-Es. Higher rates were reported for the linebacker (0.99 per 1000 A-Es) and offensive lineman (0.95 per 1000 A-Es). 15 About 15% of the athletes with concussions lost 10 or more days from participation (games = 15%, practices = 13%, spring practices = 15%).
The National Athletic Trainers' Association published a position statement on the management of sport-related concussion that provided 36 recommendations for certified athletic trainers to use in the recognition, management, assessment, and return to play after a concussion. 12 The general standard for management of a concussion includes a physical assessment and evaluation, including a neurologic examination, imaging studies, assessment of concussion-related self-report symptoms, measures of cognition and balance, and an exertional testing program before returning to play. Several authors 12, 18 have recommended that an athlete must be symptom-free for 7 days, both at rest and with exertion, before return to play can be considered. McCrea et al, 19 in their NCAA study, tracked the recovery of concussion-related symptoms, neuropsychological performance, and balance in 94 athletes with concussion. Concussion related-symptoms gradually resolved within 7 days, cognitive functioning improved to baseline levels within 5 to 7 days, and balance deficits also returned to baseline within 3 to 5 days after injury. Recent advances by several manufacturers toward better-constructed helmets may aid in reducing the impact force and have a role in the short-term and long-term effects of the concussive injury. 20 Along these same lines, face mask technology has also improved, allowing more force to be absorbed and reducing the amount of force transmitted to the head.
CONCLUSIONS
This is the first published analysis of the ISS data over such an extended time. The ISS uses a time-loss definition for a reportable injury and relies on the volunteer efforts of certified athletic trainers to record and report the information. Frequency distributions, injury rates, and rate ratios were used to identify general injury patterns and trends. Games clearly presented the greater risk of injury to athletes than practices. Although injuries are an unfortunate but expected aspect of competitive football, the sports medicine team's goal must be injury prevention. This can be a difficult and complicated process, especially because the fundamentals of the game have not changed dramatically during the last 40 years. Certified athletic trainers, coaches, and administrators should focus on improving equipment, rule changes, and modifications in sport-specific and coaching techniques. The development of new and improved equipment may aid in preventing and reducing injuries. Not only have the helmet and face mask changed during this study, but shoulder pads, flak jackets, and other padding garments have also seen technologic improvements. The enhanced force dissipation and the materials used in the equipment may aid in the reduction of forces transmitted to the body. Mouthguards are also better constructed with improved materials, and many institutions are using custom mouthguards to reduce dental injuries. Also, prophylactic knee and ankle taping and bracing has been studied with the aims of reducing injury rates and increasing the awareness of these injuries. Consistent data need to be collected so that we can determine the effectiveness of these protective devices and the resulting changes in injury rates.
It has been thought that strength and conditioning programs would have an effect on the injury rate. During the 16-year reporting period, although strength and conditioning programs have improved dramatically, the injury rates for games and practices have remained largely unchanged. Strength and conditioning programs may help to decrease injuries through improved conditioning. Yet we can also argue that stronger, faster athletes increase the speed and collision forces, causing more injuries.
In 2004, the NCAA Football Rules Committee changed the rules related to spearing and head-down contact in football, based on recommendations by a task force created specifically to reduce the incidence of head and cervical spine injuries in football players. As a part of this rule change, extensive education was initiated for athletes, coaches, and officials, including the creation of a videotape on proper tackling techniques and a locker-room poster to increase awareness. As injury patterns that may be rule based are identified, the rules must be re-examined with the goal of lowering the injury rate. In many instances, rule changes are closely related to technique changes and vice versa. The effects of rule and technique changes on the integrity of the game are an interesting topic for discussion.
Given the range of potential injuries, football creates unique challenges. The certified athletic trainer and the rest of the medical team must be prepared to evaluate, treat, and rehabilitate a myriad of injuries and illnesses. At 1 university, physician evaluations resulted in 79% musculoskeletal diagnoses and 21% general medical condition diagnoses, and football accounted for 22% of all physician evaluations in a comprehensive intercollegiate sports program. 21 Other authors 4 found that 57% of the therapeutic treatments by certified athletic trainers were associated with non–time-loss injuries and that more therapeutic treatments were required for these than for time-loss injuries during the course of a year. These data demonstrate the need for appropriate medical care for those schools that sponsor collegiate football. This is especially true for games, as the injury rate increased substantially over practices, but it is also important during practices as the volume of injuries increases. A disparity in medical coverage may occur whereby games may have multiple medical providers (certified athletic trainers, physicians, emergency medical technicians) and practices have significantly fewer. Although the injury rate was higher for games, these data also demonstrate that a greater number of injuries occurred during practices. This finding makes sense as practice sessions were far more numerous than games. The National Athletic Trainers' Association published the recommendations and guidelines for appropriate medical coverage of collegiate athletes to help guide institutions in determining the number of certified athletic trainers needed for a comprehensive athletic health care program. 22
Football is a sport contested at many levels, with players having a variety of shapes and sizes, playing at different speeds and intensities. The reduction in catastrophic cervical spine injuries after spear tackling was prohibited provides incentive to pursue additional injury prevention endeavors in football. 7 Future NCAA data collection and analysis will allow us to identify and study injury trends. Strategies to prevent injury will be developed, implemented, and evaluated during specific periods with the goal of improving the safety of the game for the participants. Evaluation of injury trends and risks in collegiate football by the sports medicine community through detailed epidemiologic investigations will allow us to improve the sport's safety for all participants.
Acknowledgments
We thank John Powell, PhD, ATC, of Michigan State University, and Cathleen Brown, PhD, ATC, of the University of Georgia, for their insightful review of the manuscript.
REFERENCES
- 1981/82–2004/05 NCAA Sports Sponsorship and Participation Rates Report. Indianapolis, IN: National Collegiate Athletic Association; 2006.
- Dick R, Agel J, Marshall SW. National Collegiate Athletic Association Injury Surveillance System commentaries: introduction and methods. J Athl Train. 2007;42:173–182. [PMC free article] [PubMed] [Google Scholar]
- Powell JW. Pattern of knee injuries associated with college football 1975– 1982. Athl Train J NATA. 1985;20:104–109. [Google Scholar]
- Powell JW, Dompier TP. Analysis of injury rates and treatment patterns for time-loss and non-time-loss injuries among collegiate student-athletes. J Athl Train. 2004;39:56–70. [PMC free article] [PubMed] [Google Scholar]
- Buckley WE, Powell J. NAIRS: an epidemiological overview of the severity of injury in college football 1975–1980 seasons. Athl Train J NATA. 1982;17:279–282. [Google Scholar]
- Orchard JW, Powell JW. Risk of knee and ankle sprains under various weather conditions in American football. Med Sci Sports Exerc. 2003;35:1118–1123. doi: 10.1249/01.MSS.0000074563.61975.9B. [DOI] [PubMed] [Google Scholar]
- Reider B. An ounce of prevention. Am J Sports Med. 2004;32:1383–1384. doi: 10.1177/0363546504268028. [DOI] [PubMed] [Google Scholar]
- Albright JP, Powell JW, Martindale A. Injury patterns in Big Ten Conference football. Am J Sports Med. 2004;32:1394–1404. doi: 10.1177/0363546504264159. et al. [DOI] [PubMed] [Google Scholar]
- Ferrara MS, McCrea M, Peterson CL, Guskiewicz KM. A survey of practice patterns in concussion assessment and management. J Athl Train. 2001;36:145–149. [PMC free article] [PubMed] [Google Scholar]
- Notebaert A., Guskiewicz KM. Current trends in athletic training practice for concussion assessment and management. J Athl Train. 2005;40:320–325. [PMC free article] [PubMed] [Google Scholar]
- Binkley HM, Beckett J, Casa DJ, Kleiner DM, Plummer PE. National Athletic Trainers' Association position statement: exertional heat injuries. J Athl Train. 2002;37:329–343. [PMC free article] [PubMed] [Google Scholar]
- Guskiewicz KM, Bruce SL, Cantu RC. National Athletic Trainers' Association position statement: management of sport-related concussion. J Athl Train. 2004;39:280–297. et al. [PMC free article] [PubMed] [Google Scholar]
- Cooper ER, Ferrara MS, Broglio SP. Exertional heat illness and environmental conditions during a single football season in the Southeast. J Athl Train. 2006;41:332–336. [PMC free article] [PubMed] [Google Scholar]
- Alles W, Powell JW, Buckley WE, Hunt EE. Three year summary of NAIRS football data. Athl Train J NATA. 1980;15:98–100. [Google Scholar]
- Buckley WE. Concussion in college football: a multivariate analysis. Am J Sports Med. 1988;16:51–56. doi: 10.1177/036354658801600109. [DOI] [PubMed] [Google Scholar]
- Guskiewicz KM, McCrea M, Marshall SW. Cumulative effects associated with recurrent concussion in collegiate football players: the NCAA Concussion Study. JAMA. 2003;290:2549–2555. doi: 10.1001/jama.290.19.2549. et al. [DOI] [PubMed] [Google Scholar]
- Duma SM, Manoogian SJ, Bussone WR. Analysis of real-time head accelerations in collegiate football players. Clin J Sport Med. 2005;15:3–8. doi: 10.1097/00042752-200501000-00002. et al. [DOI] [PubMed] [Google Scholar]
- Cantu RC. Posttraumatic retrograde and anterograde amnesia: pathology and implication in grading and safe return to play. J Athl Train. 2001;36:244–248. [PMC free article] [PubMed] [Google Scholar]
- McCrea M, Guskiewicz KM, Marshall SW. Acute effects and recovery time following concussion in collegiate football players: the NCAA Concussion Study. JAMA. 2003;290:2556–2563. doi: 10.1001/jama.290.19.2556. et al. [DOI] [PubMed] [Google Scholar]
- Collins M, Lovell MR, Iverson GL, Ide T, Maroon J. Examining concussion rates and return to play in high school football players wearing newer helmet technology: a three-year prospective cohort study. Neurosurgery. 2006;58:275–286. doi: 10.1227/01.NEU.0000200441.92742.46. [DOI] [PubMed] [Google Scholar]
- Steiner ME, Quigley B, Wang F, Balint CR, Boland AL. Team physicians in college athletics. Am J Sports Med. 2005;33:1545–1551. doi: 10.1177/0363546505275491. [DOI] [PubMed] [Google Scholar]
- NATA recommendations and guidelines for appropriate medical coverage of intercollegiate athletics, revised, May 2003. Available at: http://www.nata.org/publicinformation/files/amciarecs%20andguidesrevised.pdf. Accessed January 16, 2007 .


