Abstract
P53 regulates numerous downstream targets to induce cell cycle arrest, senescence, apoptosis, and DNA repair in response to diverse stresses. Hdm2 and Hdmx are critical negative regulators of P53 because Hdm2 regulates P53 abundance, and both can antagonize P53 transactivation. Modest changes in Hdm2 or Hdmx abundance affect P53 regulation, yet quantitative information regarding their endogenous intracellular concentrations and subcellular distributions during a stress response are lacking. We analyzed these parameters in normal and cancer cells after DNA damage. Our data show that the nuclear abundance of Hdm2 and Hdmx relative to P53 limits P53 activity in cells growing in culture. Upon DNA damage, P53 nuclear abundance increases, whereas Hdm2 and Hdmx stability decreases, which greatly limits their ability to antagonize P53, regardless of their levels. These data indicate that the damage-activated switch in Hdm2 ubiquitin ligase preference from P53 to itself and Hdmx is central to P53 activation.
Keywords: HDM2, HDMX, quantitation, stoichiometry, Mdmx
The P53 tumor suppressor is an unstable transcription factor that can regulate numerous downstream targets to induce cell cycle arrest. Although Hdm2, an E3 ligase, targets P53 for degradation and can inhibit its transactivation function, Hdmx may be the more potent P53 transactivation antagonist in vivo (see ref. 5 for review).
The mechanisms by which P53 is activated after DNA damage have been widely studied (1). Two models that incorporate key roles for damage-activated kinases have emerged to explain how Hdm2- and Hdmx-mediated inhibition of P53 is overcome. The first proposes that activation of the ATM kinase leads to a kinase cascade resulting in phosphorylation of highly conserved serine and threonine residues in P53 within and flanking the Hdm2/Hdmx-binding region (6). This induces a conformational change in P53, leading to Hdm2 dissociation, P53 stabilization and accumulation, and binding of P53 transcriptional coactivators (7, 8). Histone acetyl transferase binding acetylates P53 C-terminal lysines and chromatin and promotes transactivation (9). The situation is likely more complex, because P53 in which highly conserved C-terminal lysines are replaced by arginines has basal and stress-induced stability and activity comparable with wild-type P53 (10, 11). Additionally, stabilization of P53 in the absence of detectable N- and C-terminal phosphorylation engenders full P53 activation (12). Thus, posttranslational P53 modifications fine-tune P53 transcription responses but do not act as on–off switches.
A second model is supported by accumulating evidence that damage-activated kinases also phosphorylate Hdm2 to switch its E3 ligase specificity from P53 to itself and Hdmx (13–17). In part, the switch in substrate specificity is mediated by posttranslational modifications of Hdm2 and Hdmx that promote dissociation of the deubiquitinating enzyme HAUSP from Hdm2 and Hdmx (18). This increases Hdm2 and Hdmx degradation, resulting in P53 stabilization, accumulation, and transcriptional activation. Whether increasing Hdm2 levels is required for efficient Hdmx degradation after DNA damage remains unclear (13, 19). Together these data suggest a model in which destabilization and degradation of Hdm2 and Hdmx are critical for P53 stabilization and activation.
Subtle perturbations in Hdm2 and Hdmx stoichiometry profoundly alter P53 activity and tumor suppressor function. For example, increasing the abundance of either Hdm2 or Hdmx mitigates P53 transactivation and functional output (20, 21), which explains their frequent overexpression in diverse human cancers (22–24). Hdm2 overexpression can also trigger degradation of P53 and Hdmx (13, 17, 25, 26). Conversely, overexpressing Hdmx can stabilize either Hdm2 or P53, depending on Hdmx abundance (27, 28). In premenopausal women, a polymorphism in the promoter of Hdm2 can increase estrogen-induced Hdm2 expression, leading to decreased P53 function and increased cancer risk (29). By contrast, mice expressing 30–50% of the normal Mdm2 levels are hypersensitive to P53 activation and more resistant to oncogene-induced tumorigenicity (30). These data emphasize the sensitivity of this pathway to the relative levels of P53, Hdm2, and Hdmx.
We quantified P53, Hdm2, and Hdmx levels in human normal and tumor cell lines to investigate the molecular basis of P53 regulation. Our data show that the nuclear P53 concentration in exponentially growing cells in culture is submolar to Hdm2 and Hdmx, which accounts for its low activity under these conditions. In the absence of genotoxic stress, manipulation of Hdmx/P53 stoichiometry alters P53 transcriptional output. However, after DNA damage, P53 transcriptional activity correlates with nuclear p53 abundance, and the inhibitory effect of Hdm2 and Hdmx on P53 is attenuated because of DNA damage-mediated destabilization of both negative regulators.
Results and Discussion
Determining Concentrations of Endogenous P53, Hdm2, and Hdmx in Cultured Cells.
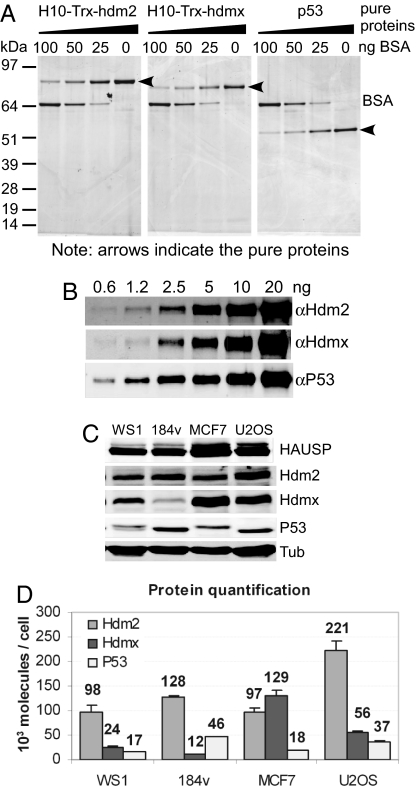
We used pure P53 protein (a gift from Alan Fersht), and N-terminally tagged Hdm2 and Hdmx proteins (see Materials and Methods) as standards in Western blot analyses (Fig. 1 A and B) to quantify their intracellular concentrations. The LiCor protein detection system enabled determination of band intensity in Western blots over a greater dynamic range than that of conventional chemiluminescence [see supporting information (SI) Fig. 7].
Fig. 1.
Protein quantification using LiCor and Western blotting. (A) Serially diluted pure recombinant proteins were applied to each lane of a gradient polyacrylamide gel along with different known concentrations of BSA as a standard. The gel was stained with SYPRO-ruby, and the intensities of protein staining were measured by using the Typhoon image system. (B) The linearity of the system was determined by Western blotting of serially diluted known concentrations of pure recombinant P53, Hdm2, and Hdmx. Signals were analyzed by using the LiCor system. (C) Protein analyses in equal numbers of WS1, 184V, MCF7, and U2OS cells. Lysates obtained from the same numbers of cells were run on an 8% acrylamide gel along with a mix of serially diluted protein standards (data not shown) and immunoblotted with antibodies against HAUSP, Hdm2, Hdmx, P53, and α-tubulin. (D) Protein quantification based on the band intensities from the Western blot in C. All values were derived by using the LiCor system. The amounts of each protein were calculated by using band intensities from a known concentration of the respective pure proteins as standards and with known cell numbers from lysate preparation. Error bars represent SD of three experiments. Numbers represent the protein molecules × 103 per cell.
We quantified P53, Hdm2, and Hdmx levels in exponentially growing normal human cells (WS1, fibroblast cells; 184V, mammary epithelial cells) and two tumorigenic cell lines (MCF7, mammary epithelial cells; U2OS, osteosarcoma cells) to model how P53 activity is retained under the cell culture conditions typically used to study the P53 pathway. Fig. 1 C and D show that the intracellular concentrations of P53, Hdm2, and Hdmx varied among the cell lines analyzed. Because Hdm2 is a key determinant of P53 and Hdmx stability, we expected higher Hdm2 levels to correlate with lower P53 abundance. However, although Hdm2 levels were approximately the same in WS1, 184V, and MCF7 cells, the P53 abundance in 184V cells was twice that of the others (Fig. 1D). Furthermore, Hdmx has been reported to either antagonize or augment Hdm2-mediated degradation of P53, depending on its expression level (28, 31), yet P53 abundance in MCF7 cells was similar to that in WS1 cells, even though MCF7 cells have an excess of Hdmx relative to Hdm2. The high level of Hdmx in MCF7 cells likely derives from Hdmx gene amplification (24), but factors such as the ubiquitin-specific protease HAUSP also affect P53, Hdm2, and Hdmx stability and abundance (18, 32). However, cells expressing similar amounts of Hdm2 and HAUSP have very different levels of P53 and Hdmx (Fig. 1C). Thus, factors in addition to Hdm2 and HAUSP likely control P53 and Hdmx abundance. We also note that the P53 pathway is activated in exponentially growing cultured cells, because reducing P53 levels by expression of papilloma virus E6 protein reduced Hdm2 and P21 mRNA abundance (data not shown). Therefore, we use the term “basal activity” to refer to P53 activity in cells before DNA damage.
Changes in Stoichiometry After Damage-Induced P53 Activation.
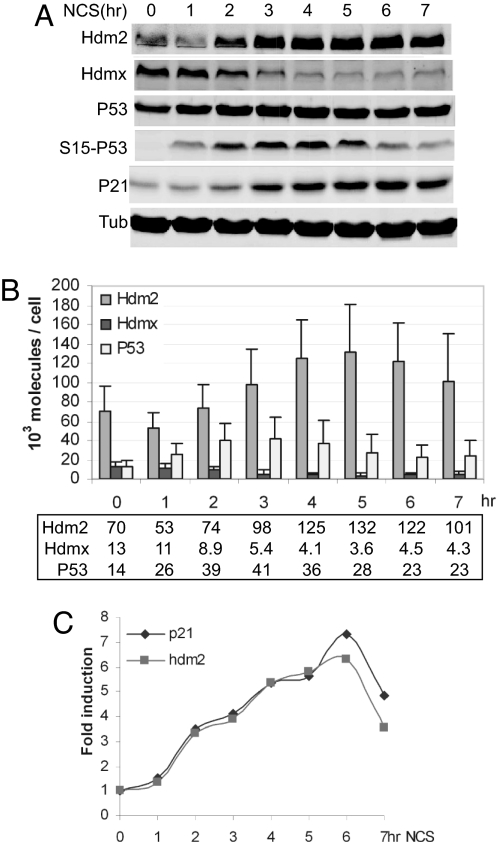
The above data reveal that, under the stated conditions, the measured amounts of Hdm2 and Hdmx limit, but do not completely block P53 activity. These data beg the question of whether P53 activation by DNA damage necessitates increasing its level to exceed those of Hdm2 and Hdmx. We addressed this issue by measuring protein level changes in response to the radiomimetic agent neocarzinostatin (NCS). Phosphorylation of Ser-15 of P53 (an ATM target site) confirmed DNA damage signaling by NCS (Fig. 2A). Hdm2 degradation was evident within 1 h of NCS addition to WS1 cells, whereas Hdmx decreased between 1 and 2 h (Fig. 2 A and B). P53 stabilization and transcriptional activation were apparent by 1–2 h (Fig. 2 B and C). At the time of transcriptional activation, P53 was in molecular excess of Hdmx (Fig. 2B). The levels of P53 continued to increase, reached a peak between 3 and 4 h of NCS treatment, and declined slowly thereafter. By contrast, Hdmx decreased by at least half and stayed at or below that level until the end of the time course (Fig. 2B). Hdm2 abundance paralleled its transcriptional profile after the 2-h time point (Fig. 2 B and C).
Fig. 2.
Quantitative kinetic analysis of P53 response to DNA damage in WS1 cells. (A) Time course of Western blot analysis. WS1 cells were treated with 300 ng/ml NCS for the indicated times. Cells were counted before harvesting. Lysates were analyzed by Western blotting using antibodies to detect Hdm2, Hdmx, P53, P53-phosphorylated S15 (S15-P53), P21, and α-tubulin (Tub). (B) Time course of NCS response in WS1. The amounts of Hdm2, Hdmx, and P53 per cell at the indicated times after NCS treatment were determined as described in Fig. 1. Numbers shown in the box represent the protein molecules × 103 per cell. (C) P53 activation in WS1. Time course of P53 target gene activation is shown. WS1 cells were treated as described in A. RNA was harvested and subjected to real-time QPCR with primers that amplified hdm2 and p21 genes. Gene induction was normalized to untreated.
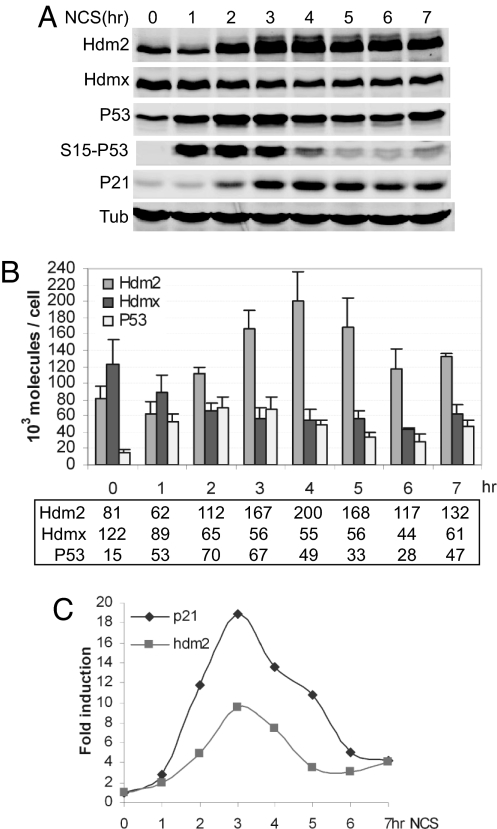
The above quantitative data reveal a parallel between the decrease in Hdmx abundance, increase in Hdm2 abundance, and increase in P53 transactivation. We next analyzed the activation kinetics in MCF7 cells to determine whether the high Hdmx abundance in this cell line altered the P53 response after DNA damage. Ser-15 phosphorylation and robust P53 stabilization occurred within 1 h of NCS addition (Fig. 3 A and B). P53 target genes were strongly induced by 2 h (Fig. 3C). At this point, the total P53 concentration equaled that of Hdmx, which was reduced by half of its initial high level (Fig. 3B). However, the robust transcriptional activation was transient and correlated with parallel decreases in total and Ser-15-phosphorylated P53 and decreased Hdm2 and P21 levels, likely resulting from their decreased P53-dependent transactivation. Single-cell analysis indicated that the P53 levels were remarkably consistent from cell to cell during the activation phase of the response subsequent to NCS-induced DNA damage (SI Fig. 8), and the relative changes in intensity of the P53 signals over time correlated well with the quantitative data. However, heterogeneity in P53 fluorescence became evident at later times, correlating with attenuation of the response.
Fig. 3.
Quantitative kinetic analysis of P53 response to DNA damage in MCF7 cells. (A) Time course of Western blot analysis. MCF7 cells were treated, lysed, and analyzed by Western blotting as described in Fig. 2. (B) Time course of NCS response in MCF7. The amounts of Hdm2, Hdmx, and P53 per cell were determined as described in Fig. 2. Numbers shown in the box represent the protein molecules × 103 per cell. (C) P53 activation in MCF7. Time course of P53 target gene activation is shown. Induction of hdm2 and p21 genes was analyzed as described in Fig. 2.
These data indicate that an increase in the P53/Hdmx ratio favors p53 activation after stress. If this hypothesis is correct, then reduction or overexpression of Hdmx should augment or prevent p53-dependent transactivation, respectively. Short hairpin RNA mediated knockdown of Hdmx in MCF7 cells, resulted in a 40–50% reduction of Hdmx, and did increase basal P53 transcriptional activity by ≈2-fold but did not alter P53 protein abundance (SI Fig. 9). DNA damage resulted in subtle increases in P21 and Hdm2 mRNA induction, but the kinetic profile of P53 activation was similar to that of control cells (SI Fig. 9). Interestingly, DNA damage did not reduce further the Hdmx level in the Hdmx knockdown cells. This might explain why more significant induction of P53 target genes was not achieved by Hdmx knockdown.
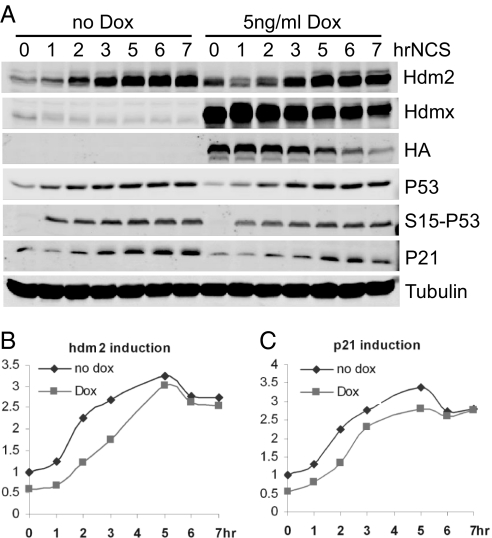
We then analyzed P53 activation in a U2OS cell line in which Hdmx levels could be varied by doxycycline to determine the effects of changing the P53/Hdmx ratio on P53 activation kinetics. Hdmx was induced to a level 10-fold greater than that of endogenous Hdmx, appeared to be nearly uniform in the population (SI Fig. 8), and did not affect P53 abundance (Fig. 4A). This indicates that, at this ratio of Hdmx/Hdm2, P53 stability is not affected. Basal P53 activity in cells overexpressing Hdmx was reduced by 50% compared with control cells (Fig. 4 B and C). NCS treatment again led to a 50% reduction of the overexpressed Hdmx. Surprisingly, the 10-fold overexpression of Hdmx had only subtle inhibitory effects on NCS-induced P53 activation (Fig. 4 B and C).
Fig. 4.
Quantitative kinetic analysis of P53 response in cells overexpressing Hdmx. (A) Time course of Western blot analysis. U2OS cells were either left untreated or treated with 5 ng/ml doxycycline (Dox) for 24 h to induce the expression of Hdmx before NCS treatment at the indicated time, followed by Western blotting as described in Fig. 2. (B and C) Time course of P53 target gene activation. Induction of hdm2 (B) and p21 (C) genes was analyzed as described in Fig. 2.
Changes in Stoichiometry After Non-DNA Damage-Induced P53 Activation.
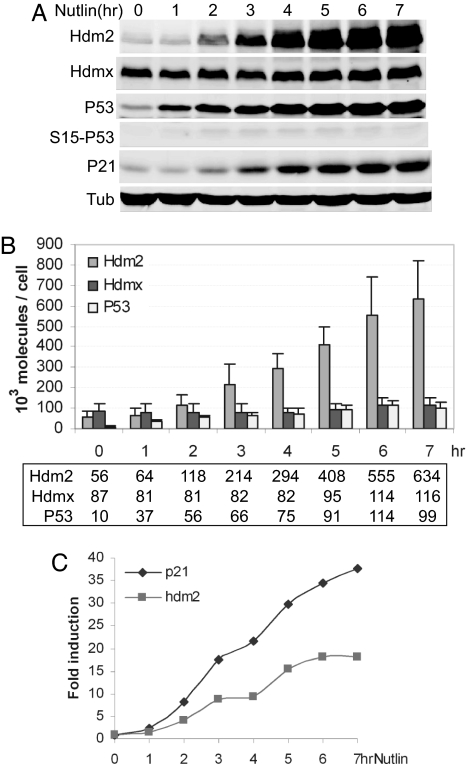
Taken together, the above data suggest that, in the absence of DNA damage, an excess of Hdmx and Hdm2 limit P53 function, whereas after DNA damage, the abundance of Hdm2 and Hdmx may be less important. Recently, small molecules such as Nutlin3a that stabilize P53 by disrupting the P53–Hdm2 interaction have been described (33). Nutlin3a activates P53 without inducing detectable posttranslational modifications (34) and, importantly, does not disrupt P53–Hdmx interaction (35–37). Consequently, Nutlin3a provides a tool for dissecting potential mechanistic differences between P53 activation by traditional genotoxins and the new generation of nongenotoxic P53 agonists.
Nutlin3a stabilized P53 in the absence of Ser-15 phosphorylation (Fig. 5A) and, even though Hdm2 levels increased significantly, did not induce Hdmx degradation in MCF7 cells (Fig. 5A and ref. 37). A comparison of NCS and Nutlin3a treatment revealed that between 0 and 3 h, P53 transactivation correlated with an increase in P53 abundance relative to Hdmx (Figs. 3 and 5). Importantly, the total levels of P53 never exceeded those of Hdmx or Hdm2 after NCS or Nutlin3a treatment (Figs. 3 and 5), even though its transcriptional activity increased in both cases after 1–2 h of treatment. Whereas P53 levels and activity decreased 3 h after NCS treatment, the converse was observed with Nutlin3a treatment, where P53 levels and transcriptional activity continued to increase. Although Hdm2 increased throughout the time course in both treatments, its ability to interact with and inhibit P53 was abrogated by autodegradation after NCS treatment (14) or by Nutlin3a (33). Together, these data raise the question of how P53 can be activated when its total molecular abundance does not exceed that of Hdmx, which has been proposed to be its main transcriptional antagonist.
Fig. 5.
Quantitative kinetic analysis of the P53 response to Nutlin in MCF7 cells. (A) Time course of Western blot analysis. MCF7 cells were treated with 10 μM Nutlin for the indicated times, followed by Western blotting as described in Fig. 2. (B) Time course of Nutlin response in MCF7. The amounts of Hdm2, Hdmx, and P53 per cell were determined as described in Fig. 2. Numbers shown in the box represent the protein molecules × 103 per cell. (C) P53 activation in MCF7. Time course of P53 target gene activation is shown. Induction of hdm2 and p21 genes was analyzed as described in Fig. 2.
Changes in Nuclear P53 Abundance Relative to Hdmx Correlate with the Onset of P53 Transactivation.
Hdm2- and Hdmx-dependent antagonism of P53 transactivation function must involve the nuclear fraction of these proteins, and dynamic subcellular redistribution of each protein in response to damage has been reported (38–40). We therefore fractionated cells and quantified P53, Hdm2, and Hdmx in both cytoplasmic and nuclear compartments. The purity of each subcellular fraction was validated by showing that PARP (41) was exclusively in the nuclear fraction, whereas α-tubulin (42) was present in the cytoplasm with little or no cross-contamination with nuclear components (SI Fig. 10).
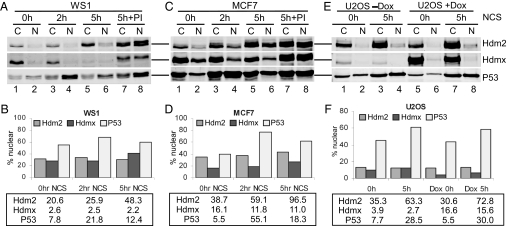
In exponentially growing cells, Hdm2 and Hdmx were mainly cytoplasmic, whereas P53 was evenly distributed between the cytoplasm and nucleus before DNA damage (Fig. 6). However, the combined nuclear abundance of Hdm2 and Hdmx exceed that of P53 under such conditions (Fig. 6, 0 h), and immunoprecipitation analysis shows that Hdm2 and Hdmx interact with P53 under such conditions (SI Fig. 11). The low basal activity of P53 under these conditions implies that the observed nuclear abundance of Hdm2 and Hdmx is sufficient to significantly attenuate P53 function.
Fig. 6.
Changes in protein subcellular distribution in response to DNA damage. (A and C) WS1 (A) or MCF7 (C) cells were either left untreated or treated with 300 ng/ml NCS for 2 and 5 h or NCS plus proteasome inhibitors for 5 h. (E) U2OS cells were either left untreated or treated with doxycycline and/or NCS as described in Fig. 4. Lysates from the nuclear fraction and the cytoplasmic fraction representing the same numbers of cells were analyzed by the Western blotting as described in Fig. 1. (B, D, and F) The charts representing the estimated protein molecules in the nuclear fraction. The y axis represents the percentage of each protein in the nuclear fraction. Numbers shown in the box represent the protein molecules × 103 per cell in the nuclear fraction.
Subcellular fractionation and quantification of P53, Hdm2, and Hdmx after DNA damage proved revealing. P53 activation began 2 h after NCS treatment, at which time its nuclear abundance increased significantly (Fig. 6 B and D, 2 h). Although nuclear Hdm2 levels exceeded those of P53 at all time points, Hdm2 was very unstable after DNA damage (Fig. 6 A and C, lane 8), limiting its interaction with P53 (SI Fig. 11 and ref. 14). Interestingly, although the total Hdmx decreased by half after the DNA damage (Figs. 2 and 3), the nuclear Hdmx level changed only slightly (Fig. 6, compare 0 h and 5 h). However, nuclear Hdmx was very unstable after DNA damage because proteasome inhibitors (PI) significantly increased its abundance (Fig. 6 A and C and SI Fig. 8). Furthermore, damage-destabilized Hdm2 and Hdmx associated poorly with P53, but, subsequent to their stabilization with PI, P53–Hdm2 and P53–Hdmx complexes were readily detected (SI Fig. 11).
As shown above, a 10-fold overexpression of Hdmx had little effect on P53 activation after DNA damage, although it was sufficient to reduce basal activity. Instead, P53 activity after damage correlated with its nuclear abundance (compare Figs. 4 and 6F, 5 h and Dox 5 h). Together, these data suggest that Hdm2 and Hdmx levels influence P53 basal activity, but after DNA damage, P53 level is the predominant factor that determines the magnitude of P53 activation. We suggest that Hdm2 and Hdmx become ineffective antagonists after DNA damage because of their preferential targeting to the proteasome, which appears to limit their ability to interact with P53.
Implications for P53 Control Mechanisms.
Here, we provide the first quantitative analysis of changes in the stoichiometry of endogenous P53, Hdm2, and Hdmx in response to P53-activating agents. The quantification of each protein in the nuclear compartment allowed us to gain further insight into how Hdm2 and Hdmx regulate P53 transactivation. Our data suggest two mechanisms for P53 regulation. First, Hdm2 and Hdmx can efficiently bind and suppress P53 activity in the absence of DNA damage. P53 activation by nongenotoxic agents such as Nutlin3a appears to involve P53 nuclear levels increasing to exceed those of Hdmx (Fig. 5 and SI Fig. 10), because Nutlin3a effectively limits P53–Hdm2 interaction. The second mechanism suggests that DNA damage-induced phosphorylation of Hdm2 and Hdmx increases the turnover rate of both proteins and prevents them from effectively antagonizing P53. The net effect is to increase P53 abundance, which determines the potency of the P53 transcriptional response. Consistent with our model, blocking damage-induced Hdm2 and Hdmx degradation by using proteasome inhibitors or appropriate phosphomutants enables their association with P53 to prevent P53 activation (14, 16, 17).
The models we have derived do not account for the higher-order complexes within which P53, Hdm2, Hdmx, and many other binding partners may associate and will likely benefit from future refinements. For example, transcriptionally active P53 is tetrameric (43). Hdm2 and Hdmx can also form homo- and heterodimers and higher-order structures (44, 45), and in vitro studies suggest that the Hdm2–Hdmx complex is a more stable and active than E3 ubiquitin ligase (46). However, we do not know how many P53 tetramers are present in cells with basal P53 activity, nor during activation, nor the fraction associated with chromatin. We also lack information concerning in vivo dissociation constants for each of these molecules, and we do not know how many molecules of Hdm2 or Hdmx are required to inhibit P53. One speculation is that effective inhibition requires interaction with Hdm2 and Hdmx together, perhaps as heterodimers or higher-order complexes (46), because embryonic lethality results from deletion of either Mdm2 or Mdmx (2–4), and Mdm2 alone is a relatively poor inhibitor of P53 transactivation (47, 48). The data presented here will provide a basis for developing more refined mathematical models of P53 pathway regulation based on known kinetics of P53 transcriptional activation as a function of P53, Hdm2, and Hdmx subcellular concentration. This should enable a detailed description of the molecular dynamics of this critical stress-regulated tumor suppressor pathway.
Materials and Methods
Additional procedures are discussed in SI Methods.
Protein Expression and Purification.
Plasmids pET-DEST-H10-Trx-Hdm2 and pET-DEST-H10-Trx-Hdmx were transformed into BL21(DE3). IPTG (1 mM final concentration) was added to the culture to induce protein expression. Cells were harvested in denaturing lysis buffer [6 M guanidine/100 mM phosphate buffer (pH 8)/10 mM imidazole]. Lysate was passed through a His-select cartridge (Sigma, St. Louis, MO) for protein purification. Partial purified recombinant proteins were run onto an 8% SDS/PAGE for protein separation and bands corresponding to Hdm2, Hdmx, and P53 were extracted by using ElutaTube protein extraction kit (Fermentas, Hanover, MD). The extractions were dialyzed and concentrated. Purified proteins were stored in 10% glycerol, 5 mM DTT, 300 mM NaCl, and 25 mM NaPO4 buffer (pH 7.5) at −20°C.
Pure Protein Quantification.
Ultrapure BSA (Sigma) was used as a standard for measuring the concentration of pure proteins. A280 was used to confirm the concentration of BSA, by using its extinction coefficient (ε = 43,824 M−1cm−1). BSA (400–25 ng) along with pure proteins were run on a gradient Bis-Tris gel (Invitrogen, Carlsbad, CA). The proteins were stained with SYPRO-Ruby (Molecular Probes, Eugene, OR) according to the manufacturer's instructions, and signals were quantified by Typhoon image analysis (Molecular Dynamics, Sunnyvale, CA).
Quantitative Western Blot Analysis of Cell Extracts.
After treatment, cells were counted before harvesting and lysis in RIPA buffer (100 μl per million cells). Lysates from equivalent cell numbers and serial dilutions of protein standard mixes containing Hdm2, Hdmx, and P53 recombinant proteins were run on SDS/PAGE and transferred to Immobilon-FL membrane (Millipore, Bedford, MA). A mixture of IF2 (Calbiochem, San Diego, CA), 4B2 (Calbiochem), and SMP14 (Santa Cruz Biotechnology, Santa Cruz, CA) mouse monoclonal antibodies were used to detect Hdm2. BL1258 (Bethyl Laboratories, Montgomery, TX) and FL393 (Santa Cruz Biotechnology) rabbit polyclonal antibodies were used to detect Hdmx and P53, respectively. Alexa Fluor 680-conjugated anti-rabbit IgG (Molecular Probes) and IRDye800 conjugated anti-mouse IgG (Rockland, Gilbertsville, PA) were used as secondary antibodies. All antibody dilutions were made in casein blocking solution (LiCor, Lincoln, NE). Signal intensities were analyzed by using the Odyssey infrared image system (LiCor).
Quantitative PCR.
RNA was isolated and subjected to real-time quantitative PCR as described (14).
Cell Fractionation.
Cells were trypsinized, pelleted at 500 × g, and resuspended in 200 μl of hypotonic lysis buffer [10 mM Hepes (pH 7.6)/10 mM NaCl/1.5 mM MgCl2/0.1% Nonidet P-40/10% glycerol, 0.5 mM DDT/0.4 mM PMSF/1 mM NaF/0.1 mM NaVO4/Complete Mini protease inhibitors (Roche, Indianapolis, IN)]. Lysates were incubated on ice for 15 min and centrifuged for 5 min at 1,000 × g. The supernatant was transferred to a new tube. Then, 100 μl of hypotonic lysis buffer was used to wash pellets, which were then combined with the previous supernatant to give the cytoplasmic fraction. The nuclear pellets were resuspended in 300 μl of RIPA buffer and incubated on ice for 15 min with periodic vortexing before centrifugation for 15 min at 16,000 × g. This final supernatant comprises the nuclear fraction.
Supplementary Material
Acknowledgments
We thank Michael Dyson (Sanger Institute, U.K.) for providing pDEST-N112-Trx plasmid; Alan Fersht, Caroline Blair, Kurt Krummel, Barbara Jaroszynski, and Sam Loase for their contributions to generating recombinant proteins; and Aart Jochemsen (Leiden University Center, The Netherlands) for providing p55 antibodies. This work was supported by National Cancer Institute Grants CA100845 and CA61449 (to G.M.W.) and the Chapman Fellowship.
Abbreviation
- NCS
neocarzinostatin.
Footnotes
The authors declare no conflict of interest.
This article is a PNAS Direct Submission.
This article contains supporting information online at www.pnas.org/cgi/content/full/0701497104/DC1.
References
- 1.Wahl GM, Stommel JM, Krummel KA, Wade M. In: 25 Years of p53 Research. Wiman K, Hainaut P, editors. Dordrecht, The Netherlands: Springer; 2005. pp. 73–113. [Google Scholar]
- 2.Jones SN, Roe AE, Donehower LA, Bradley A. Nature. 1995;378:206–208. doi: 10.1038/378206a0. [DOI] [PubMed] [Google Scholar]
- 3.Montes de Oca Luna R, Wagner DS, Lozano G. Nature. 1995;378:203–206. doi: 10.1038/378203a0. [DOI] [PubMed] [Google Scholar]
- 4.Parant J, Chavez-Reyes A, Little NA, Yan W, Reinke V, Jochemsen AG, Lozano G. Nat Genet. 2001;29:92–95. doi: 10.1038/ng714. [DOI] [PubMed] [Google Scholar]
- 5.Marine J-C, Francoz S, Maetens M, Wahl G, Toledo F, Lozano G. Cell Death Differ. 2006;13:927–934. doi: 10.1038/sj.cdd.4401912. [DOI] [PubMed] [Google Scholar]
- 6.Saito S, Goodarzi AA, Higashimoto Y, Noda Y, Lees-Miller SP, Appella E, Anderson CW. J Biol Chem. 2002;277:12491–12494. doi: 10.1074/jbc.C200093200. [DOI] [PubMed] [Google Scholar]
- 7.Sakaguchi K, Saito S, Higashimoto Y, Roy S, Anderson CW, Appella E. J Biol Chem. 2000;275:9278–9283. doi: 10.1074/jbc.275.13.9278. [DOI] [PubMed] [Google Scholar]
- 8.Jabbur JR, Tabor AD, Cheng X, Wang H, Uesugi M, Lozano G, Zhang W. Oncogene. 2002;21:7100–7113. doi: 10.1038/sj.onc.1205856. [DOI] [PubMed] [Google Scholar]
- 9.Appella E, Anderson CW. Eur J Biochem. 2001;268:2764–2772. doi: 10.1046/j.1432-1327.2001.02225.x. [DOI] [PubMed] [Google Scholar]
- 10.Krummel KA, Lee CJ, Toledo F, Wahl GM. Proc Natl Acad Sci USA. 2005;102:10188–10193. doi: 10.1073/pnas.0503068102. [DOI] [PMC free article] [PubMed] [Google Scholar]
- 11.Feng L, Lin T, Uranishi H, Gu W, Xu Y. Mol Cell Biol. 2005;25:5389–5395. doi: 10.1128/MCB.25.13.5389-5395.2005. [DOI] [PMC free article] [PubMed] [Google Scholar]
- 12.Thompson T, Tovar C, Yang H, Carvajal D, Vu BT, Xu Q, Wahl GM, Heimbrook DC, Vassilev LT. J Biol Chem. 2004;279:53015–53022. doi: 10.1074/jbc.M410233200. [DOI] [PubMed] [Google Scholar]
- 13.Kawai H, Wiederschain D, Kitao H, Stuart J, Tsai KK, Yuan ZM. J Biol Chem. 2003;278:45946–45953. doi: 10.1074/jbc.M308295200. [DOI] [PubMed] [Google Scholar]
- 14.Stommel JM, Wahl GM. EMBO J. 2004;23:1547–1556. doi: 10.1038/sj.emboj.7600145. [DOI] [PMC free article] [PubMed] [Google Scholar]
- 15.Okamoto K, Kashima K, Pereg Y, Ishida M, Yamazaki S, Nota A, Teunisse A, Migliorini D, Kitabayashi I, Marine J-C, et al. Mol Cell Biol. 2005;25:9608–9620. doi: 10.1128/MCB.25.21.9608-9620.2005. [DOI] [PMC free article] [PubMed] [Google Scholar]
- 16.Pereg Y, Shkedy D, de Graaf P, Meulmeester E, Edelson-Averbukh M, Salek M, Biton S, Teunisse AF, Lehmann WD, Jochemsen AG, et al. Proc Natl Acad Sci USA. 2005;102:5056–5061. doi: 10.1073/pnas.0408595102. [DOI] [PMC free article] [PubMed] [Google Scholar]
- 17.Chen L, Gilkes DM, Pan Y, Lane WS, Chen J. EMBO J. 2005;24:3411–3422. doi: 10.1038/sj.emboj.7600812. [DOI] [PMC free article] [PubMed] [Google Scholar]
- 18.Meulmeester E, Maurice MM, Boutell C, Teunisse AF, Ovaa H, Abraham TE, Dirks RW, Jochemsen AG. Mol Cell. 2005;18:565–576. doi: 10.1016/j.molcel.2005.04.024. [DOI] [PubMed] [Google Scholar]
- 19.LeBron C, Chen L, Gilkes DM, Chen J. EMBO. 2006;25:1196–1206. doi: 10.1038/sj.emboj.7601032. [DOI] [PMC free article] [PubMed] [Google Scholar]
- 20.Momand J, Zambetti GP, Olson DC, George D, Levine AJ. Cell. 1992;69:1237–1245. doi: 10.1016/0092-8674(92)90644-r. [DOI] [PubMed] [Google Scholar]
- 21.Shvarts A, Steegenga WT, Riteco N, van Laar T, Dekker P, Bazuine M, van Ham RC, van der Houven van Oordt W, Hateboer G, van der Eb AJ, et al. EMBO J. 1996;15:5349–5357. [PMC free article] [PubMed] [Google Scholar]
- 22.Momand J, Jung D, Wilczynski S, Niland J. Nucleic Acids Res. 1998;26:3453–3459. doi: 10.1093/nar/26.15.3453. [DOI] [PMC free article] [PubMed] [Google Scholar]
- 23.Riemenschneider MJ, Buschges R, Wolter M, Reifenberger J, Bostrom J, Kraus JA, Schlegel U, Reifenberger G. Cancer Res. 1999;59:6091–6096. [PubMed] [Google Scholar]
- 24.Danovi D, Meulmeester E, Pasini D, Migliorini D, Capra M, Frenk R, de Graaf P, Francoz S, Gasparini P, Gobbi A, et al. Mol Cell Biol. 2004;24:5835–5843. doi: 10.1128/MCB.24.13.5835-5843.2004. [DOI] [PMC free article] [PubMed] [Google Scholar]
- 25.de Graaf P, Little NA, Ramos YF, Meulmeester E, Letteboer SJ, Jochemsen AG. J Biol Chem. 2003;278:38315–38324. doi: 10.1074/jbc.M213034200. [DOI] [PubMed] [Google Scholar]
- 26.Pan Y, Chen J. Mol Cell Biol. 2003;23:5113–5121. doi: 10.1128/MCB.23.15.5113-5121.2003. [DOI] [PMC free article] [PubMed] [Google Scholar]
- 27.Sharp DA, Kratowicz SA, Sank MJ, George DL. J Biol Chem. 1999;274:38189–38196. doi: 10.1074/jbc.274.53.38189. [DOI] [PubMed] [Google Scholar]
- 28.Stad R, Little NA, Xirodimas DP, Frenk R, van der Eb AJ, Lane DP, Saville MK, Jochemsen AG. EMBO Rep. 2001;2:1029–1034. doi: 10.1093/embo-reports/kve227. [DOI] [PMC free article] [PubMed] [Google Scholar]
- 29.Bond GL, Hu W, Bond EE, Robins H, Lutzker SG, Arva NC, Bargonetti J, Bartel F, Taubert H, Wuerl P. Cell. 2004;119:591. doi: 10.1016/j.cell.2004.11.022. [DOI] [PubMed] [Google Scholar]
- 30.Mendrysa SM, O'Leary KA, McElwee MK, Michalowski J, Eisenman RN, Powell DA, Perry ME. Genes Dev. 2006;20:16–21. doi: 10.1101/gad.1378506. [DOI] [PMC free article] [PubMed] [Google Scholar]
- 31.Linares LK, Hengstermann A, Ciechanover A, Muller S, Scheffner M. Proc Natl Acad Sci USA. 2003;100:12009–12014. doi: 10.1073/pnas.2030930100. [DOI] [PMC free article] [PubMed] [Google Scholar]
- 32.Li M, Chen D, Shiloh A, Luo J, Nikolaev AY, Qin J, Gu W. Nature. 2002;416:648–653. doi: 10.1038/nature737. [DOI] [PubMed] [Google Scholar]
- 33.Vassilev LT, Vu BT, Graves B, Carvajal D, Podlaski F, Filipovic Z, Kong N, Kammlott U, Lukacs C, Klein C, et al. Science. 2004;303:844–848. doi: 10.1126/science.1092472. [DOI] [PubMed] [Google Scholar]
- 34.Tovar C, Rosinski J, Filipovic Z, Higgins B, Kolinsky K, Hilton H, Zhao X, Vu BT, Qing W, Packman K, et al. Proc Natl Acad Sci USA. 2006;103:1888–1893. doi: 10.1073/pnas.0507493103. [DOI] [PMC free article] [PubMed] [Google Scholar]
- 35.Patton JT, Mayo LD, Singhi AD, Gudkov AV, Stark GR, Jackson MW. Cancer Res. 2006;66:3169–3176. doi: 10.1158/0008-5472.CAN-05-3832. [DOI] [PubMed] [Google Scholar]
- 36.Hu B, Gilkes DM, Farooqi B, Sebti SM, Chen J. J Biol Chem. 2006;281:33030–33035. doi: 10.1074/jbc.C600147200. [DOI] [PubMed] [Google Scholar]
- 37.Wade M, Wong ET, Tang M, Stommel JM, Wahl GM. J Biol Chem. 2006;281:33036–33044. doi: 10.1074/jbc.M605405200. [DOI] [PubMed] [Google Scholar]
- 38.Lu W, Pochampally R, Chen L, Traidej M, Wang Y, Chen J. Oncogene. 2000;19:232–240. doi: 10.1038/sj.onc.1203262. [DOI] [PubMed] [Google Scholar]
- 39.Migliorini D, Danovi D, Colombo E, Carbone R, Pelicci PG, Marine JC. J Biol Chem. 2002;277:7318–7323. doi: 10.1074/jbc.M108795200. [DOI] [PubMed] [Google Scholar]
- 40.Li C, Chen L, Chen J. Mol Cell Biol. 2002;22:7562–7571. doi: 10.1128/MCB.22.21.7562-7571.2002. [DOI] [PMC free article] [PubMed] [Google Scholar]
- 41.Vidaković M, Koester M, Goetze S, Winkelmann S, Klar M, Poznanović G, Bode J. J Cell Biochem. 2005;96:555–568. doi: 10.1002/jcb.20516. [DOI] [PubMed] [Google Scholar]
- 42.Piperno G, LeDizet M, Chang XJ. J Cell Biol. 1987;104:289–302. doi: 10.1083/jcb.104.2.289. [DOI] [PMC free article] [PubMed] [Google Scholar]
- 43.Hupp TR, Lane DP. Curr Biol. 1994;4:865–875. doi: 10.1016/s0960-9822(00)00195-0. [DOI] [PubMed] [Google Scholar]
- 44.Poyurovsky M, Priest C, Kentsis A, Borden K, Pan Z, Pavletich N, Prives C. EMBO. 2007;26:90–101. doi: 10.1038/sj.emboj.7601465. [DOI] [PMC free article] [PubMed] [Google Scholar]
- 45.Uldrijan S, Pannekoek W-J, Vousden KH. EMBO. 2007;26:102–112. doi: 10.1038/sj.emboj.7601469. [DOI] [PMC free article] [PubMed] [Google Scholar]
- 46.Singh RK, Iyappan S, Scheffner M. J Biol Chem. 2007;282:10901–10907. doi: 10.1074/jbc.M610879200. [DOI] [PubMed] [Google Scholar]
- 47.Toledo F, Krummel KA, Lee CJ, Liu C-W, Rodewald L-W, Tang M, Wahl GM. Cancer Cell. 2006;9:273. doi: 10.1016/j.ccr.2006.03.014. [DOI] [PubMed] [Google Scholar]
- 48.Migliorini D, Denchi EL, Danovi D, Jochemsen A, Capillo M, Gobbi A, Helin K, Pelicci PG, Marine JC. Mol Cell Biol. 2002;22:5527–5538. doi: 10.1128/MCB.22.15.5527-5538.2002. [DOI] [PMC free article] [PubMed] [Google Scholar]
Associated Data
This section collects any data citations, data availability statements, or supplementary materials included in this article.


