

Abstract
The O6-alkylguanine-DNA alkyltransferase (AGT) repairs O6-alkylguanine and O4-alkylthymine adducts in single-stranded and duplex DNAs. Here we characterize the binding of AGT to single-stranded DNAs ranging in length from 5 to 78 nt. Binding is moderately cooperative (37.9 ± 3.0 ≤ ω ≤ 89.8 ± 8.9), resulting in an all-or-nothing association pattern on short templates. This cooperativity contrasts with the isolated binding seen in recent crystal structures of AGT-DNA complexes. The statistical binding site size S (mean = 5.2 ± 0.1) oscillates with increasing template length. The oscillation period (4.10 ± 0.02 nt/protein) is nearly identical to the binding site size obtained at the highest known binding density (S = 4 nt/protein) and is significantly smaller than the contour length (~8 bp) occupied in crystalline complexes. A model in which AGT proteins overlap along the DNA contour is proposed to account for these features. Oscillations in intrinsic binding constant Ki and cooperativity factor ω have the same frequency but are of opposite phase to S, with the result that the most stable protein-protein and protein-DNA interactions occur at the highest packing densities. We hypothesize that modest binding cooperativity and high binding densities are adaptations that allow AGT to efficiently search for lesions in the context of chromatin remodeling and DNA replication.
DNA repair is crucial for the preservation of cell viability and genetic heredity in the presence of environmental, cellular and chemical mutagens. The ubiquitous repair protein, O6-alkylguanine-DNA alkyltransferase1 (AGT, also called O6-methylguanine DNA methyltransferase, MGMT) plays an essential role in maintaining genomic integrity by repairing O6-alkylguanine and O4-alkylthymine adducts that form in DNA exposed to alkylating agents (1–3). Both adducts are mutagenic and carcinogenic (1,4,5), while O6-alkylguanine adducts are also strongly cytotoxic (6). Ironically, AGT also protects cells against chemotherapeutic drugs that methylate or chloroethylate DNA (6,7). Clinical trials of AGT-inhibitors are underway, in an attempt to increase the efficacy of DNA-alkylating drugs in cancer chemotherapy (8–10). In spite of the interest focused on AGT as a result of its relevance to cancer, relatively little is known about its mechanisms of interaction with DNA and with proteins in its environment.
Human AGT is a monomeric protein (207 amino acids, Mr = 21,519) that is expressed constitutively in normal cells (3,7,11). It binds DNA with modest affinity, significant cooperativity and little sequence-specificity (12–14). In binding it discriminates only weakly between single-stranded and duplex structures (13,14) and it repairs O6-alkylguanine lesions in both single stranded and duplex DNAs (15–17). In the repair reaction, each protein molecule catalyzes the transfer of a single alkyl group from the O6 position of guanine or O4 position of thymine to an active-site cysteine (C145 in the human protein). This reaction returns the DNA base to an unmodified state and permanently inhibits the alkyl-acceptor activity of the enzyme2 which is ultimately degraded (2,18). As a consequence of this life cycle, the number of O6-alkylguanine and O4-alkylthymine adducts that can be repaired at one time depends on the steady-state cellular concentration of the un-alkylated form of AGT (2,3) and on its ability to partition between DNA-lesion sites and the vast amount of genomic DNA in which they are embedded.
Three considerations motivate this characterization of AGT binding to single-stranded oligonucleotides. First, the enzyme binds single-stranded DNAs in vitro, with affinities close to those observed with duplex DNAs (13,14). Although repair rates have been found to be slower with single-stranded templates than with duplex (19), it remains possible that the repair of single-stranded templates might be a normal function of AGT within the cell. A better understanding of AGT interactions with single-stranded DNAs will contribute to our ability to test the novel possibility. Second, oligonucleotides containing O6-alkylguanine offer advantages over the mononucleotide inhibitors currently under clinical trial. Important among these are improved water-solubility, greater reactivity with AGT and efficacy against O6-benzylguanine-resistant AGT mutants (20,21). A better understanding of the interactions of the enzyme with single-stranded DNAs may guide the development of therapeutically-useful oligonucleotide inhibitors. Finally, recent crystal structures of AGT-DNA complexes depict the isolated binding of enzyme molecules to duplex DNA3 (22). This contrasts with the close-packed, cooperative pattern of binding observed in free solution with both single-stranded and duplex templates ((14), this work) and suggests that binding in free solution may involve a different ensemble of molecular contacts than is present in the crystal structures. A more complete characterization of cooperative AGT-DNA interactions may help us to account for this difference.
EXPERIMENTAL PROCEDURES
Enzymes and Reagents
T4 polynucleotide kinase was purchased from New England Biolabs. [γ-32P]ATP was from ICN Radiochemicals. Electrophoresis grade polyacrylamide was from Fisher. All other chemicals were reagent-grade or better.
Human AGT Protein
Recombinant human AGT protein (tagged with His6 at its C-terminal end; AGT) was purified to apparent homogeneity according to published protocols (22). Samples were stored at −80°C until needed. The purity of the protein was verified by SDS-gel electrophoresis followed by silver-staining (23,24). Sedimentation equilibrium data were consistent with a single species with Mr = 21,860 ± 400 (result not shown). This value agrees well with previous measurements (13) and is consistent with the value (Mr = 21,614) predicted from the sequence of this variant of the protein. The preparations used were >95% active in transfer of methyl groups from O6-[3H]methyl guanine-labeled calf-thymus DNA to AGT and >95% active in debenzoylating O6-benzylguanine, as previously described (25,26). AGT concentrations were measured spectrophotometrically using a molar extinction coefficient, ε280 = 3.93 × 10⁴ M−1 cm−1, calculated from data of Roy et al. (27). Values of ε215/ε280 = 8.2 and ε260/ε280 = 0.63 were obtained from UV spectra of the purified protein dissolved in 10mM Tris buffer, pH 7.6, at 21°C.
DNA substrates
Oligodeoxyribonucleotides of 5, 7, 9, 11, 16, 22, 24, 30, 41 and 78 residues (sequences shown in Table 1) were synthesized by the Macromolecular Core Facility of the Penn State College of Medicine or were purchased from Operon. These DNA sequences, were previously used in studies of DNA binding and/or repair by AGT (c.f., (13,28)). In addition, they were selected for a low propensity to form double-stranded secondary structures, as predicted by web-based programs Oligonucleotide Properties Calculator (http://www.basic.northwestern.edu/biotools/oligocalc.html) or dnaMATE (http://dna.bio.puc.cl/tm.html (29)). All DNAs were purified by NENsorb chromatography, as directed by the manufacturer. Oligonucleotides of 5, 7 and 9 nt were equilibrated with 10mM Tris (pH 8.0 at 20°C), 1mM EDTA buffer by chromatography through short Biogel P2 columns. Longer DNA molecules were dialyzed to equilibrium against the same buffer, prior to use. DNA samples for electrophoretic mobility shift analysis were labeled at 5' termini with 32P as described by Maxam & Gilbert (30). Unincorporated [γ32P]-ATP removed by buffer exchange using Biogel P2 centrifuge columns, pre-equilibrated with 10 mM Tris (pH 8.0 at 21°C) 1mM EDTA. Single-stranded DNA concentrations were measured spectrophotometrically, using extinction coefficients calculated by the nearest-neighbor method (31,32). Depending on base composition and sequence, values of ε260 ranged from 8.45 × 10³ M−1 cm−1 to 1.04 × 10⁴ M−1 cm−1 (per base).
Table 1.
Oligonucleotides
| Length, nt | Sequence | Mr Predicteda | Mr Observedb |
|---|---|---|---|
| 5 | 5’-TTG TT-3’ | 1,484 | 1,470 ± 285 |
| 7 | 5’-GGG TGG G-3’ | 2,218 | 2,170 ± 160 |
| 9 | 5’-TTT TGT TTT | 2,701 | 2,650 ± 220 |
| 11 | 5’-TTT TTG TTT TT-3’ | 3,310 | 3,430 ± 260 |
| 16 | 5’-GAC TGA CTG ACT GAC T-3’ | 4,882 | 4,804 ± 292 |
| 22 | 5’-CGC CAA CCC GCT GCC TAT CGT T-3’ | 6,608 | 6,690 ± 360 |
| 24 | 5’-TTT TTT TTT TTT TTT TTT TTT TTT-3’ | 7,239 | 7,125 ± 320 |
| 30 | 5’-GTG CCG CCA ACC CGC TGC CTA TCG TTA TAC-3’ | 9,078 | 9,205 ± 715 |
| 41 | 5’-GCA ACG CAA TTA ATG TGA GTT AGC TCA CTC
ATT AGG CAC CC-3’ |
12,554 | 12,320 ± 680 |
| 78 | 5'- GTG GTC TGC AGC AGC GGA GCC GTG GGC AAC
TAC CGC TGG GGC GTG TCG CGT AAG GAA TGG CTT CTG GCC CAT GAA GGC -3' |
24,273 | 24,100 ± 1,130 |
Anhydrous values predicted from sequence.
Measured at sedimentation equilibrium in 10mM Tris (pH 7.6 at 20°C), 1mM DTT, 1mM EDTA, 100mM NaCl. The error ranges are 95% confidence limits. The agreement of measured and predicted values indicates that steric and electrostatic non-idealities are not significant under these conditions.
Electrophoretic mobility shift assays (EMSA)
Binding reactions were carried out at 20 ± 1 °C in 10mM Tris (pH 7.6), 100 mM NaCl, 1mM dithiothreitol, and 10μg/mL bovine serum albumin. Protein-DNA complexes were formed by adding appropriate amounts of AGT to solutions containing 32P-labeled oligodeoxyribonucleotides. Mixtures were equilibrated at 20 (±1) °C for 30 min. Duplicate samples incubated for longer periods gave identical results, indicating that equilibrium had been attained (result not shown). Electrophoresis was carried out in 10% polyacrylamide gels (acrylamide:N,N'-methylene bisacrylamide = 75), cast and run at 8V/cm in buffer consisting of 10mM Tris-acetate, pH 7.6, supplemented with NaCl to match the conductivity of the protein-DNA samples (33). Autoradiographs were obtained with Kodak X-Omat Blue XB-1 film, exposed at 4 °C. Gel segments containing individual electrophoretic species were excised using the developed film as a guide and counted in a scintillation counter by the Cerenkov method. Similar results were obtained by densitometry of appropriately-exposed autoradiographic films.
The serial dilution method (34,35,47) was used to obtain self-consistent estimates of binding stoichiometry (n) and the association constant (Kn). For the cooperative binding mechanism nP + D ⇄ PnD, the association constant is Here P represents AGT protein, D represents DNA and PnD the AGT-DNA complex of protein-DNA ratio n. Separating variables and taking logarithms gives
| (1) |
Dilution of an AGT-DNA mixture changes [PnD]/[D] by mass action while maintaining the ratio of [P]total to [D] total. The free protein concentration at each dilution step can be estimated using [P]free = [P]input – n[PnD] starting with an initial value of n; equation 1 is then used to calculate a new value of n from the DNA-binding distribution. This value is then used to calculate a new estimate of [P]free. These calculations are repeated recursively until values of n converge.
In many cases stoichiometries, association constants and cooperativity parameters were evaluated by direct titration. Solutions of AGT protein (typically 5 × 10⁻⁷ M ≤ [AGT] ≤ 3 × 10⁻⁴ M) were added directly to 32P-DNA solutions (typically ~5 × 10⁻⁸M) and samples were analyzed by native gel electrophoresis. Because the total concentration of protein binding sites on DNA was always significantly less than that of the protein, the approximation [P] = [P]free was used. The dependence of binding density n on the free protein concentration [P] was given by the McGhee-von Hippel isotherm (36) as modified by Record et al. (37) to account for finite lattice size (Eq.2).
| (2) |
Here n is the binding density (protein molecules/nucleotide), K is the equilibrium association constant for binding a single site, ω is the cooperativity parameter, N is the length of the DNA in nucleotides and s is the size of the site (in nucleotides) that a protein molecule occupies to the exclusion of others. In this context, the cooperativity parameter ω is equal to the equilibrium constant for the process of moving a protein from an isolated site to a singly-contiguous one, or from a singly-contiguous site to a doubly-contiguous one. Thus, it is a measure of the population-averaged equilibrium constant for interaction between proteins occupying adjacent sites on the DNA.
Analytical ultracentrifugation
Human AGT protein and oligodeoxyribonucleotides were dialyzed against 10mM Tris (pH 7.6), 1mM DTT, 1mM EDTA, 100mM NaCl. Analytical ultracentrifugation was performed at 20 ± 0.1°C in a Beckman XL-A centrifuge using an AN60Ti rotor. Most scans were obtained at 252 nm to minimize protein contribution to the DNA signal (38), although some data sets were obtained at 260 nm. Equilibrium was held to be attained when scans taken 6h apart were indistinguishable. Typically, equilibration times ≥24h met this criterion for AGT-DNA mixtures. Five scans were averaged for each sample at each wavelength and rotor speed.
For DNAs with small numbers of protein-interaction sites, cooperative binding can be described by the simple mechanism nP + D ⇄ PnD in which free DNA (D) is in equilibrium with saturated complex (PnD) but intermediates with sub-saturating protein stoichiometries are not present at significant concentrations. At sedimentation equilibrium, the radial distribution of absorbance for such a system is given by equation 3.
| (3) |
Here A(r) is the absorbance at radial position r and αP, αD and αPnD are absorbances of protein, DNA and protein-DNA complex at the reference position, ro. and ε is a baseline offset that accounts for radial position-independent differences in the absorbances of different cell assemblies. The reduced molecular weights of AGT protein, DNA and protein-DNA complexes are given by and . Here MP and MD are the molecular weights of protein and DNA, n is the protein:DNA ratio of the complex; r is the solvent density, ω, the rotor angular velocity, R is the gas constant and T the temperature (Kelvin). The partial specific volume of AGT was calculated by the method of Cohn and Edsall (39), using partial specific volumes of amino acids tabulated by Laue and co-workers (40). The partial specific volume of single-stranded NaDNA at 0.1M NaCl (0.502 ml/g) was estimated by interpolation of the data of Cohen and Eisenberg (41). Partial specific volumes of each protein-DNA complex were estimated using Eq. 4.
| (4) |
This relationship is based on the assumption that there is no significant change in partial specific volumes of the components upon association. This approach has been used successfully for other protein-protein and protein-DNA interactions (42–44) although there are notable exceptions (45). Estimated with Eq. 4, for the complexes described here. Accordingly, a 1 percent error in our estimate of results in an error in MPnD of nearly 3 percent. However, a comparison of stoichiometries estimated by sedimentation equilibrium and EMSA methods (Table 2) suggests that errors in are unlikely to be large. Equation 3 was used in global analysis of multiple data sets obtained at different macromolecular concentrations and rotor speeds (46). In this method, the values of αP, αD, αPnD and ε are unique to each sample but the value of n must be common to all data sets. Terms accounting for non-ideal effects were not included because there was no evidence of nonideality (C.f., Table 1).
Table 2.
Stoichiometries of AGT-DNA Complexes
| DNA Length, nt | Mr (Complex)a | Stoichiometry | S nt/protein |
|---|---|---|---|
| 5 | 23,746 ± 648 | 1.03 ± 0.03a | 4.85 ± 0.15a |
| 7 | 24,697 ± 432 | 1.04 ± 0.02a | 6.83 ± 0.15a |
| 9 | 44,632 ± 1,297 | 1.94 ± 0.06a | 4.63 ± 0.13a |
| 11 | 43,080 ± 1,299 | 1.84 ± 0.06a | 5.97 ± 0.19a |
| 1.92 ± 0.17b | 5.72 ± 0.2b | ||
| 16 | 91,770 ± 4,539 | 4.02 ± 0.21a | 3.98 ± 0.15a |
| 3.89 ± 0.09b | 4.11 ± 0.1b | ||
| 22 | - | 3.89 ± 0.16b | 5.65 ± 0.22b |
| 24 | - | 5.60 ± 0.5b | 4.36 ± 0.4b |
| 30 | 123,632 ± 4,323 | 5.3 ± 0.2a | 5.66 ± 0.15a |
| 5.32 ± 0.42b | 5.63 ± 0.48b | ||
| 41 | - | 5.89 ± 1.1b | 6.96 ± 1.0b |
| 78 | 216,638 ± 6,268 | 8.90 ± 0.29a | 8.76 ± 0.29a |
Determined by sedimentation equilibrium analysis. The error ranges are 95% confidence limits.
Determined by EMSA. The error ranges are 95% confidence limits.
RESULTS
Determination of stoichiometries
Human AGT binds single-stranded and duplex DNAs with significant cooperativity (13,14). When short single-stranded DNAs (ssDNAs) are titrated with AGT, the major DNA species present at equilibrium are free DNA and the saturated protein-DNA complex (Figure 1). The electrophoretic mobilities of these AGT complexes decrease with increasing DNA length (not shown), but protein-DNA stoichiometries cannot be reliably estimated from this effect (33,35). Accordingly, we have used sedimentation equilibrium analyses to establish the stoichiometries of the protein-DNA complexes formed with single stranded DNAs of 5, 7, 9, 11, 16, 30 and 78 nucleotides (representative data are shown in Figure 2). In each case the data are fit by the sedimentation equation corresponding to the concerted binding model (nP + D ⇄ PnD; Eq. 3). The small, symmetrical residuals (upper panels) indicate that this model is consistent with the mass distributions present in these samples. Molecular weights of protein-DNA complexes and free DNAs were obtained as parameters of these fits4. The stoichiometry of each complex was inferred from the known molecular weights of the DNA and AGT protein and the results are summarized in Table 2. The masses and stoichiometries of complexes formed with single stranded 16-, 30- and 78-mers were within error the same as values previously reported for analogous complexes formed with full-length human AGT protein prepared without the C-terminal (His)6-tag (13). These results confirm our previous conclusion that the presence of the C-terminal (His)6-tag has negligible effect on affinity and stoichiometry of AGT-DNA complexes (14). Under comparable solution conditions, increasing DNA length resulted in complexes of higher stoichiometry, indicating that for the DNA concentration range explored here, and under conditions of AGT-excess, stoichiometry is limited by the number of binding sites available on each DNA.
Fig. 1.
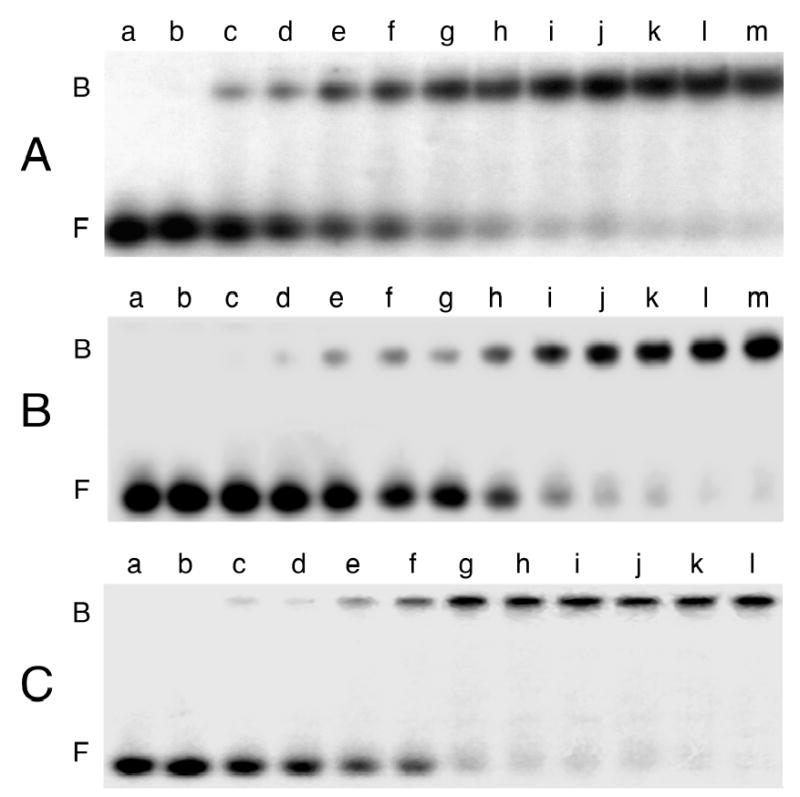
Titration of representative single-stranded DNAs with human AGT. Panel A: 11-mer oligonucleotide (8.8 × 10⁻⁷ M). The concentrations of AGT in samples shown in lanes a-m were respectively 0M, 1.3 × 10⁻⁶ M, 2.6 × 10⁻⁶ M, 3.9 × 10⁻⁶ M, 5.2 × 10⁻⁶ M, 6.5 × 10⁻⁶ M, 8.0 × 10⁻⁶ M, 9.5 × 10⁻⁶ M, 1.3 × 10⁻⁵ M, 2.6 × 10⁻⁵ M, 3.9 × 10⁻⁵ M, 5.2 × 10⁻⁵ M, 6.5 × 10⁻⁵ M. Panel B: 22-mer oligonucleotide (3.6 × 10⁻⁷ M). The concentrations of AGT in samples shown in lanes a-m were, respectively, 0 M, 2.6 × 10⁻⁷ M, 5.1 × 10⁻⁷ M, 7.5 × 10⁻⁷ M, 9.4 × 10⁻⁷ M, 1.3 × 10⁻⁶ M, 1.9 × 10⁻⁶ M, 2.6 × 10⁻⁶ M, 3.8 × 10⁻⁶ M, 5.1 × 10⁻⁶ M, 7.5 × 10⁻⁶ M, 1.1 × 10⁻⁵ M, 1.5 × 10⁻⁵ M. Panel C: 41-mer oligonucleotide (3.9 × 10⁻⁷ M). The concentrations of AGT in samples shown in lanes a-l were, respectively 0 M, 4.8 × 10⁻⁷ M, 7.2 × 10⁻⁷ M, 1.6 × 10⁻⁶ M, 3.2 × 10⁻⁶ M, 4.8 × 10⁻⁶ M, 6.6 × 10⁻⁶ M, 7.2 × 10⁻⁶ M, 9.4 × 10⁻⁶ M, 1.6 × 10⁻⁵ M, 3.2 × 10⁻⁵ M, 4.8 × 10⁻⁵ M. Binding reactions were carried out at 20 ± 1 °C and samples were resolved on 10% polyacrylamide gels, as described in Experimental Procedures. Band designations B, bound DNA; F, free DNA.
Fig. 2.
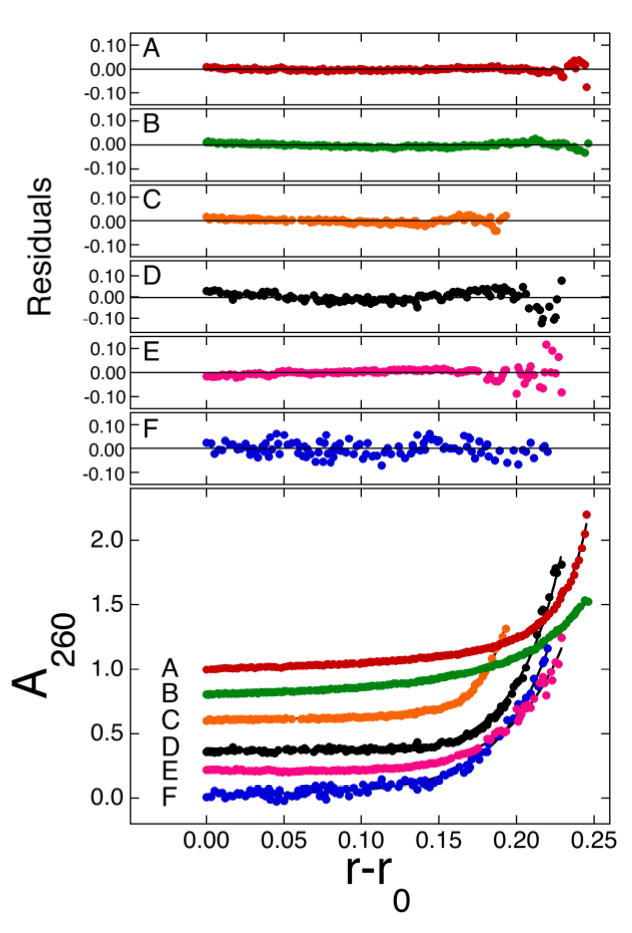
Sedimentation equilibrium of solutions containing AGT and single-stranded DNAs at 20 ± 1 °C. Representative data for 78, 30, 16, 11, 7 and 5 nt DNAs (traces A–F, respectively) have been graphed with vertical offsets to improve clarity. Samples contained AGT (initial concentrations ranged from 1.2 × 10⁻⁶ M to 4.8 × 10⁻⁶ M) in buffer consisting of 10 mM Tris (pH 7.6), 1 mM DTT, 1 mM EDTA, 100 mM NaCl. In addition, they contained 1 × 10⁻⁷ M 78mer DNA (sample A); 5 × 10⁻⁷ M 30mer DNA (sample B); 4 × 10⁻⁷ M 16mer DNA (sample C); 1.9 × 10⁻⁶ M 11mer DNA (sample D); 3.6 × 10⁻⁶ M 7mer DNA (sample E); 2.6 × 10⁻⁶ M 5mer DNA (sample F). Rotor speeds for data sets A–F were 20,000 rpm, 20,000 rpm, 27,000 rpm, 32,000 rpm, 32,000 rpm and 41,000 rpm, respectively. The smooth curves correspond to global fits of Eq. 3 to data sets obtained for each oligonucleotide at 2 [AGT]:[DNA] ratios and 3 rotor speeds (typically the rotor speed of the data shown in this figure (rpm) and (rpm/1.4) and (rpm/2.8)). The small residuals, nearly symmetrically-distributed about zero (upper panels) indicate that the cooperative nP + D ⇄ PnD model is consistent with the mass distributions of DNA in these samples.
Additional stoichiometry values were determined by native gel electrophoresis (EMSA) using the serial dilution procedure (34,35,47). A representative experiment showing mass-action dissociation of the AGT complex formed with a single-stranded 24-mer DNA is shown in Fig. 3A. As with forward titrations, no stoichiometric intermediates (expected to migrate between free DNA and saturated complex bands) were detectable. A graph of ln[PnD]/[D] as a function of ln[P] is shown in Fig. 3B. The slope of this graph around the mid-point of the binding reaction yields an apparent stoichiometry of 5.6 ± 0.5 and -n ln [P]free, midpoint = ln Kn, the natural logarithm of the association constant for the overall reaction. The stoichiometry values obtained for binding single-stranded 11-, 16-, 22-, 24-, 30- and 41-mers are summarized in Table 2 and values of Kn in Table 3. The agreement of stoichiometry values determined by EMSA with those obtained by sedimentation equilibrium indicates that the same complexes are detected by both methods and demonstrates that dissociation of complexes during electrophoresis is not a significant factor under the conditions that were used here.
Fig. 3.
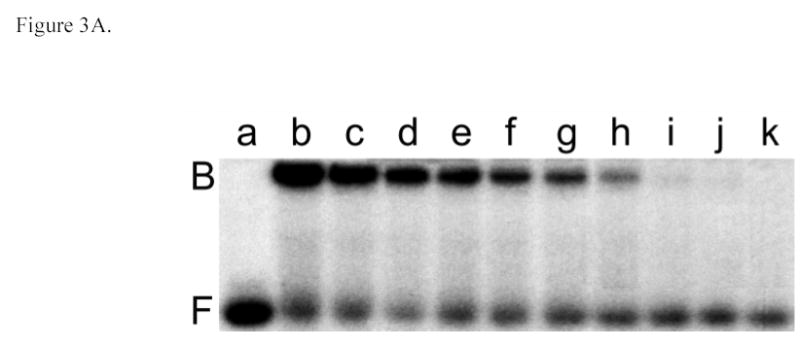
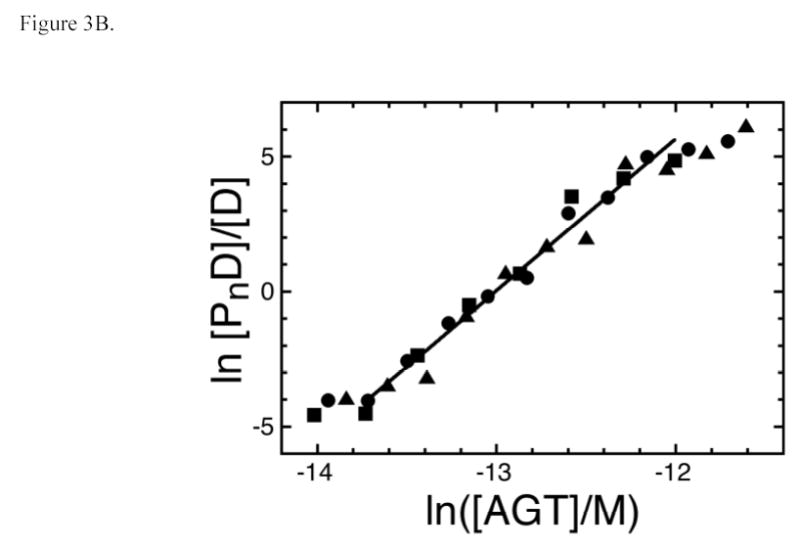
Serial dilution analysis of the AGT complex with single-stranded 24 nt DNA. Panel A. Binding detected by EMSA. Sample a: 24-mer DNA (4.1 × 10⁻⁷ M) only. Sample b: 24-mer DNA (4.1 × 10⁻⁷ M) plus AGT (1.1 ×10⁻⁵ M). Samples c-l are sequential 1:1.33-fold dilutions of sample b. All samples were equilibrated in buffer consisting of 10mM Tris (pH 7.6), 100 mM NaCl, 1 mM DTT, 0.05 mg/mL bovine serum albumin for 30 min at 20 ± 1°C prior to resolution on native gels as described in Methods. Panel B. Graph of the dependence of ln[PnD]/[D] on ln[P] for three parallel experiments, starting with initial AGT:DNA ratios of (▪) 11.5; (•) 15.3 and (▴) 24.1. The line represents a least squares fit to the data ensemble for the range about the mid-point of the reaction (−13.7 ≤ ln([AGT]/M) ≤ −12.0), with [AGT]free calculated as described in Experimental Procedures. The slope equals 5.65 ± 0.21 for this subset of the data.
Table 3.
Association Constants of AGT-DNA Complexes
| DNA Length, nt | Kn/M−n (range)a | Kmono/M−1 | Ki(M−1)b | ωb | Ki × ωc |
|---|---|---|---|---|---|
| Serial dilution analysis | Scatchard analysis | ||||
| 11 | 3.20 × 10¹⁰ (9.79 × 10⁹ – 6.93× 10¹⁰) | 3.33 ± 1.79 × 10⁵ | 3.04 ± 0.29 × 10³ | 37.9 ± 3.0 | 1.15 ± 0.19 × 10⁵ |
| 16 | 9.42 × 10²² (3.11 × 10²² – 2.79 × 10²³) | 8.05 ± 0.26 × 10⁵ | 1.59 ± 0.21 × 10⁴ | 89.8 ± 8.9 | 1.43 ± 0.31 × 10⁶ |
| 22 | 1.55 × 10²² (7.34 × 10²¹ – 2.97 × 10²²) | 4.42 ± 0.88 × 10⁵ | 8.93 ± 1.31 × 10³ | 43.0 ± 6.6 | 3.84 ± 1.07 × 10⁵ |
| 24 | 9.64 × 1031 (8.16 × 1029 – 5.18 × 1033) | 5.35 ± 1.98 × 10⁵ | 1.38 ± 0.10 × 10⁴ | 61.7 ± 3.7 | 8.51 ± 1.09 × 10⁵ |
| 30 | 1.03 × 1030 (2.17 × 1028 – 2.63 × 1031) | 4.53 ± 1.55 × 10⁵ | 1.02 ± 0.15 × 10⁴ | 49.3 ± 5.3 | 5.02 ± 1.19 × 10⁵ |
| 41 | 1.34 × 1033 (1.67 × 1027 – 5.05 × 1038) | 4.14 ± 0.69 × 10⁵ | 1.25 ± 0.05 × 10⁴ | 54.5 ± 2.8 | 6.81 ± 0.61 × 10⁵ |
Binding density depends on DNA length
The number of nucleotide residues per protein molecule (S) is a measure of binding density that reflects the extent to which the DNA is occupied in a protein-DNA complex. When proteins are packed efficiently on templates of optimal length, S is minimized; when gaps occur in packing or partial-length sites are present at DNA ends, S > Smin and the value of S overestimates the separation between the start-points of successive binding sites. Such end-effects are particularly severe when DNA templates are short (36,37). We have exploited this effect to estimate the size of the site occupied by AGT on single-stranded templates. As shown in Figure 4A, S oscillates with increasing DNA length (L) for short templates (≤30 nt), while above this length, the separation between values of L that we have tested is too great for oscillation to be evident. To determine the underlying period of the oscillation, the relation5 S = A cos (BL) + C was used to model the dependence of S on L (Figure 4B). In this equation, A is the amplitude of the oscillation, B its angular frequency in degrees/nt and C is an offset equal to the mean value of S. A fit of this relation to the data returned an angular frequency B = 87.4 ± 0.4 degrees/nt, consistent with models in which successive binding sites are separated by 360/(87.4 ± 0.4) = 4.1 ± 0.02 nt along the DNA contour. No other angles in the range 20° ≤ B ≤ 160° yield similarly small values of χ2 (Fig. 4C), indicating that there is only one plausible binding-site frequency for this system.
Fig. 4.
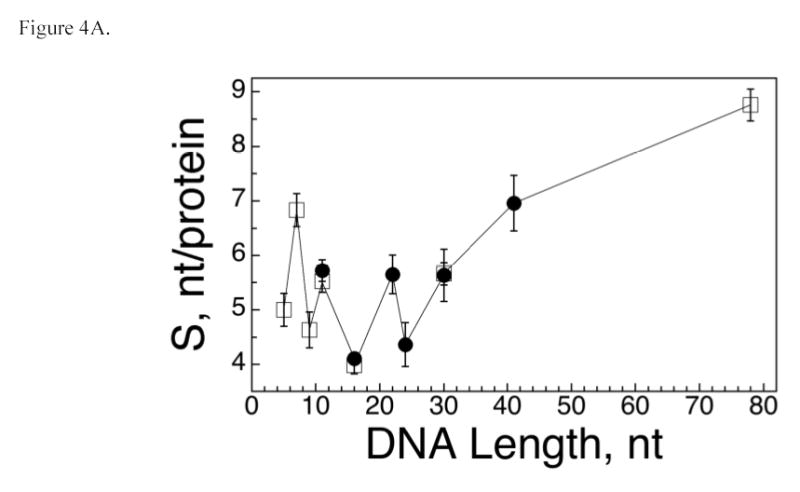
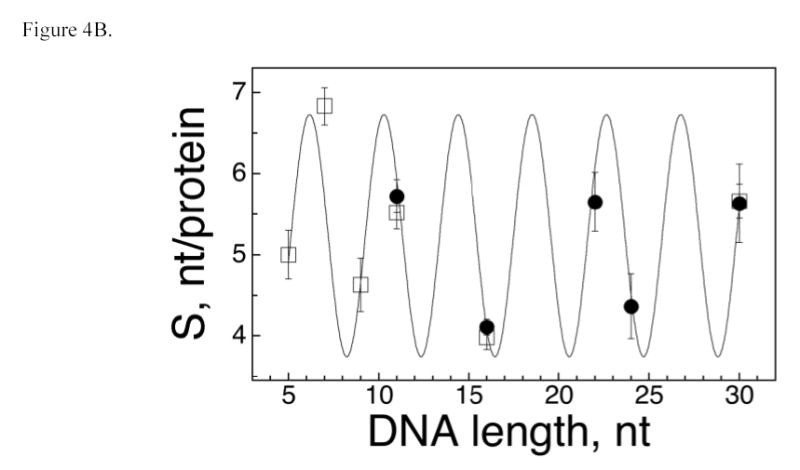
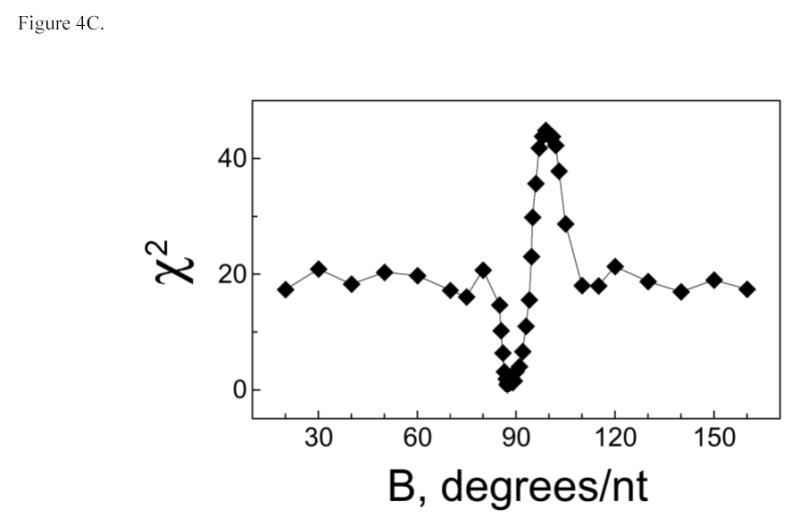
AGT forms a binding motif with a 4 nt periodicity. Panel A. Dependence of statistical binding site size (S) on template length. Data from the entire set of AGT-DNA complexes. Statistical binding site size was calculated using S = L/n, where L is DNA length in nucleotides and n is the number of protein molecules bound to a DNA molecule. S-values determined from sedimentation equilibrium data are indicated by open squares (□), values obtained from EMSA experiments are indicated by closed circles (•). The error bars correspond to 95% confidence limits. Panel B. Data for the subset of AGT-DNA complexes formed with DNAs of 30 nt or less. The smooth curve is the least-squares fit of the equation S = A cos (BL) + C in which A is the amplitude of the oscillation, B the displacement angle in degrees/nt and C is an offset equal to the mean value of S. This fit returned A = −1.5 ± 0.3, B = 87.4 ± 0.4 degrees and C = 5.23 ± 0.14. Data symbols are defined as in Panel A. Panel C. Dependence of the χ2 error function on displacement angle. Data for the dependence of S on L were fit with the equation S = −1.5 cos (BL) + 5.2, as described for Panel B, except that values of angle B were fixed. The χ2 values for each fit are graphed as a function of B. The only significant minimum in χ2 is at B = 87.4 deg/nt, consistent with models in which AGT forms structures with a fundamental repeat of 360/87.4 = 4.1 nt/protein. The prominent maximum at B ~ 100 degrees corresponds to the B-angle with the poorest correlation to the data.
The value of S is significantly greater for the 78 nt DNA than for any of the smaller single-stranded DNAs that we have tested. Since incomplete occupancy of DNA ends should be equally possible for all DNAs, the less-efficient packing of AGT on the 78 nt DNA may reflect the presence of gaps between groups of tightly-packed protein molecules or a uniform, but less tightly-packed structure. In spite of less-efficient packing, the inclusion of complexes containing 41 and 78 nt DNAs in the frequency analysis returned an angle of 86.9 ± 0.5 degrees, in good agreement with the value obtained with shorter templates (result not shown). Thus, although the uniformity of packing may decay with increasing template length, the dominant picture remains one of a protein array in which the average separation between the start of two adjacent binding sites is ~4 nt. This spacing is significantly shorter than the ~8bp/protein occupied in crystalline AGT complexes formed with duplex DNA (22,48) and the optimum site size found for the rate of methyl-group transfer from oligonucleotides (7 nt; (15)). As discussed below, our working hypothesis is that binding sites for AGT molecules overlap along the contour of single-stranded DNA.
DNA-length dependence of K and ω
Changes in binding density may be accompanied by changes in the intrinsic association constant of AGT with DNA (Ki) or in the cooperativity with which AGT forms multi-protein complexes (ω). To explore these possibilities we recast our binding data according to the short-lattice variant of the McGhee-von Hippel relation (Eq. 2). This relates binding density ν to free protein concentration [P] in terms of Ki, ω and the statistical binding site size, S. Shown in Figure 5A are Scatchard plots of data obtained from serial dilution and direct titration experiments. The smooth curves represent fits of Eq. 2 to the data, in which values of S were calculated from stoichiometries determined independently (by sedimentation equilibrium or serial dilution as described above). The good correspondence of fits to data indicates that binding models that include neighbor exclusion and positive cooperativity can account for the binding activities in these systems.
Fig. 5.
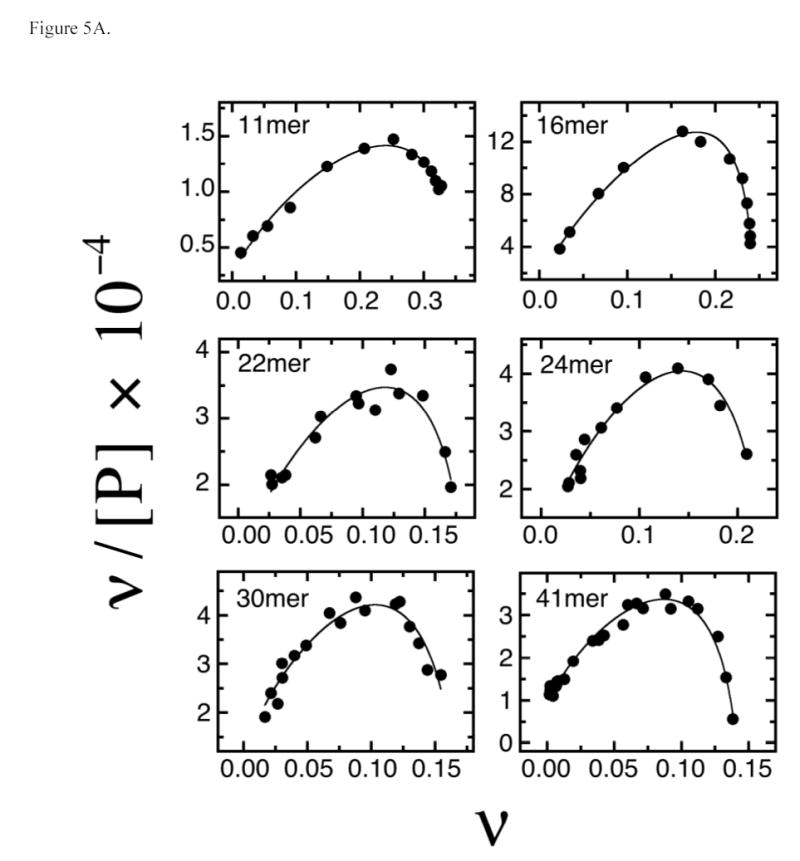
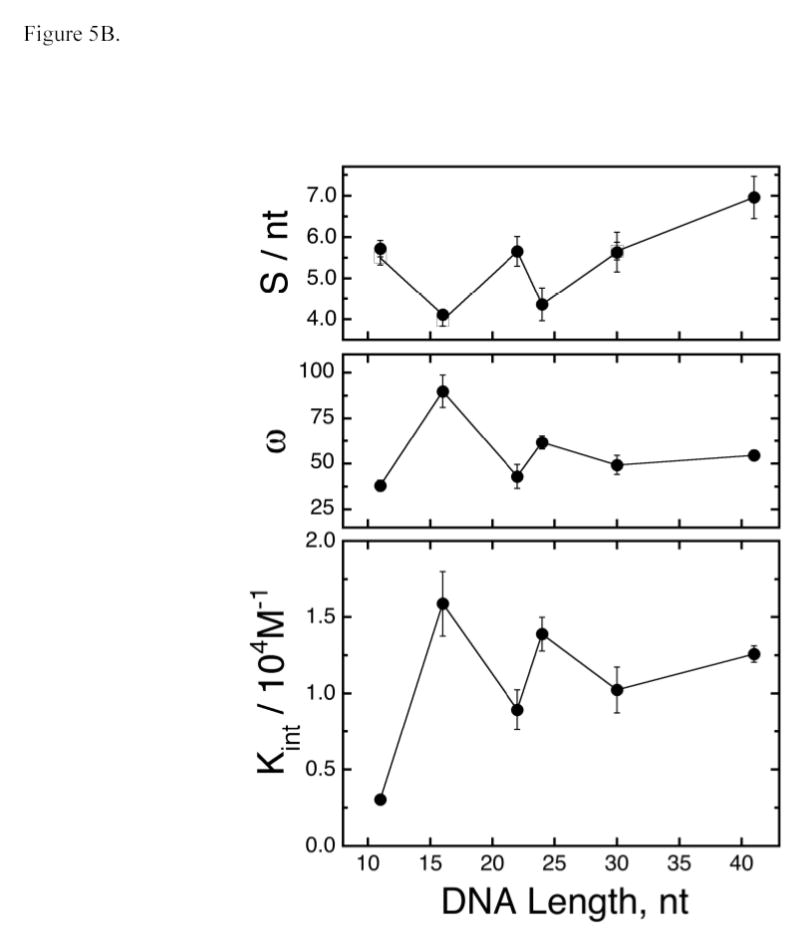
Analysis of binding affinities. Panel A: Scatchard plots. Forward titrations were carried out as described in Methods and binding was detected and quantitated by electrophoretic mobility shift assay. Each data set is a composite derived from 2 or 3 independent titrations. The smooth curves correspond to non-linear least squares fits of Eq. 2 to the data, using fixed values of S determined by equilibrium sedimentation or serial dilution EMSA. The values of K and ω obtained as parameters of these fits are compiled in Table 3. Panel B: dependence of S, ω and K on DNA length (L). The data for the dependence of S on L is a subset of that shown in Fig. 4A. The data for the dependence of ω and K on DNA length is from the experiments shown in Panel A. The error bars correspond to 95% confidence limits estimated for each parameter. The oscillations of ω and K with increasing L appear to have the same period but opposite phase as those of S.
The least-squares “best” values of Ki and ω obtained as fitting parameters are summarized in Table 3. Tests using fixed values of Ki show that Ki and ω are weakly anti-correlated (an increase in one parameter produces a slight decrease in the other). On the other hand, the quality of the fits measured by the χ2 parameter decreased significantly if either parameter varied from its most probable value by more than the 95% confidence limits (results not shown). Thus, while the values of these parameters cannot be considered unique, the data quality is sufficient to allow us to parse binding affinity into reasonably well-defined estimates of Ki and ω. Values of the product Ki·ω obtained from analysis of direct titration data are similar to monomer-equivalent association constants, Kmono = 1/[P]free,midpoint, calculated from serial dilution data6 (14). This agreement indicates that both assays are monitoring the same binding processes and argues against a significant systematic bias in either assay7. In addition, the values of Kn and Kmono shown here for binding the single-stranded 16-mer are closely similar to ones previously reported for the binding of wild type and C145A mutant human AGT proteins to the same DNA, under the same buffer conditions (14). This supports our conclusion that the presence of the C-terminal His6 tag on the protein used in the current studies has a negligible effect on the affinity of human AGT for this standard DNA template.
Values of Ki and ω ο scillate in phase with each other as DNA length increases (Figure 5B). The fact that these oscillations are significantly larger than the confidence limits associated with individual parameters and the fact that they are in phase argue that this oscillation is not a consequence of fitting correlation between Ki and ω (As discussed above, Ki and ω are weakly anti-correlated). Thus, the orientations of AGT proteins and DNA that maximize Ki also position each protein to interact optimally with neighboring AGT molecules. Intriguingly, oscillations in Ki and ω have similar periods, but are of opposite phase to the oscillation of S with DNA length. As a result, the most compact complexes (with smallest S) have relatively stronger protein-DNA and protein-protein interactions than do less compact assemblies with similar stoichiometries. This suggests that AGT complexes formed with single-stranded DNA are somewhat malleable, so that when packing density is not constrained at the maximum value (giving ~4 nt/protein), rearrangements may occur that increase configurational entropy at the expense of slightly sub-optimal protein-DNA and/or protein-protein contacts. This interpretation is supported by the decay of the amplitudes of oscillations in Ki and ω with increasing template length (Fig. 5B). Such decay might be expected if packing interactions become increasingly degenerate with template length.
DISCUSSION
The data presented here are consistent with a cooperative binding model in which AGT molecules bind single-stranded DNA at ~4nt intervals. Since a single molecule of AGT occupies ~8bp of DNA duplex (22,48), it seems likely that AGT molecules overlap along the DNA contour8, as shown schematically in Figure 6. Overlapping binding provides opportunities for protein-protein interactions that may contribute to cooperativity and accounts for the efficient DNA-dependent crosslinking of AGT molecules that we have recently observed (M. Fried, unpublished result). Modestly-cooperative binding like that described here (37.9 ± 3.0 ≤ ω ≤ 89.8 ± 8.9) is sufficient to account for the range of binding site sizes (4 nt ≤ S ≤ 9 nt) previously reported for saturated complexes formed with single-stranded DNAs (13,14,17). On short DNAs (n ≤ 40 nt), ω-values in this range are sufficient to produce tight packing that results in oscillation in the binding site size with minima when the number of nucleotides is an integral multiple of 4. On longer DNAs, this cooperativity is not sufficient to suppress binding degeneracy, so the statistical binding site size gradually increases and oscillations in Ki and ω decay toward average values (Fig. 5).
Fig. 6.
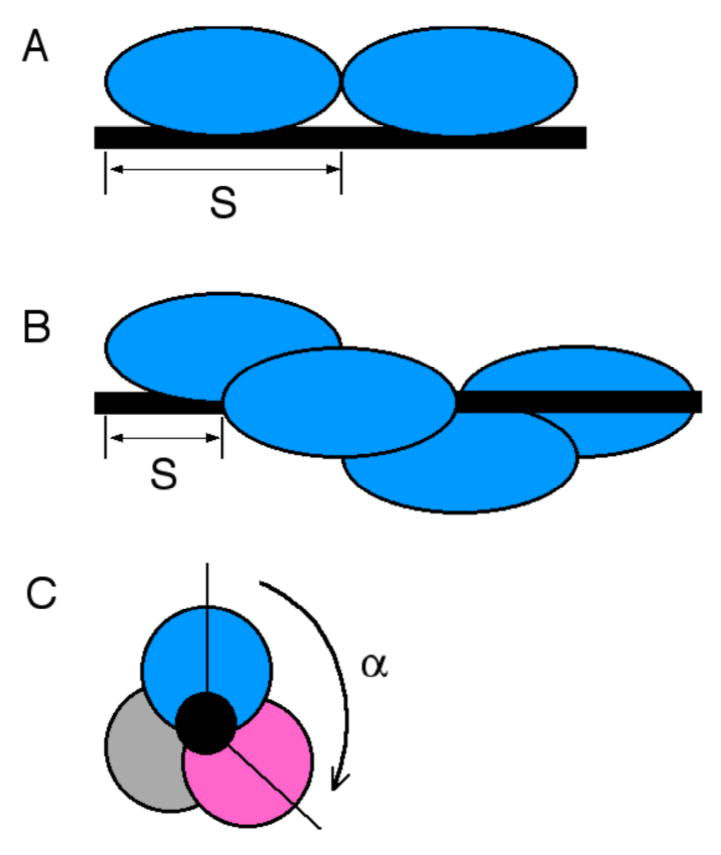
Models of binding topology. Proteins are shown schematically as filled ovals. The DNA is represented by a black rod. A: non-overlapping, adjacent binding. The minimum value of the statistical binding site size S is the number of nucleotides occupied by each AGT monomer, to the exclusion of other AGT monomers. B: Overlapping binding viewed from perpendicular to the DNA axis. Two proteins bind different surfaces of the same DNA segment and the minimum value of S is the number of nucleotides between the first residue in one binding site and the first residue in the next site. Our frequency data do not specify the rotational sense of the assembly. A right-handed complex is shown for purposes of illustration. C: Overlapping binding viewed along DNA axis. The DNA is represented by the black circle in the center. Three proteins, represented by grey, magenta and blue ovals, are bound with rotational offset angle α~ 120° A right-handed complex is shown for purposes of illustration.
AGT is not unique in its reactivity toward single-stranded DNA. Other DNA-repair proteins and factors that bind and/or repair single-stranded DNA include the human and vaccinia virus Uracil-DNA glycosylases (UDGs) (49,50), human DNA glycosylases NEIL1 and NEIL2 (51), human apurinic/apyrimidinic endonuclease (APE1) (52) and Xeroderma pigmentosum group A correcting protein (XP-A) (53,54). In addition, XP-A is associated with the RPA single-strand binding protein (55,56) while components of the transcription-coupled nucleotide excision repair (NER) complex are associated with XP-B and XP-D DNA-helicases (57). It seems reasonable to expect that these interaction partners increase the availability of single-stranded templates for repair. While no such association has been found to date for AGT, this may be because the interactions are too weak for detection by current methods. Alternatively, single-stranded DNA may be sufficiently available for AGT binding, making association with helicases or single-strand binding proteins unnecessary for its function.
The cooperative binding mechanism described here for single-stranded DNA and reported previously for duplex DNA (13,14) contrasts with the independent binding shown in currently-available crystal structures3 of AGT-DNA complexes (22,48). At present we cannot account for this difference. To date, we have tested the binding of wild-type human AGT over a range of temperature (4°C ≤ T ≤ 30°C), salt concentrations (0M ≤ [KCl] ≤ 0.4M), magnesium ion concentrations (0 mM ≤ [Mg++]free ≤ 10 mM) and zinc availability (Zn-depleted and Zn-saturated proteins and Zn-saturated protein with 0 mM ≤ [Zn++]free ≤ 10mM). We have tested C145-methylated and -benzoylated proteins, active-site (C145) mutations and both C-terminal and N-terminal (His)6-tagged proteins, and we have tested a range of single-stranded and duplex templates. Under all conditions, significant binding cooperativity was observed (14,26,58). We conclude that cooperative binding is a bonafide activity of human AGT.
What do these results tell us about the substrate-interactions of AGT? Within our sample set, variations in Ki·ω with changes in substrate identity are small, indicating that binding affinity is not strongly dependent on base composition or sequence. These results are consistent with previous observations based on binding competition assays (13) and the relative sequence-independence of DNA-repair efficiency (16). The absence of a dependence on base composition or sequence is likely to ensure that repair activity is uniformly available to all sequences. Cooperative binding may be an important part of the DNA repair mechanism of AGT. In the current results, the most compact complexes have the strongest protein-DNA and protein-protein interactions. Overlapping binding concentrates repair activity at a higher density on the DNA contour than would be available in non-overlapping binding modes. With a new binding site starting every 4nt, only modest protein displacement is needed for surveillance of every nucleotide in the complex. Together, these results suggest that compact, cooperative binding may be part of an efficient lesion search and repair mechanism. Finally, although the moderate cooperativity detected here (37.9 ± 3.0 ≤ ω ≤ 89.8 ± 8.9) is insufficient to extend high-density binding over hundreds of residues of DNA, it can generate densities approaching 1 protein every 4 residues for sections of template ≤ 50 residues long. Duplex regions of this size are likely to become available between nucleosomes during chromatin remodeling, and single-stranded segments may be transiently available within transcription or DNA replication complexes. The processive movements of these complexes may allow systematic surveillance of large parts of the genome by AGT. In addition, repair just upstream of a replication fork is likely to represent the last opportunity to prevent the conversion of a promutagenic lesion into an actual mutation. Because of its proximity to the replication fork, such last-ditch repair may be limited to single-stranded templates.
The results presented here raise a number of questions for future investigation. First, is the mechanism of cooperative binding the same on single-stranded and duplex DNAs? In vitro measurements indicate that both secondary structures are bound with positive cooperativity and remarkably similar affinities and binding densities9 (13,14). These results are intriguing because single-stranded and duplex DNAs differ greatly in torsional rigidity. The relative flexibility of single-stranded DNA may allow cooperatively-bound AGT proteins to form identical protein-DNA contacts at a binding density of 1 protein every 4 nucleotides. A comparable density of 1 protein every 4 base-pairs will not result in identical protein contacts with the more-rigid B-form duplex, unless each protein is rotated approximately (4 bp·protein−1/10.4 bp·turn−1) × 360 deg·turn−1 = 138.4 deg·protein−1 with respect to its immediate neighbor (similar rotations are shown schematically in Fig. 6). If protein-protein contacts constrain the geometry of the cooperative complex to values other than ~138°/binding step, the cooperative assembly might cause local DNA unwinding (at rotation angles < 138°/binding step) or overwinding (at rotation angles > 138°/binding step).
Second, is the mechanism by which damaged bases enter the active site similar for single-stranded and duplex templates? Torsional stress exerted on duplex DNA may influence the extrusion of alkylguanines from the base stack to form the extrahelical conformation seen in crystalline repair complexes (22,48). Such effects would not be available on single-stranded DNA and may account for the more rapid repair of duplex DNAs than single-stranded ones, in vitro (19).
Third, how do cooperative interactions influence the rates of AGT binding and dissociation from target DNAs? We have previously shown that AGT is monomeric in the absence of DNA, over a wide range of solution conditions (13,14). This result argues against the maintenance of cooperative protein-protein contacts once AGT proteins have dissociated from DNA and against a role for multimeric protein complexes in DNA-binding. Independently of whether AGT binds and dissociates from DNA as a monomer, the portion of a cooperative array of bound proteins that is active in protein binding and/or dissociation is likely to influence the kinetics of these processes. Our current thinking is influenced by the notion that the addition or removal of a protein unit from the middle of a cooperative assembly is likely to be slow compared to the addition or removal of a unit from one end. If this is the case, the rate of transfer of AGT molecules between DNA segments may depend more strongly on the concentration of cooperative assemblies (and hence the concentration of end-monomers) than on the concentration of DNA-bound AGT monomers, themselves. Experiments designed to test these ideas are underway.
Finally, do alkyltransfer rates depend on the length of the cooperative complex? Repair requires the correct juxtaposition of an active AGT monomer and the damaged base. If the correct juxtaposition of AGT and lesion is not achieved during formation of the protein-DNA complex, achieving it may require repositioning of the entire protein array. If this is the case, productive binding and repair might be more rapidly achieved with short protein arrays than with long. Similarly, do alkyltransfer rates depend on substrate length as seen for the binding parameters Ki and ω? If so, oligonucleotides with lengths that are multiples of 4 nt will be more efficient substrates than ones of intermediate lengths. These factors may contribute the development of clinically-useful oligonucleotide inhibitors of AGT.
Footnotes
Supported by NIH grants GM-070662 (to M.G.F.) and CA-97209 (to A.E.P.) and Medical Scientist Training Program Grant 5 T32 GM-08601-05 (J.J.R.). Current addresses: Dr. J. Rasimas, Department of Psychiatry and Psychology, Mayo Clinic, Rochester MN 55905. Dr. S. Kar, Jules Stein Eye Institute, David Geffen School of Medicine, University of California Los Angeles, Los Angeles, CA 90095.
E.C.2.1.1.63.
Thus, every substrate is a suicide substrate.
The structures obtained by Daniels et al. (PDB numbers 1T38 and 1T39) contain 1:1 AGT-DNA complexes (22). The structure of Duguid et al. (PDB number 1YFH) contains 3 AGT molecules and 2 DNA molecules (48). Two AGT molecules make separate contact with a single DNA and one binds the second DNA. Within this unit two AGT molecules bound to different DNA molecules form a protein-protein contact.
The excellent correspondence of the molecular weights observed for the free DNA species with those predicted from their sequences (summarized in Table 1) establishes that each DNA is single stranded and demonstrates the absence of significant steric and electrostatic non-idealities under these solution conditions.
This corresponds to the first terms of a Fourier cosine series (59). We chose this simple expression because it adequately models the oscillation and because the fit was not significantly improved when additional sine or cosine terms were added (results not shown).
This estimate assumes that binding free energies are identical for all AGT monomers within a complex.
In addition, similar values obtained for reactions running in the association direction (direct titration) and the dissociation direction (serial dilution) demonstrates the attainment of equilibrium.
This interpretation is based on models in which the same protein surface interacts with single-stranded and duplex DNAs. In support of these models, we reason that since AGT repairs both single-stranded and duplex DNAs, the active-site cleft must be part of the binding surface for both substrates. In addition, AGT has only one surface with positive electrostatic potential that could accommodate negatively-charged DNA (60), and that surface coincides with the one in contact with duplex DNA in currently-available crystal structures (22,39).
For example, S = 4 nt/protein on single-stranded 16-mer DNA and S = 4bp/protein for the corresponding 16-mer duplex (14).
References
- 1.Loveless A. Nature (London) 1969;223:206–207. doi: 10.1038/223206a0. [DOI] [PubMed] [Google Scholar]
- 2.Pegg AE. Cancer Res. 1990;50:6119–6129. [PubMed] [Google Scholar]
- 3.Margison GP, Santibáñez-Koref MF. BioEssays. 2002;24:255–266. doi: 10.1002/bies.10063. [DOI] [PubMed] [Google Scholar]
- 4.Snow ET, Mitra S. Cancer Invest. 1987;5:119–125. doi: 10.3109/07357908709018466. [DOI] [PubMed] [Google Scholar]
- 5.Encell LP, Loeb IA. Carcinogenesis. 2000;21:1397–1402. [PubMed] [Google Scholar]
- 6.Gerson SL. J Clin Oncol. 2002;20:2388–2399. doi: 10.1200/JCO.2002.06.110. [DOI] [PubMed] [Google Scholar]
- 7.Pegg AE. Mutat Res. 2000;462:83–100. doi: 10.1016/s1383-5742(00)00017-x. [DOI] [PubMed] [Google Scholar]
- 8.Rabik CA, Njoku MC, Dolan ME. Cancer Treat Rev. 2006;32:261–276. doi: 10.1016/j.ctrv.2006.03.004. [DOI] [PubMed] [Google Scholar]
- 9.Ranson M, Middleton MR, Bridgewater J, Lee SM, Dawson M, Jowle D, Halbert G, Waller S, McGrath H, Gumbrell L, McElhinney RS, Donnelly D, McMurry TB, Margison GP. Clin Cancer Res. 2006;12:1577–158.4. doi: 10.1158/1078-0432.CCR-05-2198. [DOI] [PubMed] [Google Scholar]
- 10.Gajewski TF, Sosman J, Gerson SL, Liu L, Dolan E, Lin S, Vokes EE. Clin Cancer Res. 2005;11:7861–7865. doi: 10.1158/1078-0432.CCR-05-0060. [DOI] [PubMed] [Google Scholar]
- 11.Pegg AE, Dolan ME, Moschel RC. Prog Nucl Acid Res and Mol Biol. 1995;51:167–223. doi: 10.1016/s0079-6603(08)60879-x. [DOI] [PubMed] [Google Scholar]
- 12.Chan CL, Wu Z, Ciardelli T, Eastman A, Bresnick E. Arch Biochem Biophys. 1993;300:193–20.0. doi: 10.1006/abbi.1993.1027. [DOI] [PubMed] [Google Scholar]
- 13.Fried MG, Kanugula S, Bromberg JL, Pegg AE. Biochemistry. 1996;35:15295–15301. doi: 10.1021/bi960971k. [DOI] [PubMed] [Google Scholar]
- 14.Rasimas JJ, Pegg AE, Fried MG. J Biol Chem. 2003;278:7973–7980. doi: 10.1074/jbc.M211854200. [DOI] [PubMed] [Google Scholar]
- 15.Liem LK, Wong CW, Lim A, Li BFL. J Mol Biol. 1993;231:950–959. doi: 10.1006/jmbi.1993.1344. [DOI] [PubMed] [Google Scholar]
- 16.Bender K, Federwisch M, Loggen U, Nehls P, Rajewsky MF. Nucl Acids Res. 1996;24:2087–2094. doi: 10.1093/nar/24.11.2087. [DOI] [PMC free article] [PubMed] [Google Scholar]
- 17.Luu KX, Kanugula S, Pegg AE, Pauly GT, Moschel RC. Biochemistry. 2002;41:8089–8097. doi: 10.1021/bi025857i. [DOI] [PubMed] [Google Scholar]
- 18.Xu-Welliver M, Pegg AE. Carcinogenesis. 2002;23:823–830. doi: 10.1093/carcin/23.5.823. [DOI] [PubMed] [Google Scholar]
- 19.Bhattacharyya D, Foote RS, Boulden AM, Mitra S. Eur J Biochem. 1990;193:337–343. doi: 10.1111/j.1432-1033.1990.tb19343.x. [DOI] [PubMed] [Google Scholar]
- 20.Pegg AE, Kanugula S, Edara S, Pauly GT, Moschel RC, Goodtzova K. J Biol Chem. 1998;273:10863–10867. doi: 10.1074/jbc.273.18.10863. [DOI] [PubMed] [Google Scholar]
- 21.Pegg AE, Goodtzova K, Loktionova NA, Kanugula S, Pauly GT, Moschel RC. J Pharm Exp Ther. 2001;296:958–965. [PubMed] [Google Scholar]
- 22.Daniels DS, Woo TT, Luu KX, Noll DM, Clarke ND, Pegg AE, Tainer JA. Nat Struct Mol Biol. 2004;11:714–720. doi: 10.1038/nsmb791. [DOI] [PubMed] [Google Scholar]
- 23.Laemmli UK. Nature. 1970;227:680–685. doi: 10.1038/227680a0. [DOI] [PubMed] [Google Scholar]
- 24.Nesterenko MV, Tilley M, Upton SJ. J Biochem Biophys Methods. 1994;28:239–242. doi: 10.1016/0165-022x(94)90020-5. [DOI] [PubMed] [Google Scholar]
- 25.Kanugula S, Goodtzova K, Edara S, Pegg AE. Biochemistry. 1995;34:7113–7119. doi: 10.1021/bi00021a024. [DOI] [PubMed] [Google Scholar]
- 26.Rasimas JJ, Kanugula S, Dalessio PM, Ropson IJ, Fried MG, Pegg AE. Biochemistry. 2003;42:980–990. doi: 10.1021/bi026970b. [DOI] [PubMed] [Google Scholar]
- 27.Roy R, Shiota S, Kennel SJ, Raha R, von Wronski M, Brent TP, Mitra S. Carcinogenesis. 1995;16:405–411. doi: 10.1093/carcin/16.2.405. [DOI] [PubMed] [Google Scholar]
- 28.Fang Q, Kanugula S, Pegg AE. Biochemistry. 2005;44:15396–15405. doi: 10.1021/bi051460d. [DOI] [PubMed] [Google Scholar]
- 29.Panjkovich A, Norambuena T, Melo F. Nucl Acids Res. 2005;33:W570–W572. doi: 10.1093/nar/gki379. [DOI] [PMC free article] [PubMed] [Google Scholar]
- 30.Maxam A, Gilbert WS. Proc Natl Acad Sci USA. 1977;74:560–565. [Google Scholar]
- 31.Cantor CR, Tinoco I., Jr J Mol Biol. 1965;13:65–77. doi: 10.1016/s0022-2836(65)80080-8. [DOI] [PubMed] [Google Scholar]
- 32.Cavaluzzi MJ, Borer PN. Nucl Acids Res. 2004;32:e13. doi: 10.1093/nar/gnh015. [DOI] [PMC free article] [PubMed] [Google Scholar]
- 33.Fried MG. Electrophoresis. 1989;10:366–376. doi: 10.1002/elps.1150100515. [DOI] [PubMed] [Google Scholar]
- 34.Fried MG, Crothers DM. Nucl Acids Res. 1981;9:6505–6525. doi: 10.1093/nar/9.23.6505. [DOI] [PMC free article] [PubMed] [Google Scholar]
- 35.Fried MG, Daugherty MA. Electrophoresis. 1998;19:1247–1253. doi: 10.1002/elps.1150190804. [DOI] [PubMed] [Google Scholar]
- 36.McGhee J, von Hippel PH. J Mol Biol. 1974;86:469–489. doi: 10.1016/0022-2836(74)90031-x. [DOI] [PubMed] [Google Scholar]
- 37.Tsodikov OV, Holbrook JA, Shkel IA, Record MT., Jr Biophys J. 2001;81:1960–1969. doi: 10.1016/S0006-3495(01)75847-X. [DOI] [PMC free article] [PubMed] [Google Scholar]
- 38.Daugherty MA, Fried MG. Protein-DNA Interactions at Sedimentation Equilibrium. In: Scott D, editor. Modern Analytical Ultracentrifugation: Techniques and Method. Royal Society of Chemistry; Oxford: 2005. pp. 195–209. [Google Scholar]
- 39.Cohn EJ, Edsall JT. Proteins, Amino Acids and Peptides as Ions and Dipolar Ions. In: Cohn EJ, Edsall JT, editors. Proteins, Amino Acids and Peptides as Ions and Dipolar Ions. Reinhold; New York: 1943. pp. 370–381. [Google Scholar]
- 40.Laue TM, Shah BD, Ridgeway TM, Pelletier SL. Computer-Aided Interpretation of Analytical Sedimentation Data For Proteins. In: Harding SE, Rowe AJ, Harding JC, editors. Analytical Ultracentrifugation in Biochemistry and Polymer Science. The Royal Society of Chemistry; Cambridge, England: 1992. pp. 90–125. [Google Scholar]
- 41.Cohen G, Eisenberg H. Biopolymers. 1968;6:1077–1100. doi: 10.1002/bip.1968.360060805. [DOI] [PubMed] [Google Scholar]
- 42.Rippe K, Mucke N, Schulz A. J Mol Biol. 1998;278:915–933. doi: 10.1006/jmbi.1998.1746. [DOI] [PubMed] [Google Scholar]
- 43.Dyckman D, Fried MG. J Biol Chem. 2002;277:19064–19070. doi: 10.1074/jbc.M110554200. [DOI] [PubMed] [Google Scholar]
- 44.Kar SR, Lebowitz J, Blume S, Taylor KB, Hall LM. Biochemistry. 2001;40:13378–13389. doi: 10.1021/bi011289f. [DOI] [PubMed] [Google Scholar]
- 45.Maluf NK, Lohman TM. J Mol Biol. 2003;325:889–912. doi: 10.1016/s0022-2836(02)01276-7. [DOI] [PubMed] [Google Scholar]
- 46.Johnson ML, Correia JJ, Yphantis DA, Halvorson HR. Biophys J. 1981;36:575–588. doi: 10.1016/S0006-3495(81)84753-4. [DOI] [PMC free article] [PubMed] [Google Scholar]
- 47.Zeman SM, Crothers DM. Methods Enzymol. 2001;340:51–68. doi: 10.1016/s0076-6879(01)40417-4. [DOI] [PubMed] [Google Scholar]
- 48.Duguid EM, Rice PA, He C. J Mol Biol. 2005;350:657–666. doi: 10.1016/j.jmb.2005.05.028. [DOI] [PubMed] [Google Scholar]
- 49.Krokan H, Wittwer CU. Nucl Acids Res. 1981;9:2599–2613. doi: 10.1093/nar/9.11.2599. [DOI] [PMC free article] [PubMed] [Google Scholar]
- 50.Scaramozzino N, Sanz G, Crance JM, Saparbaev M, Drillien R, Laval J, Kavli B, Garin D. Nucl Acids Res. 2003;31:4950–4957. doi: 10.1093/nar/gkg672. [DOI] [PMC free article] [PubMed] [Google Scholar]
- 51.Dou H, Mitra S, Hazra TK. J Biol Chem. 2003;278:49679–49684. doi: 10.1074/jbc.M308658200. [DOI] [PubMed] [Google Scholar]
- 52.Marenstein DR, Wilson DMR, Teebor GW. DNA Repair. 2004;3:527–533. doi: 10.1016/j.dnarep.2004.01.010. [DOI] [PubMed] [Google Scholar]
- 53.Eker AP, Vermeulen W, Miura N, Tanaka K, Jaspers NG, Hoeijmakers JH, Bootsma D. Mutat Res. 1992;274:211–224. doi: 10.1016/0921-8777(92)90067-d. [DOI] [PubMed] [Google Scholar]
- 54.Jones CJ, Wood RD. Biochemistry. 1993;32:12096–12104. doi: 10.1021/bi00096a021. [DOI] [PubMed] [Google Scholar]
- 55.Shivji KK, Kenny MK, Wood R. Cell. 1992;69:367–374. doi: 10.1016/0092-8674(92)90416-a. [DOI] [PubMed] [Google Scholar]
- 56.Fanning E, Klimovich V, Nager AR. Nucl Acids Res. 2006 doi: 10.1093/nar/gkl550. In press [Epub ahead of print]. [DOI] [PMC free article] [PubMed] [Google Scholar]
- 57.Riedl T, Hanaoka F, Egly JM. EMBO J. 2003;22:5293–5303. doi: 10.1093/emboj/cdg489. [DOI] [PMC free article] [PubMed] [Google Scholar]
- 58.Rasimas JJ, Dalessio PA, Ropson IJ, Pegg AE, Fried MG. Protein Sci. 2004;13:301–305. doi: 10.1110/ps.03319404. [DOI] [PMC free article] [PubMed] [Google Scholar]
- 59.Burington RS. Handbook of Mathematical Tables and Formulas. 5th Ed. McGraw-Hill; New York: 1973. pp. 226–230. [Google Scholar]
- 60.Daniels DS, Tainer JA. Mutation Res. 2000;460:151–163. doi: 10.1016/s0921-8777(00)00024-0. [DOI] [PubMed] [Google Scholar]
- 61.Adams C, Fried MG. Analysis of Protein-DNA Equilibria by Native Gel Electrophoresis. In: Schuck P, editor. Protein Interactions: Biophysical Approaches For The Study of Multicomponent Systems. Academic Press; New York: 2006. in press. [Google Scholar]