

Abstract
Understanding the mechanisms of transport processes in the placenta can improve the safety and efficacy of drug delivery during pregnancy. Functional studies of Organic Cation Transporters (OCTs) are usually carried out using radioactivity, and a fluorescent marker would add flexibility to experimental methods. As a published substrate for OCT1 and OCT2, the fluorescent compound 4-(4-(dimethylamino)styryl)-N-methylpyridinium iodide (4-Di-1-ASP) was chosen as a candidate for studying placental OCT function in BeWo cells. The expression of OCT1 and OCT2 was also investigated in BeWo cells, an established human choriocarcinoma trophoblastic cell line frequently used as an in vitro model of the rate-limiting barrier for maternal-fetal exchange of drugs and nutrients within the placenta. 4-Di-1-ASP was taken up into BeWo cells by a low-affinity, carrier-mediated process exhibiting a Km of 580 ± 110 μM and Vmax of 97 ± 9 nmol/mg protein/30 min, and asymmetric transport was observed, with greater permeability in the apical to basolateral (maternal to fetal) direction. However, RT-PCR revealed no expression of OCT1 or OCT2 in either BeWo cells or primary cultured human cytotrophoblast cells, and OCT substrates such as TEA and choline did not inhibit the uptake of 4-Di-1-ASP. Although the uptake of this fluorescent compound in BeWo cells is not mediated by an OCT, the colocalization experiments with fluorescence microscopy and inhibition studies confirmed significant mitochondrial uptake of 4-Di-1-ASP. Transport of 4-Di-1-ASP into the nuclear region of BeWo cells was also observed, which is likely mediated by a nucleoside transporter.
Keywords: organic cation transporters, OCT1, OCT2, BeWo cells, placenta, drug transport
1. Introduction
Organic cation transporters (OCTs) constitute a recently-identified class of proteins that mediate the transport of cationic drugs and nutrients in the placenta and other tissues. Knowledge regarding the function, selectivity, and regulation of these transport processes will aid the pharmaceutical scientist in the design or selection of drug candidates. Permeability across biological barriers is one of the pivotal pharmaceutical properties sought after to achieve general systemic drug distribution, but during pregnancy, one must consider the consequences of drug penetration across the placenta.
Most experimental work to characterize the activity of OCTs is carried out using radiolabeled compounds. Because radiation exposure and subsequent disposal are primary concerns, alternative means of data quantification, such as fluorescence, are desirable to improve laboratory safety. Fluorescent probes may also provide some advantages in terms of experimental utility. For example, in this work, radioactivity is quantified by scintillation counting only, but fluorescence is detected by both spectrofluorometry and fluorescence microscopy.
The fluorescent organic cation 4-(4-(dimethylamino)styryl)-N-methyl-pyridinium iodide, hereafter referred to as 4-Di-1-ASP, was selected to investigate the functions of OCTs in the BeWo cell line, an in vitro model of human trophoblast cells. 4-Di-1-ASP has been used as a substrate to study catecholamine transporters [1] in addition to OCT1 and OCT2 in transfected HEK-293 cells [2;3]. Because it was not yet known whether OCT1 and/or OCT2 are expressed in BeWo cells, this study was undertaken to determine the expression of these organic cation transporters (OCTs) in this model of trophoblasts, and to characterize the uptake of 4-Di-1-ASP in BeWo cells in order to assess its utility as a fluorescent substrate for studying OCTs in BeWo cells.
OCTs present in the placental barrier include OCT3 (EMT), OCTN1, and OCTN2. OCTN2 is expressed in the apical (microvillous, maternal-facing) membranes of human trophoblast, and OCT3 is found on the basolateral (fetal-facing) side of the trophoblast layer, but the localization of OCTN1 is not yet known [4].
OCT1 is primarily found in the liver, and OCT2 in the kidney [5], but the expression of OCT1 and OCT2 in placenta has been controversial. In 2001, Wessler et al. studied the release of acetylcholine from placental villus and concluded that the process is mediated by OCT1 and OCT3 [6]. The expression of OCT2 in human placenta is reported by multiple authors [7–10] and refuted by others [11–13]. In agreement with the findings of Alcorn et al. [12], Ming et al. recently detected mRNA for OCT1 but not OCT2 in placenta [14].
The BeWo cell line is of human origin, and serves as a model of trophoblast cells, the rate-limiting barrier for maternal-fetal exchange of drugs and nutrients within the placenta. In this work, the expression of OCT1 and OCT2 in BeWo cells is investigated by Western Blot and RT-PCR. In addition, the uptake of 4-Di-1-ASP, a fluorescent substrate for OCT1 and OCT2, is examined in this cell line.
2. Materials and Methods
2.1 Cell Culture
BeWo cells were cultured and harvested for experiments as described previously [15]. Briefly, the cells were incubated at 37°C in 150 cm² flasks under 5% CO2, and the medium was changed every other day (Dulbecco’s Modified Eagle’s Medium, Sigma-Aldrich, St. Louis, MO, adjusted to pH 7.4 and containing 10% heat-inactivated fetal bovine serum (FBS), Atlanta Biologicals, Norcross, GA, and 1% each of 200 mM L-glutamine, 10,000 units/mL penicillin with 10 mg/mL streptomycin, and 10 mM minimal essential medium nonessential amino acids solution, all three from Invitrogen, Carlsbad, CA). Passages 28 through 47 of the BeWo cells (clone b30, from Dr. Alan Schwartz, Washington University, St. Louis, MO) were used in this study.
2.2 Western Blotting
Cellular lysates from BeWo cells were obtained, and Western blotting performed, as described previously [15]. Electrophoresis for 2 hours at 110 V in a 12% Tris-glycine gel (Invitrogen) was followed by transfer to a nitrocellulose membrane (0.45 μm pores, from Invitrogen) at 25 V for 2 hours on ice. The Novex Tris-Glycine SDS Running Buffer and Novex Tris-Glycine Transfer Buffer were both from Invitrogen. The primary antibodies were rabbit anti-rat OCT1 and rabbit anti-rat OCT2 affinity pure IgGs (both from Alpha Diagnostic International, San Antonio, TX), each used at a concentration of 5 μg/mL. The secondary antibody was peroxidase-conjugated AffiniPure goat anti-rabbit IgG (Jackson ImmunoResearch Laboratories, West Grove, PA), diluted 1:10,000. Detection was by the enhanced chemiluminescence reagents from Amersham Biosciences (Little Chalfont, Buckinghamshire, UK).
2.3 Uptake Experiments
Details regarding the procedures for the uptake experiments are described in the literature [15]. Cells were seeded at a density of 12,500 cells/cm² in either 12- or 24-well Corning Costar tissue culture plates (Cambridge, MA). Once the cells reached 90–100% confluency (4–6 days), the cells were washed three times with warm (37°C) Hanks’ Balanced Salt Solution (HBSS, from Sigma-Aldrich, St. Louis, MO) and allowed to equilibrate in HBSS at 37°C for approximately 45 minutes. At the beginning of an uptake study, appropriate concentrations of 4-Di-1-ASP (Molecular Probes, Eugene, OR) in HBSS were added to the cells in a shaking hotbox (37°C) for the appointed time of each study. At the end of the uptake time, the dosing solutions were aspirated, and the cells were washed three times with ice-cold HBSS, after which the cells were lysed for 2–3 hours in a lysing solution containing 0.5% Triton X-100 (Sigma-Aldrich, St. Louis, MO) in 0.2 N NaOH. Fluorescence detection was monitored using a Bio-Tek FL600 Microplate Fluorescence Reader (Bio-Tek Instruments, Inc., Winooski, VT), with excitation at 485 nm and emission at 590 nm. Protein content in cell lysate samples was quantified by comparison to bovine serum albumin standards using a kit from Pierce Chemical (Rockford, IL).
During the temperature-dependence studies of 4-Di-1-ASP uptake, the temperature was controlled with a Barnstead Labline Max Q 5000 Shaker (Dubuque, IA). The sodium-dependence of 4-Di-1-ASP uptake was investigated by replacing the NaCl in Krebs-Ringer buffer (123 mM NaCl, 4.93 mM KCl, 1.23 mM MgSO4, 0.85 mM CaCl2, 5 mM glucose, 5 mM glutamine, 10 mM HEPES, and 10 mM MES) [16] with 123 mM N-methyl-D-glucamine chloride (Sigma, St. Louis, MO) or 246 mM mannitol (Sigma, St. Louis, MO). pH-dependent uptake studies were carried out in Krebs-Ringer buffer titrated to the desired pH with HCl or NaOH.
For inhibition studies, the compounds tetraethylammonium chloride (TEA), choline chloride, L-carnitine hydrochloride, L-leucine, agmatine sulfate, spermidine, 1-methyl-4-phenylpyridinium iodide (MPP+), verapamil hydrochloride, cytidine, guanosine, methamphetamine hydrochloride, and amiloride hydrochloride hydrate were obtained from Sigma-Aldrich (St. Louis, MO). L-arginine was from United States Biochemical Corporation (Cleveland, OH); and L-(+)-ergothioneine was from Bachem (King of Prussia, PA). Gramicidin A and valinomycin (both from MP Biomedicals, Irvine, CA) were used to modulate the membrane potential.
2.4 Directional Transport Studies
To assess the transport of 4-Di-1-ASP across a monolayer of BeWo cells, the cells were grown in 12-well Corning Costar Transwell® plates until confluent. Details regarding the procedures for growing BeWo cells on Transwell plates were published previously [17]. Briefly, 70 μL of a solution of 2.9 mg/mL human placental collagen (Fluka, Milwaukee, WI) in 0.1% acetic acid was coated evenly on the polycarbonate membrane of each Transwell insert. Under sterile conditions, the plates were set to dry under fluorescent light for 3 hours, and then the plates were sterilized under ultraviolet light for one hour, at which point the plates were wrapped and refrigerated for up to one week, or seeding of the cells continued immediately by placing 1 mL of warm (37°C) phosphate buffered saline (PBS: 129 mM NaCl, 2.5 mM KCl, 7.4 mM Na2HPO4, and 1.3 mM KH2PO4, adjusted to pH 7.4) into the apical chamber and 2 mL PBS into the basolateral chamber of each well. After 30 minutes, the PBS was aspirated and 500 μL of BeWo cells in DMEM were seeded onto each membrane at a density of 50,000 cells/mL, and 1.5 mL of medium was placed into each basolateral chamber.
The medium was changed every other day until the monolayers were confluent (5–7 days), at which point the cells were washed three times and then equilibrated for 45 minutes in warm HBSS inside a 37°C hotbox. For transport in the apical to basolateral direction (A → B), 0.5 mL of 4-Di-1-ASP in HBSS was added to the apical chamber and 1.5 mL of HBSS was in the basolateral chamber. The transport studies were conducted in a 37°C hotbox on a rotating platform. At the desired time points, 100 μL was sampled from the basolateral chamber, followed by an immediate replacement of 100 μL HBSS. Concentration determinations at the second, third, etc. time points were adjusted to take the replacement volumes into account. For transport in the basolateral to apical (B → A) direction, 1.5 mL of 4-Di-1-ASP was added to the basolateral chamber, and 100 μL samples were taken from the 500 μL of HBSS in the apical chamber.
2.5 Data Analysis
Saturable uptake data were fit to the Michaelis-Menten equation:
| (1) |
where V, Vmax, C, and Km represent the uptake rate (nmol/mg protein/30 min), maximum uptake rate, concentration of 4-Di-1-ASP (μM), and the half-saturation constant, respectively. From the temperature dependence studies, the uptake rate was defined as the slope regressed from the 30-minute uptake of 80, 160, and 320 μM 4-Di-1-ASP, and the activation energy was calculated by multiplying the negative of the slope regressed from the Arrhenius plot (ln(uptake rate) vs. 1/Temperature) times the gas constant R (8.314472 J/mol/K).
Uptake in the presence of inhibitors is presented as percentage of control (uptake in the absence of any inhibitor), and IC50 constants for inhibitors (the concentration at which uptake is 50% of control) are calculated from the following equation:
| (2) |
where [I] is the inhibitor concentration, min is the minimum uptake (as [I] approaches ∞), and Hillslope is the slope factor. Regression of the constants for equations 1 and 2 was performed using SigmaPlot software (SPSS Inc., Chicago, IL). Errors associated with reported values are the standard deviation from three or four determinations.
Data from the transport studies are presented as permeability coefficients (P, in cm/sec), calculated from the equation:
| (3) |
where ΔQ/Δt is the rate of molar transport, A is the surface area of the cell monolayer, and C0 is the initial concentration of 4-Di-1-ASP.
2.6 Isolation of Primary Cultured Cytotrophoblasts
Cytotrophoblast cells were isolated from a placenta following an uncomplicated caesarean delivery at the University of Kansas Hospital. Detailed procedures for the isolation of primary cultured cytotrophoblast cells are provided by Petroff et al. [18]. Briefly, villous material from several cotyledons is rinsed, minced, and incubated in enzyme digestion solution. Cells from the resulting supernatant are layered atop fetal bovine serum, and two more enzyme digestion steps are taken to acquire additional cells. The tubes containing cells and serum are centrifuged, and the cell pellets are suspended in medium containing 10% FBS. Following a filtering step and resuspension in a modified HBSS solution, the cells are layered onto a Percoll gradient. The cytotrophoblast cells are located in the center diffuse band following centrifugation of the Percoll gradient, and after resuspension in medium containing 10% FBS, the cells are stored at −80°C. The cytotrophoblast cells were later thawed, purified by immuno-magnetic separation, and then stored again at −80°C.
2.7 RT-PCR and Product Sequencing
Total RNA was isolated from primary cultured cytotrophoblast cells and BeWo cells grown in 150 cm² flasks. BeWo cells were scraped into PBS and centrifuged at 1500 rpm for 8 minutes. Primary cytotrophoblast cells were thawed and centrifuged at the same speed. The cell pellets were resuspended in TRIzol reagent (Invitrogen, Carlsbad, CA) at a density of approximately 5 x 10⁶ cells per mL TRIzol. This cell suspension was homogenized by passing ten times through a syringe needle (26-gauge, from Becton Dickinson, Franklin Lakes, NJ). The homogenized cells incubated at room temperature for 5 minutes, and then chloroform was added to the cells (200 μL of chloroform per mL of TRIzol added earlier). This was mixed by inverting twenty times and then vortexing, and after 2.5 minutes, the mixture was vortexed once more before about 1 mL of each mixture was placed into microcentrifuge tubes and spun at 12,000 x g for 15 minutes at 4°C. The colorless aqueous phase containing the RNA was removed from the top of the separation following centrifugation, and isopropanol was then added to this collection (0.5 mL of isopropanol per mL TRIzol originally added). After mixing by inverting the tubes, the RNA was allowed to precipitate for 10 minutes at room temperature, and then the tubes were spun at 12,000 x g for 10 minutes at 4°C. The supernatant was removed by pipetting, and the gel-like RNA pellet in each tube was washed in 1 mL of 75% ethanol, mixed by vortexing, and centrifuged at 7,500 x g for 5 minutes at 4°C. After most of the supernatant was removed, the open tubes were supported upside-down for 10 minutes to allow additional drying before the RNA was dissolved in 50 μL of nuclease-free water and incubated for 10 minutes at 55–60°C. The total RNA was stored at −80°C.
Purification of mRNA from total RNA was performed using an Oligotex mRNA Mini Kit (Qiagen, Valencia, CA), following the kit instructions (Oligotex® Handbook, May 2002 edition). Purified mRNA was stored at −80°C until further use. The mRNA was precipitated before the RT-PCR experiment by mixing the volume of mRNA necessary to give 100 ng per reaction (volume n) with 0.01·n glycogen (Roche Diagnostics, Indianapolis, IN), and 0.1·n 3M pH 5.2 DEPC-treated sodium acetate, followed by the addition of 2.5·n ethanol to this mixture. The sample was then kept overnight at −20°C.
The RT-PCR reactions were carried out using the Access RT-PCR System from Promega (Madison, WI), following the instructions of Technical Bulletin 220. Primers for OCT1 and OCT2 were synthesized by the Biotechnology Support Facility at the University of Kansas Medical Center (Kansas City, KS). The primer sequences (5′–3′) were: OCT1-Forward primer, GATTTCCTTTACTCCGCTCTGGTC; OCT1-Reverse primer, TTTCTTTGGGCTTTGCTTTTCTCC; OCT2-Forward primer, GATTTCTTCTACTCTGCCCTGGTT; and OCT2-Reverse primer, GGATTTCTACTTTTGGTCTTGCTG [12].
Electrophoresis of PCR products, negative controls (reactions with no reverse transcriptase present), and BenchTop ΦX174 DNA/Hae III Markers (Promega, Madison, WI) was carried out on a 2% agarose gel, at 90 V for 1.5 hours. The gel was stained in a solution containing 0.5 pg/mL ethidium bromide on a rotating platform for 45 minutes, followed by four 10-minute washes in distilled water before viewing with a UV transilluminator.
In order to provide sufficient material for PCR product sequencing, the following steps were taken. A small piece of the 2% agarose gel below the desired PCR product band was cut out and replaced with 1% low-melt agarose. After electrophoresis of the band into the low-melt agarose, the slice of gel containing the PCR product was removed and purified with the Wizard® DNA Clean-up System (Promega, Madison, WI), following the instructions in Technical Bulletin 141. The purified PCR product was then inserted into a pCR®II-TOPO® plasmid vector using a TOPO TA Cloning kit from Invitrogen (Carlsbad, CA) with One Shot® TOP10F′ Chemically Competent E. coli cells, following instructions from the kit protocol (version R). The LB plates and broth (Becton Dickinson, Sparks, MD) contained 50 μg/mL kanamycin (Sigma, St. Louis, MO). Plasmid DNA was purified with the Wizard® Plus SV Minipreps DNA Purification System (Promega, Madison, WI), following the instructions of Technical Bulletin 225. Restriction digestion of the plasmids using the EcoR I restriction enzyme (Promega, Madison, WI) was carried out to verify successful PCR product cloning, and then the product sequencing was performed by the University of Kansas Medical Center Biotechnology Support Facility (Kansas City, KS).
2.8 Fluorescence Microscopy
BeWo cells were grown on a 4-well Falcon® Culture Slide (Becton Dickinson, Franklin Lakes, NJ). Preparatory coatings of poly-D-lysine and fibronectin, consistent with tissue culture plate preparation prior to uptake studies, preceded the seeding of BeWo cells at a density of 14,000 cells/cm². The cells on the microscope slide were incubated for about 24 hours at 37°C under saturated relative humidity and 5% CO2. The cells were not yet confluent at the point that the uptake of 4-Di-1-ASP was investigated, both with and without MitoTracker Deep Red 633 (Molecular Probes, Eugene, OR). Before these fluorescent compounds were added to the four chambers on the microscope slide, the cells were washed three times and equilibrated for 45 minutes in warm HBSS. Solutions of HBSS containing 2 μM 4-Di-1-ASP, 1 μM MitoTracker Deep Red 633, or both were added to the cells. After 30 minutes in a shaking hotbox (37°C), the solutions were aspirated and the cells were washed three times in ice-cold HBSS. The retainer dividing the chambers on the slide was removed and a cover glass was placed over the cells before the slide was analyzed with a Zeiss LSM 510 META Laser Scanning Microscope (Thornwood, NY).
For detection of 4-Di-1-ASP, the excitation and emission wavelengths were 477 nm and 557 nm, respectively. The excitation and emission wavelengths for detection of MitoTracker Deep Red 633 were 633 nm and 789 nm, respectively. To verify the spectral separation of these fluorescent compounds, cells dosed with only 4-Di-1-ASP were analyzed at the MitoTracker wavelengths (633/789 nm) and no signal was detected. Likewise, there was no fluorescence detection for the control cells exposed to only the MitoTracker compound when analyzed at 477/557 nm.
3. Results
Western blotting of BeWo cell lysates with antibodies for OCT1 and OCT2 gave bands between 50 and 64 kDa (not shown). These results suggested the presence of both OCT1 and OCT2 protein in BeWo cells.
The uptake of 4-Di-1-ASP in BeWo cells as a function of time was linear up to 30 minutes (R² = 0.974), so all other uptake studies in this work were for 30 minutes. Figure 1 presents the concentration-dependent uptake of 4-Di-1-ASP. Concentrations of 4-Di-1-ASP beyond 1 mM in aqueous solutions were not possible due to solubility limitations. This figure shows saturable uptake of 4-Di-1-ASP in BeWo cells, and when the data are fit to equation 1, a Km value of 580 ± 110 μM is obtained, together with Vmax = 97 ± 9 nmol/mg protein/30 min.
Figure 1.
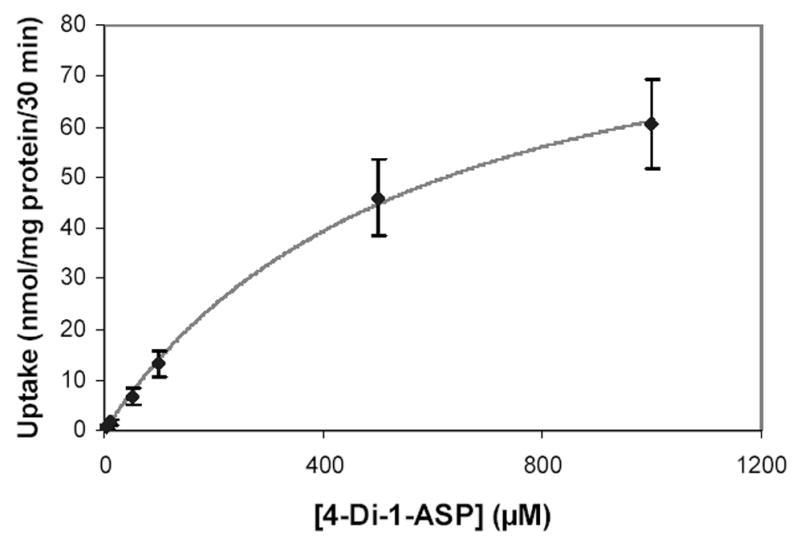
Uptake of 4-Di-1-ASP in BeWo cells as a function of 4-Di-1-ASP concentration. Uptake was measured at 37°C for 30 minutes. Each point and error bar represents the average and standard deviation of three to four determinations. The fitted line represents the fit of the data to equation 1.
The Arrhenius plot reflecting the temperature-dependence of 4-Di-1-ASP uptake in BeWo cells appears in Figure 2. The activation energy calculated from the slope of the Arrhenius plot is 52.9 ± 1.2 kJ/mol, suggestive of a carrier-mediated process.
Figure 2.

Arrhenius plot generated by the temperature-dependence of 4-Di-1-ASP uptake in BeWo cells. Uptake was measured for 30 minutes at various temperatures between 4°C and 37°C. The points and error bars represent the average and standard deviation from four determinations.
The sodium-dependence of 4-Di-1-ASP was investigated, and Figure 3 shows that the uptake of 4-Di-1-ASP is significantly increased when sodium is removed from the transport buffer. The uptake was also found to be electrogenic, as uptake decreased significantly when Na+ in the Krebs-Ringer buffer was replaced with K+ (not shown). The uptake of 4-Di-1-ASP is relatively constant between pH 7.0 and 8.4, and it decreases with decreasing pH below pH 6.4, as demonstrated in Figure 4.
Figure 3.

Sodium-dependence of 4-Di-1-ASP uptake in BeWo cells in Krebs-Ringer buffer containing 123 mM NaCl (control), or in buffer containing either 246 mM mannitol or 123 mM N-methyl-D-glucamine chloride (NMDG-Cl) in lieu of NaCl. * p < 0.05 compared to control.
Figure 4.

Uptake of 50 μM 4-Di-1-ASP in BeWo cells in Krebs Ringer buffer at various pH values, expressed as percent of control (pH = 6.81). The points and error bars represent the average and standard deviation from four determinations.
The inhibition of 4-Di-1-ASP uptake by several OCT inhibitors is shown in Figure 5. TEA, choline, and ergothioneine did not show any significant inhibition of 4-Di-1-ASP uptake in BeWo cells, but L-carnitine inhibited the uptake with an IC50 value of 1.3 ± 0.2 mM, as fit by equation 2.
Figure 5.
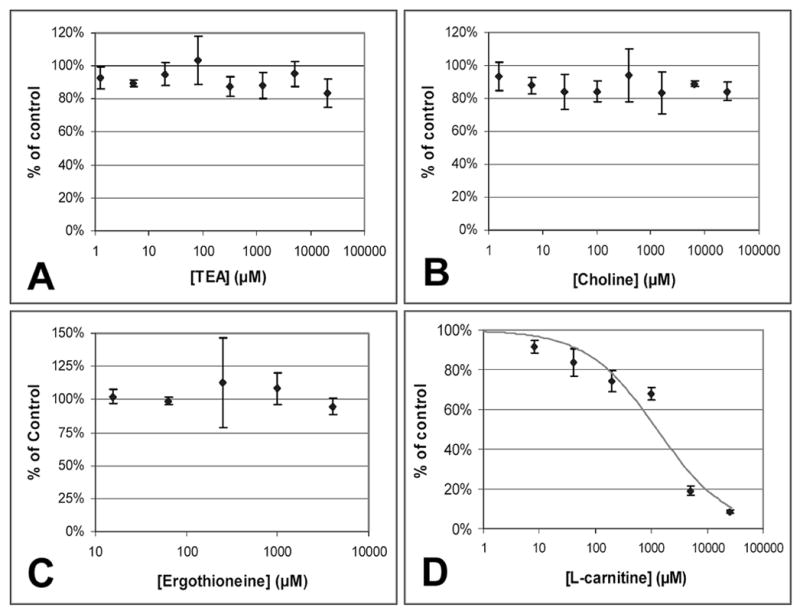
Inhibition of 4-Di-1-ASP uptake in BeWo cells by various concentrations of TEA (A), choline (B), L-ergothioneine (C), and L-carnitine (D). Inhibitors were premixed with 50 μM 4-Di-1-ASP in HBSS. Results of the 30-minute experiments at 37°C are presented as percent of control (50 μM 4-Di-1-ASP uptake in the absence of inhibitor). Each point and error bar represents the average and standard deviation for 3-4 determinations of uptake corrected for protein content. The fitted line in (D) reflects the IC50 value for L-carnitine as calculated with equation 2.
Figure 6 displays the effect of various compounds (at or near a concentration of 1 mM) on the uptake of 50 μM 4-Di-1-ASP. Spermidine, carnitine, cytidine, guanosine, and verapamil all show statistically significant (p < 0.05) inhibition of 4-Di-1-ASP uptake in BeWo cells, while ergothioneine, leucine, amiloride, MPP+, arginine, TEA, agmatine, choline, and methamphetamine do not significantly inhibit 4-Di-1-ASP at a concentration near 1 mM. It should be noted that although 1.6 mM methamphetamine resulted in an insignificant inhibition to only 83.1 ± 6.1% of control, it seems to be an outlying point, as a lower concentration of methamphetamine (400 μM) did cause significant inhibition of 4-Di-1-ASP uptake to 68.4 ± 6.2% of control.
Figure 6.
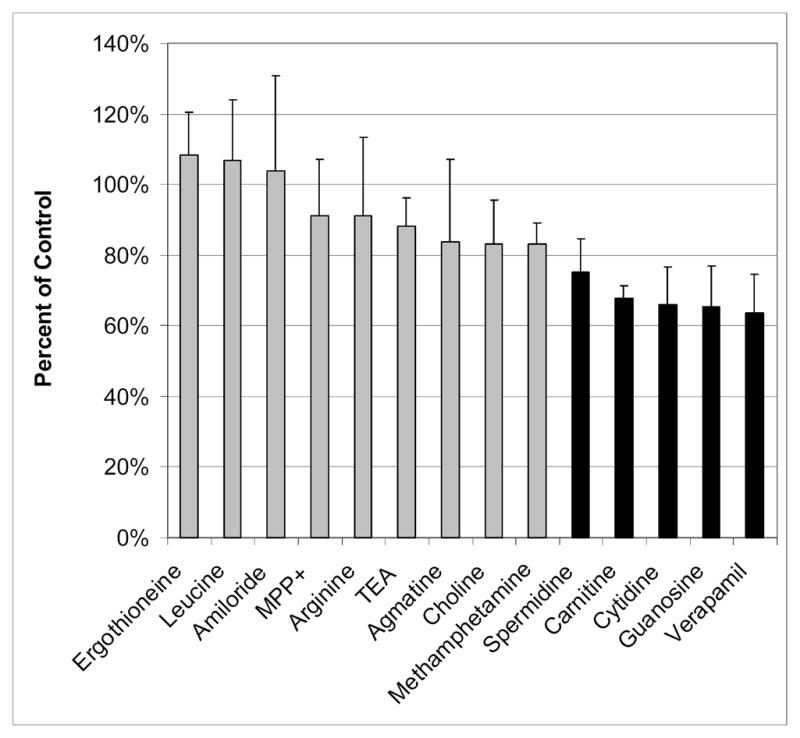
Inhibition of 4-Di-1-ASP uptake in BeWo cells by at least 1 mM of various compounds. The concentration of all of these inhibitors was 1 mM, except for TEA (1.28 mM), choline (1.6 mM), and methamphetamine (1.6 mM). Inhibitors were premixed with 50 μM 4-Di-1-ASP in HBSS. Results of the 30-minute experiments at 37°C are presented as percent of control (50 μM 4-Di-1-ASP uptake in the absence of inhibitor). Each point and error bar represents the average and standard deviation for 3-4 determinations of uptake corrected for protein content. The bars colored grey represent data points that are not significantly different from control (p > 0.05), and the bars colored in black represent data that are significant (p < 0.05).
A major dependence on membrane potential was not observed. BeWo cells were preincubated for 30 minutes with 1 μM gramicidin A or 10 μM valinomycin. (The valinomycin was solubilized in 0.5% ethanol and compared to control in 0.5% ethanol). Gramicidin A has been shown to reduce membrane potential and valinomycin increases membrane potential [19]. Figure 7 shows that although the uptake of 4-Di-1-ASP did increase slightly after pretreatment with gramicidin A and decrease slightly after pretreatment with valinomycin, the changes were not substantial.
Figure 7.

Uptake of 160 μM and 320 μM 4-Di-1-ASP in BeWo cells following 30-minute pretreatment with 1 μM gramicidin A or 10 μM valinomycin. Uptake was measured at 37°C at 30 minutes and corrected for protein content. Each point and error bar represents the average and standard deviation from three or four determinations.
Figure 8 shows that the transport of 4-Di-1-ASP was greater in the apical to basolateral (A → B) direction, indicating that the compound would cross the placenta in the direction from mother to fetus. If 4-Di-1-ASP were a substrate for an efflux transporter present in BeWo cells, the transport would have been higher in the B → A direction. The downward curvature of the plot of permeability versus concentration corresponds to saturation of a carrier-mediated system. For A → B transport, the calculated Km of 260 ± 140 μM shows a higher affinity than was observed in the uptake experiments, and the greater transport in the A → B direction can be attributed to its Vmax of 12.1 ± 3.6 nmol/15 min being 78% higher than the Vmax for B → A transport.
Figure 8.

Directional transport of 4-Di-1-ASP across a monolayer of BeWo cells cultured in Transwell® plates. The transport was determined at 37°C and 15 minutes. Each point represents the average and standard deviation of four determinations. The closed circles correspond to transport in the apical to basolateral (maternal to fetal) direction, and the open squares represent transport in the opposite direction. Permeability was calculated with equation 3.
The results of the RT-PCR analysis in Figure 9 indicate no expression of OCT1 in BeWo cells or in primary cultured cytotrophoblasts. This Figure also shows no expression of OCT2 mRNA in BeWo cells, but there appears to be a band for OCT2 in primary cultured cytotrophoblast cells. However, when this PCR product was sequenced, the result was not the sequence for OCT2, but rather, it was the code matching GenBank accession number CR595369, identified as cDNA clone CS0DI041YA22 from human placenta. The forward primer designed for OCT2 served as both the forward and reverse primers to generate this PCR product of 526 bp.
Figure 9.
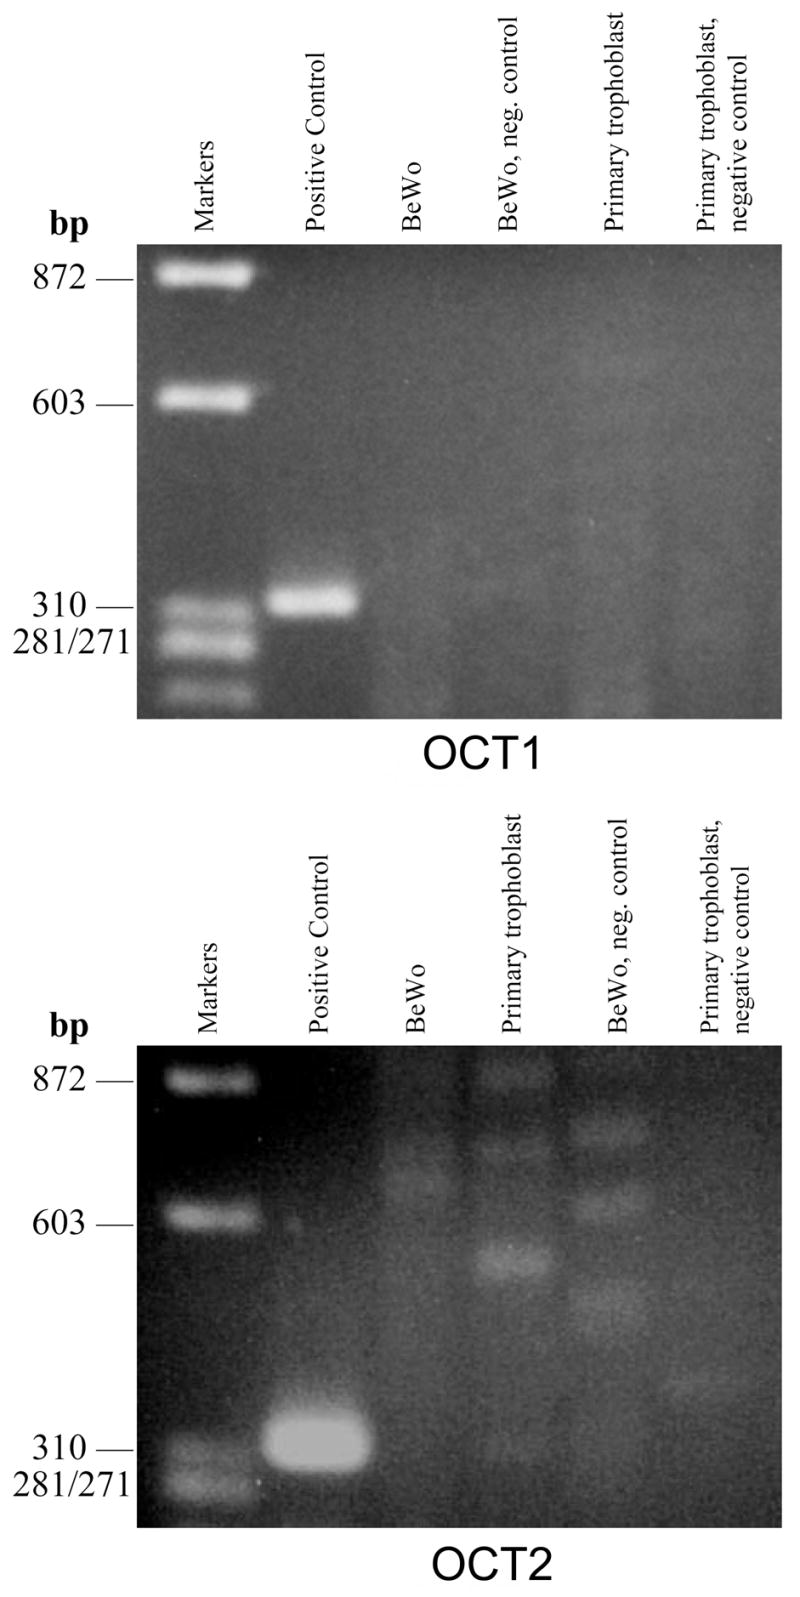
RT-PCR analysis of internal fragments of OCT1 & OCT2 cDNAs in the human placental trophoblast cells and BeWo cells. 100 ng of mRNA was used as a template to synthesize first strand fragments of OCT1 & OCT2 cDNAs by a 2-step RT-PCR process. Expected product sizes: Positive Control, 323 bp; OCT1, 487 bp; OCT2, 599 bp.
When the uptake of 4-Di-1-ASP in BeWo cells is compared to the uptake of the mitochondrial marker MitoTracker Deep Red 633 by fluorescence microscopy, Figure 10 shows colocalization of the two fluorescent compounds. The colocalization observed in this figure denotes the accumulation of 4-Di-1-ASP in the mitochondria. 4-Di-1-ASP also appears in the nuclear regions of the cells, where the MitoTracker is not present.
Figure 10.

Fluorescence microscopy of 2 μM 4-Di-1-ASP alone (A), 1 μM MitoTracker Deep Red 633 alone (B), and merged (C). Uptake of these compounds in BeWo cells grown on a microscope slide was at 37°C for 30 minutes. Detection settings for 4-Di-1-ASP: excitation, 477 nm; emission, 557 nm. For MitoTracker Deep Red 633: excitation, 633 nm; emission, 789 nm.
4. Discussion
The fluorescent organic cation 4-Di-1-ASP is taken up into BeWo cells via a low-affinity carrier-mediated process. The Km value for saturable uptake was 580 ± 110 μM, and the directional transport studies and the activation energy calculated from the temperature-dependence experiments (52.9 ± 1.2 kJ/mol) suggest that the uptake is not by passive diffusion. Rothbard et al. describe the role of membrane potential in the transport of cationic peptides into cells [19], and while the uptake of 4-Di-1-ASP in BeWo cells did increase slightly following valinomycin pretreatment and decrease slightly after preincubation with gramicidin A, the changes were not substantial (Figure 7), so modulation of membrane potential is not the predominant mechanism for 4-Di-1-ASP transport into BeWo cells.
Although Western blots suggested the presence of OCT1 and OCT2 in BeWo cells, the uptake of 4-Di-1-ASP was not inhibited by TEA, a compound that has a high affinity for OCT1 and OCT2. The IC50 values for inhibition of 4-Di-1-ASP uptake in HEK-293 cells transfected with OCT1 and OCT2 were 111 μM and 35 μM, respectively [2;3], but no inhibition was observed in BeWo cells (Figure 5A). OCT1 and OCT2 also have been shown to transport choline [20], but choline did not affect 4-Di-1-ASP uptake in BeWo cells.
This lack of inhibition by these OCT substrates means that the low-affinity uptake of 4-Di-1-ASP in BeWo cells is not mediated by OCT1 or OCT2. In fact, RT-PCR experiments showed that mRNA for OCT1 and OCT2 is not present in BeWo cells, so the Western blots were misleading. The antibodies for OCT1 and OCT2 used in this study may have been interacting with a homologous protein, such as OCTN1 or OCTN2. The molecular weights of all OCTs are between 61–63 kDa.
The original hypothesis for this study was that OCT1 or OCT2 would mediate the uptake of 4-Di-1-ASP in BeWo cells, and that this compound would thereby serve as a useful fluorescent substrate for future investigations of OCT function in this in vitro model of the placental barrier. While this hypothesis did not come to be, additional experiments were carried out to characterize the low-affinity uptake that was observed for 4-Di-1-ASP.
The pH-dependence of 4-Di-1-ASP uptake in BeWo cells was similar to that observed for OCTN2-mediated carnitine uptake [15], but the sodium-dependence was the opposite. While carnitine uptake was decreased with the removal of Na+ from the transport buffer, the uptake of 4-Di-1-ASP increased. The transport of 4-Di-1-ASP across this model of a trophoblast cell layer was asymmetric. The transport in the A → B (maternal-to-fetal) direction was significantly greater than the transport in the B → A direction, ruling out a predominant role of an efflux pump acting on this fluorescent organic cation.
The RT-PCR experiments showed that mRNA for OCT1 and OCT2 is not present in BeWo cells. A band initially believed to be for OCT2 was seen in mRNA from primary cultured cytotrophoblast cells. However, sequencing of this PCR product from the primary cultured cytotrophoblast mRNA revealed that the band in question was not OCT2.
Despite the misleading results from the Western blots, no evidence for OCT1 or OCT2 expression was observed in BeWo cells or in trophoblast cells isolated from human placenta. These findings are in agreement with the statements of Sata et al. [13] and Gründemann et al. [11], that OCT1 and OCT2 are not expressed in placenta. Weak expression of OCT2 and a splice variant dubbed OCT2-A in placenta is described by Urakami et al. [9], and placental expression of OCT2 is also reported in reviews by Koepsell et al. and You [7;8;10]. Investigations of OCT expression carried out by Alcorn et al. revealed PCR products for OCT1–but not OCT2–in placenta [12]. Results of Ming et al. [14] also indicate the placental presence of OCT1 and refute the expression of OCT2. Bottalico et al. recently reported the expression of both OCT1 and OCT2 mRNAs in scattered cells of placental vessel adventitias [21]. There are no prior investigations reported in the literature concerning OCT1 and OCT2 expression in BeWo cells.
The question of OCT1 and OCT2 expression in placenta to this point seems to have as much confusion as consensus in the literature. Three possible explanations for these apparent discrepancies include: (1) OCT1 and OCT2 are not present in trophoblast cells, but in other areas of the placenta, (2) there are interindividual differences in the expression of these transporters in placenta, or (3) the expression of OCT1 and OCT2 in placenta varies with gestational age.
Nevertheless, OCT1 and OCT2 were not found in BeWo cells or primary cultured cytotrophoblasts. It should be noted, however, that cytotrophoblasts from only one placenta were investigated in this work, so the results presented here cannot completely refute the possibility of interindividual differences in the expression of OCT1 and OCT2 in trophoblast cells.
The uptake of 4-Di-1-ASP in BeWo cells is not mediated by an organic cation transporter. Not only did TEA and choline fail to inhibit the uptake of 4-Di-1-ASP, but ergothioneine–a specific substrate for OCTN1 [22]–also showed no inhibitory effects (Figure 5C). Amiloride [6], MPP+ [15], and agmatine [23], three other OCT inhibitors, likewise showed no significant inhibition of 4-Di-1-ASP uptake (Figure 6).
Carnitine, however, did inhibit the uptake of 4-Di-1-ASP in BeWo cells (Figure 5D). Carnitine is a high-affinity substrate for OCTN2 [15], but its inhibition of 4-Di-1-ASP uptake does not imply that 4-Di-1-ASP uptake is OCTN2-mediated. If OCTN2 were involved, then TEA and MPP+ should have also inhibited the uptake. Another transport process for carnitine, the amino acid transporter ATB(0,+), demonstrates an affinity for carnitine (1.8 ± 0.4 mM) [24] that is similar to the IC50 value for carnitine’s inhibition of 4-Di-1-ASP in this work (1.3 ± 0.2 mM). However, the involvement of ATB(0,+) in mediating the uptake of 4-Di-1-ASP in BeWo cells was ruled out because leucine and arginine, two high-affinity substrates for ATB(0,+) [25], did not show any inhibition of 4-Di-1-ASP uptake.
While none of the compounds studied showed extensive inhibition at a concentration of 1 mM, significant inhibition to 60–80% of control was achieved with spermidine, carnitine, cytidine, guanosine, and verapamil (Figure 6). Spermidine has been shown to interact with mitochondrial membranes with low affinity [26]. While carnitine and verapamil are both substrates for OCTs [6;27], one of the physiological functions of carnitine is to assist in the beta-oxidation of fatty acids in the mitochondria, and verapamil can alter mitochondrial membrane potential [28]. Methamphetamine does not demonstrate significant inhibition of 4-Di-1-ASP at a concentration of 1.6 mM (Figure 6), but 400 μM methamphetamine did result in significant inhibition, and methamphetamine has also been shown to interfere with mitochondrial function [29;30].
The accumulation of 4-Di-1-ASP into the mitochondria of BeWo cells, demonstrated by its colocalization with MitoTracker Deep Red 633 in Figure 10, is in agreement with the observed inhibition by the compounds implicated in mitochondrial activities: spermidine, carnitine, verapamil, and methamphetamine. The low affinity uptake of 4-Di-1-ASP represented in the reported kinetic data may in fact reflect contributions due to mitochondrial uptake. The fluorescence microscopy experiment also showed uptake of 4-Di-1-ASP into the nuclear regions of cells, which agrees with the observed inhibition by cytidine and guanosine, two substrates for nucleoside transporters (hENTs) known to be present in BeWo cells [31;32]. Future studies will further address this likely possibility.
In summary, neither OCT1 nor OCT2 was found to be expressed in BeWo cells or in primary cultured cytotrophoblast cells isolated from a placenta immediately following an uncomplicated caesarean delivery. Although OCT1 and OCT2 are not present in the BeWo cell line, low-affinity uptake of the fluorescent organic cation 4-Di-1-ASP, a substrate for OCT1 and OCT2, was still observed in BeWo cells. The colocalization observed with fluorescence microscopy and inhibition studies demonstrated significant mitochondrial uptake of 4-Di-1-ASP. Transport of 4-Di-1-ASP into the nuclear region of BeWo cells was also observed, which is likely mediated by a nucleoside transporter. While it was hoped that 4-Di-1-ASP could serve as a model OCT substrate for studying drug transport in the placental barrier, the lack of expression of OCT1 and OCT2 in trophoblast cells prevents this particular application.
Acknowledgments
The authors wish to express thanks to Sue Platt for her help with isolating the primary cultured cytotrophoblast cells, to David Moore and Murali Duvvuri for their assistance with the fluorescence microscope, to Pallabi Mitra, Claudia Bode, and Krisitin Barkus for help with the PCR product sequencing, and to Jeff Krise for suggestions. Financial support for this work was provided by the Madison and Lila Self Graduate Fellowship, the University of Kansas Department of Pharmaceutical Chemistry, and grant HD039878.
Footnotes
Publisher's Disclaimer: This is a PDF file of an unedited manuscript that has been accepted for publication. As a service to our customers we are providing this early version of the manuscript. The manuscript will undergo copyediting, typesetting, and review of the resulting proof before it is published in its final citable form. Please note that during the production process errors may be discovered which could affect the content, and all legal disclaimers that apply to the journal pertain.
Reference List
- 1.Mason JN, Farmer H, Tomlinson ID, Schwartz JW, Savchenko V, DeFelice LJ, Rosenthal SJ, Blakely RD. Novel fluorescence-based approaches for the study of biogenic amine transporter localization, activity, and regulation. J Neurosci Methods. 2005;143:3–25. doi: 10.1016/j.jneumeth.2004.09.028. [DOI] [PubMed] [Google Scholar]
- 2.Ciarimboli G, Struwe K, Arndt P, Gorboulev V, Koepsell H, Schlatter E, Hirsch JR. Regulation of the human organic cation transporter hOCT1. J Cell Physiol. 2004;201:420–428. doi: 10.1002/jcp.20081. [DOI] [PubMed] [Google Scholar]
- 3.Cetinkaya I, Ciarimboli G, Yalcinkaya G, Mehrens T, Velic A, Hirsch JR, Gorboulev V, Koepsell H, Schlatter E. Regulation of human organic cation transporter hOCT2 by PKA, PI3K, and calmodulin-dependent kinases. Am J Physiol Renal Physiol. 2003;284:F293–F302. doi: 10.1152/ajprenal.00251.2002. [DOI] [PubMed] [Google Scholar]
- 4.Ganapathy V, Prasad PD, Ganapathy ME, Leibach FH. Placental transporters relevant to drug distribution across the maternal-fetal interface. J Pharmacol Exp Ther. 2000;294:413–420. [PubMed] [Google Scholar]
- 5.Gorboulev V, Ulzheimer JC, Akhoundova A, Ulzheimer-Teuber I, Karbach U, Quester S, Baumann C, Lang F, Busch AE, Koepsell H. Cloning and characterization of two human polyspecific organic cation transporters. DNA Cell Biol. 1997;16:871–881. doi: 10.1089/dna.1997.16.871. [DOI] [PubMed] [Google Scholar]
- 6.Wessler I, Roth E, Deutsch C, Brockerhoff P, Bittinger F, Kirkpatrick CJ, Kilbinger H. Release of non-neuronal acetylcholine from the isolated human placenta is mediated by organic cation transporters. Br J Pharmacol. 2001;134:951–956. doi: 10.1038/sj.bjp.0704335. [DOI] [PMC free article] [PubMed] [Google Scholar]
- 7.Koepsell H, Endou H. The SLC22 drug transporter family. Pflugers Arch. 2004;447:666–676. doi: 10.1007/s00424-003-1089-9. [DOI] [PubMed] [Google Scholar]
- 8.Koepsell H, Schmitt BM, Gorboulev V. Organic cation transporters. Rev Physiol Biochem Pharmacol. 2003;150:36–90. doi: 10.1007/s10254-003-0017-x. [DOI] [PubMed] [Google Scholar]
- 9.Urakami Y, Akazawa M, Saito H, Okuda M, Inui K. cDNA cloning, functional characterization, and tissue distribution of an alternatively spliced variant of organic cation transporter hOCT2 predominantly expressed in the human kidney. J Am Soc Nephrol. 2002;13:1703–1710. doi: 10.1097/01.asn.0000019413.78751.46. [DOI] [PubMed] [Google Scholar]
- 10.You G. The role of organic ion transporters in drug disposition: an update. Curr Drug Metab. 2004;5:55–62. doi: 10.2174/1389200043489207. [DOI] [PubMed] [Google Scholar]
- 11.Grundemann D, Liebich G, Kiefer N, Koster S, Schomig E. Selective substrates for non-neuronal monoamine transporters. Mol Pharmacol. 1999;56:1–10. doi: 10.1124/mol.56.1.1. [DOI] [PubMed] [Google Scholar]
- 12.Alcorn J, Lu X, Moscow JA, McNamara PJ. Transporter gene expression in lactating and nonlactating human mammary epithelial cells using real-time reverse transcription-polymerase chain reaction. J Pharmacol Exp Ther. 2002;303:487–496. doi: 10.1124/jpet.102.038315. [DOI] [PubMed] [Google Scholar]
- 13.Sata R, Ohtani H, Tsujimoto M, Murakami H, Koyabu N, Nakamura T, Uchiumi T, Kuwano M, Nagata H, Tsukimori K, Nakano H, Sawada Y. Functional analysis of organic cation transporter 3 expressed in human placenta. J Pharmacol Exp Ther. 2005;315:888–895. doi: 10.1124/jpet.105.086827. [DOI] [PubMed] [Google Scholar]
- 14.Ming X, Bourdet D, Thakker D. Gene Expression Profile of Human Organic Cation Transporters Along the Gastrointestinal Tract and in Caco-2 Cells. AAPS J. 2005;7(S2):Abstract R6268. [Google Scholar]
- 15.Rytting E, Audus KL. Novel organic cation transporter 2-mediated carnitine uptake in placental choriocarcinoma (BeWo) cells. J Pharmacol Exp Ther. 2005;312:192–198. doi: 10.1124/jpet.104.072363. [DOI] [PubMed] [Google Scholar]
- 16.Said HM, Ortiz A, Vaziri ND. Mechanism and regulation of vitamin B-6 uptake by renal tubular epithelia: studies with cultured OK cells. Am J Physiol Renal Physiol. 2002;282:F465–F471. doi: 10.1152/ajprenal.00267.2001. [DOI] [PubMed] [Google Scholar]
- 17.Bode C, Jin H, Rytting E, Silverstein PS, Young A, Audus KL. In vitro Models for Studying Trophoblast Transcellular Transport. In: Soares MJ, Hunt JS, editors. Placenta and Trophoblast: Methods and Protocols. II. Humana Press; Totowa, NJ: 2005. [DOI] [PMC free article] [PubMed] [Google Scholar]
- 18.Petroff MG, Phillips TA, Ka H, Pace JL, Hunt JS. Isolation and culture of term human trophoblast cells. Methods Mol Med. 2005;121:201–216. doi: 10.1385/1-59259-983-4:201. [DOI] [PubMed] [Google Scholar]
- 19.Rothbard JB, Jessop TC, Lewis RS, Murray BA, Wender PA. Role of membrane potential and hydrogen bonding in the mechanism of translocation of guanidinium-rich peptides into cells. J Am Chem Soc. 2004;126:9506–9507. doi: 10.1021/ja0482536. [DOI] [PubMed] [Google Scholar]
- 20.Koehler MR, Wissinger B, Gorboulev V, Koepsell H, Schmid M. The two human organic cation transporter genes SLC22A1 and SLC22A2 are located on chromosome 6q26. Cytogenet Cell Genet. 1997;79:198–200. doi: 10.1159/000134720. [DOI] [PubMed] [Google Scholar]
- 21.Bottalico B, Larsson I, Brodszki J, Hernandez-Andrade E, Casslen B, Marsal K, Hansson SR. Norepinephrine transporter (NET), serotonin transporter (SERT), vesicular monoamine transporter (VMAT2) and organic cation transporters (OCT1, 2 and EMT) in human placenta from pre-eclamptic and normotensive pregnancies. Placenta. 2004;25:518–529. doi: 10.1016/j.placenta.2003.10.017. [DOI] [PubMed] [Google Scholar]
- 22.Grundemann D, Harlfinger S, Golz S, Geerts A, Lazar A, Berkels R, Jung N, Rubbert A, Schomig E. Discovery of the ergothioneine transporter. Proc Natl Acad Sci U S A. 2005;102:5256–5261. doi: 10.1073/pnas.0408624102. [DOI] [PMC free article] [PubMed] [Google Scholar]
- 23.Grundemann D, Hahne C, Berkels R, Schomig E. Agmatine is efficiently transported by non-neuronal monoamine transporters extraneuronal monoamine transporter (EMT) and organic cation transporter 2 (OCT2) J Pharmacol Exp Ther. 2003;304:810–817. doi: 10.1124/jpet.102.044404. [DOI] [PubMed] [Google Scholar]
- 24.Nakanishi T, Hatanaka T, Huang W, Prasad PD, Leibach FH, Ganapathy ME, Ganapathy V. Na+- and Cl--coupled active transport of carnitine by the amino acid transporter ATB(0,+) from mouse colon expressed in HRPE cells and Xenopus oocytes. J Physiol. 2001;532:297–304. doi: 10.1111/j.1469-7793.2001.0297f.x. [DOI] [PMC free article] [PubMed] [Google Scholar]
- 25.Sloan JL, Mager S. Cloning and functional expression of a human Na(+) and Cl(-)-dependent neutral and cationic amino acid transporter B(0+) J Biol Chem. 1999;274:23740–23745. doi: 10.1074/jbc.274.34.23740. [DOI] [PubMed] [Google Scholar]
- 26.Toninello A, Salvi M, Mondovi B. Interaction of biologically active amines with mitochondria and their role in the mitochondrial-mediated pathway of apoptosis. Curr Med Chem. 2004;11:2349–2374. doi: 10.2174/0929867043364559. [DOI] [PubMed] [Google Scholar]
- 27.Wu X, Huang W, Prasad PD, Seth P, Rajan DP, Leibach FH, Chen JW, Conway SJ, Ganapathy V. Functional characteristics and tissue distribution pattern of organic cation transporter 2 (OCTN2), an organic cation/carnitine transporter. J Pharmacol Exp Ther. 1999;290:1482–1492. [PubMed] [Google Scholar]
- 28.Spalletti-Cernia D, D'Agnano I, Sorrentino R, Zupi G, Vecchio G, Portella G, Laccetti P. Verapamil reverts resistance to drug-induced apoptosis in Ki-ras-transformed cells by altering the cell membrane and the mitochondrial transmembrane potentials. Oncol Res. 2002;13:25–35. doi: 10.3727/096504002108747935. [DOI] [PubMed] [Google Scholar]
- 29.Burrows KB, Gudelsky G, Yamamoto BK. Rapid and transient inhibition of mitochondrial function following methamphetamine or 3,4-methylenedioxymethamphetamine administration. Eur J Pharmacol. 2000;398:11–18. doi: 10.1016/s0014-2999(00)00264-8. [DOI] [PubMed] [Google Scholar]
- 30.Virmani A, Gaetani F, Imam S, Binienda Z, Ali S. Possible mechanism for the neuroprotective effects of L-carnitine on methamphetamine-evoked neurotoxicity. Neuroprotective Agents. 2003;993:197–207. doi: 10.1111/j.1749-6632.2003.tb07530.x. [DOI] [PubMed] [Google Scholar]
- 31.Ward JL, Sherali A, Mo ZP, Tse CM. Kinetic and pharmacological properties of cloned human equilibrative nucleoside transporters, ENT1 and ENT2, stably expressed in nucleoside transporter-deficient PK15 cells. Ent2 exhibits a low affinity for guanosine and cytidine but a high affinity for inosine. J Biol Chem. 2000;275:8375–8381. doi: 10.1074/jbc.275.12.8375. [DOI] [PubMed] [Google Scholar]
- 32.Mani RS, Hammond JR, Marjan JM, Graham KA, Young JD, Baldwin SA, Cass CE. Demonstration of equilibrative nucleoside transporters (hENT1 and hENT2) in nuclear envelopes of cultured human choriocarcinoma (BeWo) cells by functional reconstitution in proteoliposomes. J Biol Chem. 1998;273:30818–30825. doi: 10.1074/jbc.273.46.30818. [DOI] [PubMed] [Google Scholar]