

Abstract
The authors investigated whether visual fixations during a continuous graphical task were related to arm endpoint kinematics, joint motions, or joint control. The pattern of visual fixations across various shapes and the relationship between temporal and spatial events of the moving limb and visual fixations were assessed. Participants (N = 16) performed movements of varying shapes by rotating the shoulder and elbow joints in the transverse plane at a comfortable pace. Across shapes, eye movements consisted of a series of fixations, with the eyes leading the hand. Fixations were spatially related to modulation of joint motion and were temporally related to the portions of the movement where curvature was the highest. Gathering of information related to modulation of interactive torques arising from passive forces from movement of a linked system occurred when the velocity of the movement (a) was the lowest and (b) was ahead of the moving limb, suggesting that that information is used in a feedforward manner.
Keywords: coordination, limb control, oculomotor control
Many of our daily activities involve coordinated motion of multiple body segments through the environment. Vision provides information about the environment, and that information is integrated with other sources of information regarding the effector’s position so that we can achieve the movement goal. It is probable that the eyes move with a combination of smooth pursuit and saccadic movements. Researchers have shown that during movements that require precision, namely, identifying and preparing to manipulate objects, the eyes fixate and shift gaze several times so that they can gather information (Angel, Alston, & Garland, 1970; Biguer, Jeannerod, & Prablanc, 1982; Johansson, Westling, Backstrom, & Flanagan, 2001; Land, 1992; Land & McLeod, 2000; Land, Mennie, & Rusted, 1999; Neggers & Bekkering, 1999, 2000, 2001, 2002; Pelisson, Prablanc, Goodale, & Jeannerod, 1986; Prablanc, Echallier, Komilis, & Jeannerod, 1979). For example, Johansson and colleagues investigated the coordination of eye saccades and hand movements in a functional goal-directed task. Participants had to grasp a bar, move it over an obstacle, and hit a target. Results demonstrated that participants consistently made saccades to distinct points, namely, the bar to be grasped and the target to be hit. Furthermore, participants did not saccade to the next position until the hand reached that current position (for the bar and the target). Thus, when participants were not given instructions with respect to eye movements in that goal-oriented task, their eyes made saccadic movements related to accurate control of the hand and did not make smooth pursuit movements. Specifically, the results of the cited research suggest that vision provides the central nervous system with information about the ongoing movement that is relevant to minimizing movement error and maximizing accuracy.
In contrast, in manual-tracking tasks, in which a continually moving target is tracked with the hand and eyes, the eyes move in a smooth pursuit manner following a target whose motion is controlled by the hand (Vercher, Lazzari, & Gauthier, 1997). In such tasks, however, participants are instructed to coordinate their eye and hand movements in pursuit of the moving target.
Although the role of visual gaze in goal-directed discrete movements and in manual-tracking movements has been examined extensively, less is known about the role of oculomotor control in continuous arm movements in which a single target (object to manipulate) or termination point is not defined but, instead, accuracy of control is important throughout the movement, as, for example, in a graphical drawing task. Are the eyes directed to specific spatial locations of the ongoing movement, and are those locations, or anchor points, related to a particular control characteristic or characteristics (endpoint control, joint kinematics, joint kinetics) of the movement?
In previous work, Dounskaia and colleagues have examined the coordination of multiple joints in cyclical drawing tasks (Dounskaia, 2005; Dounskaia, Ketcham, Leis, & Stelmach, 2005; Dounskaia, Ketcham, & Stelmach, 2002a, 2002b; Dounskaia & Stelmach, 2001; Ketcham, Dounskaia, Seidler, & Stelmach, 2000; Ketcham, Dounskaia, & Stelmach, 2004a, 2004b). They manipulated the coordination between the shoulder and elbow joints to determine the role of passive and active joint torques in the control and regulation of movement in the transverse plane. Movement of one joint generates passive torque—interactive torque (IT)—on all adjoining segments and must be considered and modulated by the sensorimotor system. Several researchers have demonstrated that in a movement, IT is a pronounced mechanical factor influencing multiarticular movements (Dounskaia et al., 2002a, 2002b; Dounskaia, Swinnen, & Walter, 2000; Dounskaia, Swinnen, Walter, Spaepen, & Verschueren, 1998; Dounskaia, Van Gemmert, & Stelmach, 2000; Galloway & Koshland, 2002; Gribble & Ostry, 1999; Hollerbach & Flash, 1982; Levin, Ouamer, Steyvers, & Swinnen, 2001). Specifically, the role of IT depends on joint velocities and accelerations, and IT must be regulated with active control—muscle torque (MT)—so that the desired endpoint control can be achieved. Researchers have shown that during multijoint movements, the sensorimotor system controls each segment of a linked system in a feedforward manner, with consideration of adjoining segments (Gribble & Ostry; Hollerbach & Flash). For example, Gribble and Ostry demonstrated that to flex and extend the elbow, which is typically thought of as a single-joint movement, the sensorimotor system must control the shoulder to maintain stability, and only the elbow can be moved.
Dounskaia and colleagues (Dounskaia, 2005; Dounskaia et al., 2002a, 2002b; Dounskaia, Swinnen, et al., 2000; Dounskaia et al., 1998; Dounskaia, Van Gemmert, et al., 2000) have recently proposed an interpretation of the control strategy used by the sensorimotor system to regulate the influence of IT with MT, namely, the Leading Joint Hypothesis. According to the hypothesis, the system establishes roles for joints based on the desired trajectory control. For example, in a cyclical drawing task similar to the one used in the present study, the shoulder MT is responsible for the global components of the movement (i.e., size and cycling frequency) and produces a large IT at the elbow, whereas detailed MT activity is required so that the elbow can modulate the role of IT in the production of the desired shape. The main mover, in that case the shoulder, is termed the leading joint; and the modulating joint, in that case the elbow, is called the subordinate joint. It has been demonstrated that at high movement speeds and in the absence of vision, participants do not fully compensate for IT produced at the subordinate joint, which results in distortions of the hand trajectory (Dounskaia et al., 2005; Dounskaia, Van Gemmert, et al., 2000; Ketcham et al., 2004a, 2004b). More specifically, the resulting IT created at the subordinate joint is substantially larger at high movement speeds, when the leading joint has to rotate at a high frequency, than it is at slower movement frequencies. At those high speeds, MT at the elbow is unable to modulate the influence of the IT created by rotations at the shoulder, and, subsequently, trajectories are compromised and distorted. To accurately modulate the influence of IT, MT at the elbow must increase and must occur in a timely manner in relation to IT. The ability to modulate IT with MT at the elbow is compromised at lower speeds when vision is occluded. That finding suggests that the role of feedback in MT generation and in tuning to changes in IT is specifically important at the elbow.
Thus, of interest in the present study was the question of what information vision provides at lower movement frequencies that allows for accurate control of the ongoing movement. Events related to the occurrence of IT created by the shoulder at the elbow and the compensation of those torques by MT at the elbow are important in multijoint control, and the sensorimotor system may evaluate and integrate them into the ongoing movement to produce accurate trajectories. Movements distort at lower speeds in the absence of vision than they do when vision is available (Dounskaia et al., 2005; Dounskaia et al., 2002b), and that finding suggests that vision provides some feedforward information to the system that must be integrated into the control and regulation of the movement. Subsequently, Dounskaia and colleagues hypothesized that visual fixations would be directed toward locations where MT at the elbow has the highest magnitude and where IT created by rotations of the shoulder has to be modulated, representing the first type of anchor point: joint kinetics.
Although one may predict on the basis of the previous work of Dounskaia and colleagues that kinetic anchor points may be the most important information the visuomotor system can gather to regulate the ongoing movement, we turned to the literature to determine whether there are other prominent candidates for anchor points that visual fixations would be directed toward. Visual fixations at the target location during discrete movements have been reported repeatedly (Neggers & Bekkering, 1999, 2000, 2001, 2002). In those movements, the eyes make saccades and fixate the end target before the hand moves there. The spatial location of fixations is related to the final hand position, and thus it is probable that vision provides information to the central nervous system about the moving limb and where to terminate the movement. That information most likely includes positional features but may also include temporal features relevant to the control of the limb. Less is known about where the eyes are directed during continuous movements. In recent work by Reina and Schwartz (2003) on a cyclical oval-drawing task in monkeys, visual gaze fixated cyclically on the points of highest curvature. Those points of highest curvature may serve as anchor points or, more specifically, may provide the system with necessary information regarding the size and shape of the trajectory. Points of highest curvature have been of interest for many researchers because those are where the velocity of a movement is the lowest, as stated by the two-thirds power law (de’Sperati & Viviani, 1997; Lacquaniti, Terzuolo, & Viviani, 1982; Viviani & Flash, 1995; Viviani & Terzuolo, 1982). Thus, one possibility is that anchor points that attract visual fixations may be points of highest curvature.
Points of maximum curvature often occur near the location where the joint’s movement changes direction. Researchers have shown that joint rotation reversals are an important feature of control because it is thought that trajectory formation dependent on curvature and direction is represented in intrinsic (joint) coordinates (Krakauer, Ghilardi, & Ghez, 1999; Krakauer, Pine, Ghilardi, & Ghez, 2000; Nakano et al., 1999). The results of the cited studies have suggested that joint kinematics (peak joint amplitudes and timing of flexion and extension of joints) are the most important feature of control. Thus, another possible defined set of anchor points is related to joint kinematics, specifically reversals of the shoulder, the elbow, or both.
Thus, at least three types of movement characteristics related to endpoint kinematics, joint motions, and joint kinetics may attract visual gaze. Our aim in the present study was to examine whether visual fixations are spatially or temporally related to any of the three types of defined movement characteristics and anchor points. We recorded eye movements while participants performed continuous drawing movements of various shapes. The shapes were a circle, three lines, and three ovals oriented mediolaterally (horizontally), anteroposteriorly (vertically), and at a northwest–southeast angle (tilted left). Because of the varying shapes, participants had to produce rhythmic flexions and extensions at the shoulder and elbow joint, with the joint amplitudes and phase offset varying across shapes. In previous studies, the examined movements were found to be characterized by differential difficulties of IT compensation with MT (Dounskaia et al., 2002a, 2002b; Galloway & Koshland, 2002; Gribble & Ostry, 1999). The manipulation of template shape caused changes in the coordination of joint reversals and joint control characteristics (Dounskaia et al., 2002a). With those shape manipulations, the relationship of anchor points (endpoint kinematics, joint motion, and joint kinetics) varied across the shapes, and we therefore were able to determine whether the pattern of visual fixations was predominantly associated with or directed toward any of those defined movement characteristics and anchor points across shapes.
Method
Participants
We recruited as participants 18 right-handed young adults (age = 21.8 ± 2.8 years) from the Arizona State University campus. Data from 2 participants were excluded from the analysis because joint angle data were missing, and thus 16 participants’ data were analyzed. Before testing, participants read and signed a written informed consent form in accordance with both Institutional Review Board requirements and the ethical standards laid down in the 1964 Declaration of Helsinki; they also completed a health history questionnaire and information sheet. Participants with any known neurological disorder or participants who were unable to comfortably move their dominant arm were excluded from this study.
Apparatus
Participants performed drawing movements on a Wacom digitizer housed in a customized table (Figure 1A). We used OASIS software (De Jong, Hulstijn, Kosterman, & Smits-Engelsman, 1996) to program a custom experimental protocol program that displayed instructions and movement templates and collected and displayed the x and y stylus-tip coordinates at 206 Hz with a resolution of 0.01 mm or 1,000 lines/cm during the course of the movement. We recorded eye movements by using the EyeLink I helmet-like system (Sensorimotoric Systems, Teltow, Berlin, Germany), a video-based pupil tracker, with head-compensation system sampling at 250 Hz, gaze resolution = 0.0005°, and gaze position accuracy = 0.5°–1.0° average error (Figure 1B). We measured pupil position via two small infrared CCD video cameras mounted on an adjustable headband. We analyzed the eye movement and digitizer data offline with MATLAB Version 6.5 (The MathWorks, Natick, MA).
FIGURE 1.
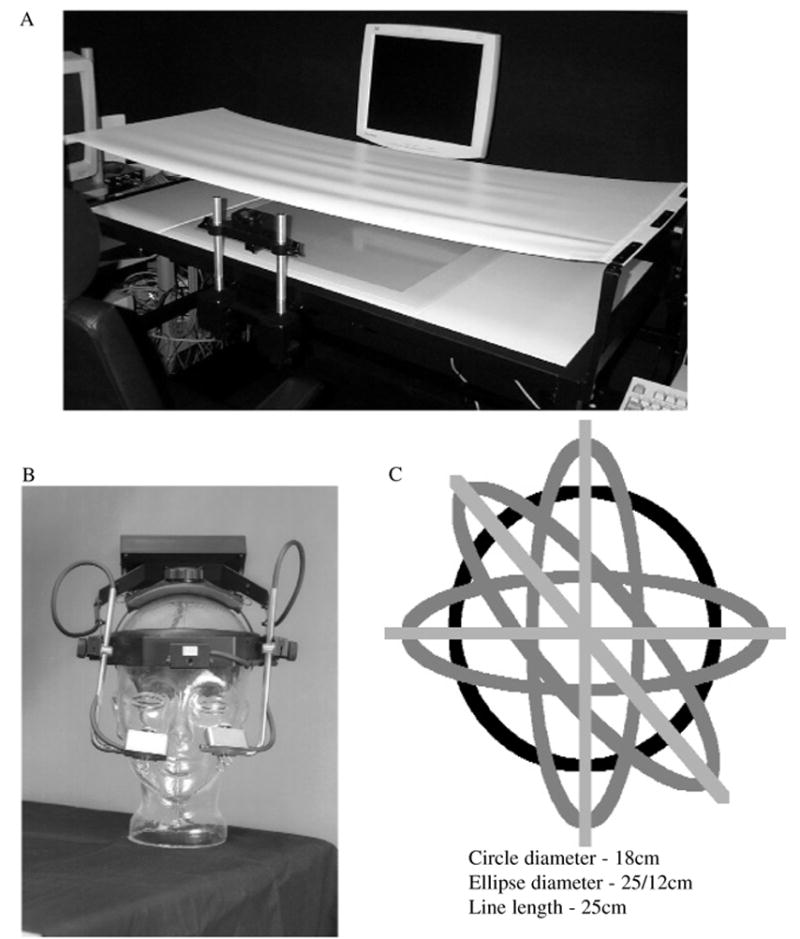
(A) Digitizer setup with tablet inset in table, high-back chair, and chin rest centered in front of screen. (B) Eye-tracking helmet worn by participants. (C) Depiction of the seven shapes performed.
Movements were constrained to only flexion and extension of the shoulder and elbow joints in the transverse plane. Participants grasped a noninking digitizer stylus in a power grip to constrain movement of the finger joints. A wrist guard immobilized their wrist. Participants’ arm was held in a custom-made air-sled so that friction on the surface and fatigue of the shoulder were reduced and shoulder motion was constrained to only flexion and extension in the transverse plane. Participants’ chin was placed in a chin rest, and their torso was situated tightly between the table and high-back chair so that trunk motion could be constrained.
We placed a cover over the participants’ arm to prevent them from visually monitoring their movements on the tabletop. A cursor representing their endpoint trajectory was displayed on a large monitor (19 in., 96 DPI) centered in front of them at eye level, 76 cm away from their body, with a stimulus extent of 18 cm or a 20° angular extent. The monitor displayed the shape templates in real size and the endpoint motion in real time. We adjusted the height of the digitizing tablet (inset into a table) such that the shoulder and extended arm moved in the transverse plane at shoulder height, parallel to the floor (Figure 1A).
Procedure and Design
Before and following experimental testing, we measured anthropometrical characteristics for each of the participants while they held the stylus in two defined reference locations for 12 s. Those included height, weight, length from pen tip to elbow, length from elbow to shoulder, and length from stylus tip to shoulder. Reference points were the same for all participants. Body position (the chin) was centered in front of computer screen and on the digitizing tablet. We used the segment measurements to compute joint angles for each participant (see Appendix). For kinetic analysis, we estimated segment masses, locations of center of mass, and moments of inertia about transverse axes passing through the joint centers by using statistical data based on participants’ heights and weights (Chaffin & Anderson, 1984).
We used the seven following shape templates (see Figure 1C): circle (C); horizontal line oriented mediolaterally (HL); vertical line oriented anteroposteriorly (VL); line tilted left and oriented at a northwest–southeast angle (LL); horizontal oval (HO); vertical oval (VO); and oval tilted left (LO). The length of the lines and the major axis of the ovals was 25 cm, the minor axis of the oval was 12 cm, and the diameter of the circle was 18 cm. The shapes were similar to those used in previous studies in which the relationship between shape, orientation, and speed, and kinematic and kinetic features of control were examined (Dounskaia et al., 2005; Dounskaia et al., 2002a, 2002b; Ketcham et al., 2004a, 2004b).
We instructed participants to make smooth rhythmic movements at a comfortable pace. Using only shoulder and elbow flexion and extension movements, participants drew trajectories on the digitizing tablet, with movements constrained to the transverse plane. There was some concern that the shoulder and trunk would move substantially, even with the constraints imposed, which would cause movement of the proximal end of the upper arm, and result in inaccurate equations of motion. Through an additional control experiment1 and analysis protocol, we confirmed that the joint positions estimated from endpoint position and assuming a stable trunk were reliable.
All participants performed a practice block (20+ trials) in which they became familiar with the movements on the digitizing tablet so that we could ensure they were comfortable and had sufficient understanding of the task. The presentation of shapes was completely randomized across participants. Participants completed 4 trials for each shape condition for a total of 28 trials. Each trial was recorded for 12 s.
Defined movement characteristics and anchor points
On the basis of previous literature, we predicted events related to control as possible anchor points for visual fixations. Those included the following:
Endpoint kinematics: points of maximum curvature of the hand trajectory (PeakLineCurve).
Joint motion: (a) maximum and minimum shoulder excursions (PeakShlAmp) and (b) maximum and minimum elbow excursions (PeakElbAmp).
Joint kinetics: (a) maximum and minimum elbow muscle torques (PeakMTE) and (b) maximum impulse of elbow muscle torque (MaxImpMTE), that is, regions where elbow muscle torque contributed the most to elbow net torque (described in detail in the Kinetic Analysis section).
Analysis
We filtered stylus position data with a 15-Hz cut-off, low-pass Butterworth digital filter and used the result for the following computations.
Peak curvature analysis
We determined curvature of the trajectory on the basis of
where x and y are the coordinates of the endpoint. The points of maximum curvature were then determined. For lines, they occurred at movement reversals.
Kinematic analysis
We used the anthropometric characteristics measured before and at the end of the experiment at two reference locations to compute joint angles during motion; we assumed that the shoulder position was stable (see Appendix for details). We used peak shoulder flexion to partition movements into cycles. The average amplitude of the elbow and shoulder rotations and the relative phase between them for each shape were computed. To compute relative phase, we calculated the phase angle at each joint for each sample of the angular displacement time series, using the following formula (R. C. Schmidt, Treffner, Shaw, & Turvey, 1992): φI = arctan (xi/Δxi). Here, xi is the angular velocity at sample i divided by the mean angular frequency for the trial, and Δxi is the displacement at sample i minus the average of the displacement for the trial. We computed the relative phase between the joints by subtracting elbow phase angle from shoulder phase angle, with values between 0° and 360° (at 0° and 360°, shoulder and elbow flex and extend simultaneously; at 180°, shoulder and elbow flex and extend in opposition). We used circular statistic methods to calculate mean values and standard deviations of relative phase (Mardia, 1972).
Kinetic analysis
In addition, we used angular displacements at the elbow and shoulder to compute torques at the shoulder and elbow in the same way as in Dounskaia et al. (2002a). The torque components at each joint are as follows: Net torque (NT) is proportional to angular acceleration at the joint, IT depends on the motion at both joints, and generalized MT includes the active component resulting from muscle activity and the passive component resulting from the viscoelastic properties of muscles, tendons, ligaments, and various periarticular tissues at the joint. We did not take gravitational torque into account; we assumed it to be equal to zero because the movements were performed in the horizontal plane. The three torque components are bounded by the relationship NT = MT + IT.
We performed torque analysis to reveal the role of MT and IT in the production of movement at the elbow. On the basis of the relationship NT = MT + IT, we calculated the impulse of MT as the portion of NT that was produced by MT (Dounskaia et al., 2002b). When MT and NT had the same sign, the impulse of MT was high. We labeled the maximal value of that characteristic MaxImpMTE. In addition, we determined and analyzed the timing of peak magnitudes of elbow MT in the negative (extension) and positive (flexion) directions with respect to gaze position.
Eye movement analysis
We filtered eye motion data with a fourth-order, low-pass, 50-Hz Butterworth filter. Fixation events, as calculated by EyeLink, as well as positional data throughout the trial, were collected in real time and were time-locked to digitizer data. We brought those data, along with stylus position data (x and y positions), into MATLAB and analyzed them on an individual-trial basis. EyeLink software default settings set the saccadic threshold to a velocity of 22°/s. That velocity allows for detection of saccades as small as 0.3° (with a sample rate of 250 ms or 4 ms/sample). We defined fixation as an event when the position of gaze was in the same location for more than two sample periods (8 ms). Less than 1% of recorded fixations were shorter than 100 ms. We calculated the following characteristics for each shape: (a) number of fixations across the trial and per cycle, (b) duration measures of fixations within a trial, (c) total trajectory length of eye movements across the trial and per cycle within each trial, and (d) distance traveled between fixations within each trial. We used those characteristics to determine whether there were any systematic relationships in frequency, duration, and distance measures of fixations across experimental manipulations. Duration measures of fixations did not show any systematic results and therefore are not reported.
Eye and arm movement analysis
We analyzed positions of eye fixations and stylus trajectory endpoints to determine whether fixations were related to any of the three types of characteristics distinguished in the introductory comments. For that purpose, we segmented shapes into spatially oriented bins. Shape coordinates were converted from Cartesian to polar coordinates, with the origin in the center of the figure and 0°/360° oriented in the rightward direction. Spatial locations of defined movement characteristics and fixations were also converted from Cartesian to polar coordinates. Each shape was segmented into 18 bins and presented in terms of 20° increments.2 That procedure equated to bins with a size of 20° for circles and ovals and to bins with a size of 1.4 cm for lines.
Distribution of fixations and defined movement characteristics
We used a one-sample t test to conduct an analysis for pattern of fixations for each shape in segmented bins. Our purpose in that analysis was to determine whether visual fixations were uniformly distributed across the shape. For the defined movement characteristics, there was a nonuniform distribution of occurrences across the trajectory. For simplicity of figures, those significant results are not presented. The only exception to that nonuniformity was the characteristic of maximum curvature for the circle, which was uniformly distributed and was therefore not used in subsequent analyses. We averaged the number of fixations per bin across trials for each condition for each participant. We then summed the total number of fixations per bin across participants. We then averaged the summed total of fixations per incremental bin across total bins and participants to determine the average number of fixations per bin if the distribution was uniform. We used that number as the test value in a one-sample t test. A t test, which we conducted across bins on the average number of fixations per bin per participant, determined which bins were significantly higher than the test value (p < .05).
Spatial overlap analysis
The number of occurrences of each defined movement characteristic was calculated for each bin (segmentation as just described). We calculated the percentage of events/bin/total events for each defined movement characteristic and for fixations to normalize data so that we could make comparisons across characteristics (i.e., there may be more total fixations than events of peak curvature). We determined the spatial overlap between fixations and each defined movement characteristic by taking the minimum percentage for each bin across defined movement characteristics and fixations. For simplicity, we operationally termed the resulting percentage overlap (Peak-LineCurve, PeakShlAmp, PeakElbAmp, MaxMTE, and MaxImpMTE). For example, if the 0°–20° increment (Bin 1) included 35% of fixations and if, for the MaxMTE, 24% of occurrences were in Bin 1, then we used 24% as the percentage of overlap between fixations and MaxMTE for that bin. Therefore, a significant overlap effect refers herein to a main effect of spatial overlap between fixations and the defined movement characteristic. That analysis was similar to an area of overlap analysis between spatial location of fixations and spatial location of defined movement characteristics. Occurrences of multiple defined movement characteristics could occur in the same bin, however, and therefore, for analysis, we allowed fixations to spatially overlap with more than one defined movement characteristic.
Temporal overlap analysis
We conducted a similar analysis for temporal characteristics or the times of occurrence of fixations and defined movement characteristics to determine whether the time of fixations was related to the time of occurrence of a defined movement characteristic. We determined the duration of a single cycle. Each cycle was normalized from 0 to 360 time units. We then determined the time of each event in that normalized time in 20-unit increments to maintain consistency with the spatial analysis. The time for fixations was the median time of the fixation period.3 We conducted the calculations of number of occurrences per bin for fixations and defined movement characteristics, as described in the spatial overlap analysis. For example, if the median time of a fixation occurred at 252 ms and one cycle was 1 s long (each bin was 55.6 ms in width), then that fixation would fall in Time Bin 5. If 20% of fixations occurred in Bin 5 (222–276 ms) and 35% of PeakLineCurve occurrences fell into Bin 5, then the temporal overlap was the minimum between those two quantities, 20%.
Time lag analysis
We conducted that analysis to obtain a rough estimate of the time lag between the eyes and the hand, but only for circles and ovals. The analysis was not conducted for lines because the direction of movement was not differentiated in the analysis. We determined the median time of a fixation and found the position of the stylus at that moment. We found the spatial locations of the fixation and the stylus endpoint in polar coordinates. We calculated the distance between the two in terms of angular distance in degrees and averaged that result across the trial. A positive angle meant the eyes led the hand. For example, if a fixation occurred at 100 ms into the movement, then the position of the stylus at 100 ms was found. The spatial location of the fixation was at 90°, and the spatial location of the stylus was at 0°, such that the resultant was +90°. That is, the eyes led the hand by one-fourth of the trajectory, or approximately 250 ms, when the cycle duration was 1 s. That measure is a rough estimation because the locations of fixations did not always occur on the trajectory, and therefore the distance from the fixation to the stylus may be misrepresented.
Statistical Analyses
We performed overall statistical analyses in SPSS Version 10 (SPSS Inc., Chicago, IL). We conducted a 7 (shape) × 1 (speed) repeated measures multivariate analysis of variance (MANOVA) to analyze kinematic (shoulder amplitude, elbow amplitude, and relative phase) and eye (duration and distance) measures. We performed a 7 (shape) × 5 (overlap) × 1 (speed) repeated measures ANOVA to analyze overlap spatially and temporally between fixations and defined movement characteristic data (PeakLineCurve, PeakShlAmp, PeakElbAmp, MaxMTE, and MaxImpMTE). We used the Greenhouse–Geisser corrected degrees of freedom when violations to sphericity occurred, and we report them with F values. Post hoc comparisons (Bonferroni adjusted, α = .05) were computed for relevant subsets of data (shape and overlap comparisons).
Results
Example trajectories for all shapes for two individual participants are depicted in Figure 2. The black line is the trajectory of the endpoint of the stylus, the gray line is the trajectory of the eyes, and the boxes represent fixation positions. We show data from 2 individuals to demonstrate individual differences but also to show that there were consistent characteristics across participants. Participants’ movements were performed at a comfortable speed and therefore should exemplify their patterns of oculomotor control during preferred movements. Averages and standard deviations of cycling frequencies for all shapes are given in Table 1. Preferred speed of participants averaged around 1.0 Hz in the prescribed task.
FIGURE 2.
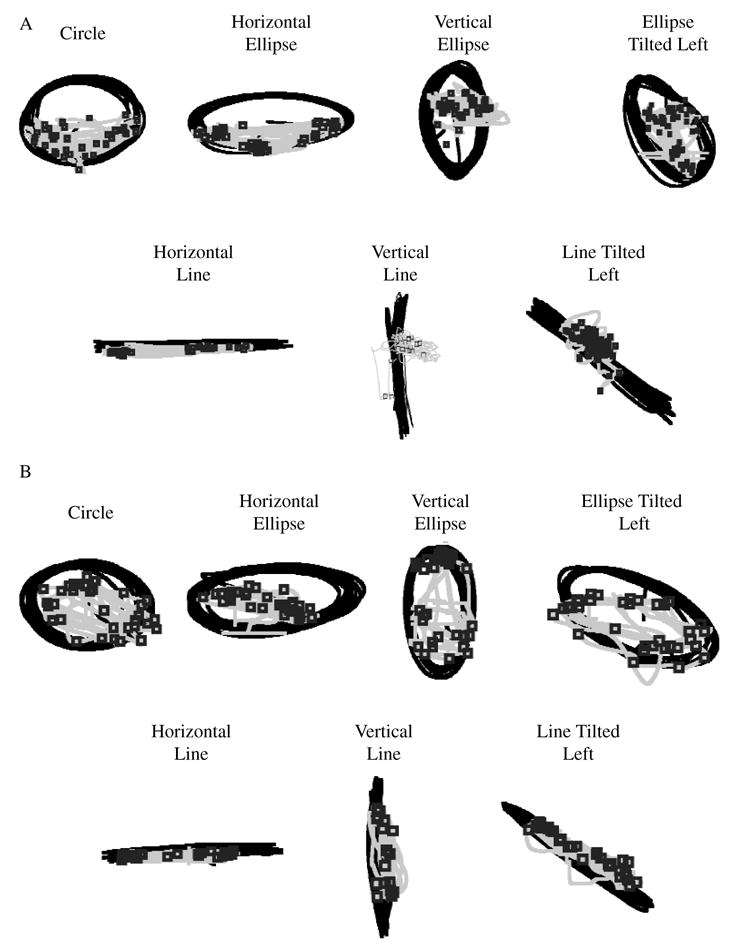
(A) Example trajectories for all shapes for an individual participant. (B) Example trajectories for all shapes for a second participant. Boxes are fixations, black line is hand trajectory, and gray line is eye trajectory.
TABLE 1.
Mean and Standard Deviation of Cycling Frequency (Hz) for All Shapes
| Measure | Circle | HL | VL | LL | HO | VO | LO |
|---|---|---|---|---|---|---|---|
| Mean | 1.05 | 1.00 | 1.13 | 1.05 | 1.02 | 1.00 | 0.99 |
| SD | 0.33 | 0.28 | 0.27 | 0.26 | 0.33 | 0.28 | 0.25 |
Note. HL = horizontal line; VL = vertical line; LL = line tilted left; HO = horizontal oval; VO = vertical oval; and LO = left-tilted oval.
Arm Movements
Arm kinematics changed across shapes. In Table 2, we report means and standard deviations for shoulder amplitude, elbow amplitude, and relative phase between them for all shapes. There was a significant multivariate main effect for shape for all kinematic variables, F(18, 270) = 85.64, p < .001. For shoulder amplitude, univariate tests revealed a significant main effect of shape, F(2.2, 33.2) = 32.67, p < .001, with the LL shapes having larger shoulder amplitudes than all other shapes. For elbow amplitude, univariate tests also revealed a significant main effect of shape, F(2.5, 36.9) = 130.13, p < .001, with variation of amplitude ranging from ~14° in the HL condition up to ~79° in the VL condition. Finally, univariate tests for relative phase also revealed a significant main effect of shape, F(2.5, 37.1) = 390.92, p < .001. To produce the required shapes, participants varied one or more of those parameters (Table 2).
TABLE 2.
Shoulder Amplitude, Elbow Amplitude, and Relative Phase Means and Standard Deviations (deg) for All Shapes
| Measure | Circle | HL | VL | LL | HO | VO | LO |
|---|---|---|---|---|---|---|---|
| Shoulder amplitude | |||||||
| Mean | 32.89° | 34.07° | 38.22º | 50.65º | 34.08° | 39.64° | 46.15° |
| SD | 3.70° | 6.20° | 9.20° | 6.70° | 2.80° | 7.10° | 3.70° |
|
| |||||||
| Elbow amplitude | |||||||
| Mean | 49.27° | 14.85° | 79.13° | 63.54° | 36.16° | 73.55° | 61.46° |
| SD | 6.70° | 5.53° | 17.40° | 14.30° | 3.50° | 12.0° | 7.10° |
|
| |||||||
| Relative phase | |||||||
| Mean | 143.79° | 181.28° | 179.39° | 179.28° | 132.71° | 158.61° | 159.07° |
| SD | 4.70° | 3.30° | 1.00° | 1.50° | 7.90° | 4.70° | 3.90° |
Note. HL = horizontal line; VL = vertical line; LL = line tilted left; HO = horizontal oval; VO = vertical oval; and LO = left-tilted oval.
Eye Movements
Total number of fixations per trial was not significantly different across shapes, p > .05. When the number of fixations per cycle was calculated, there was a significant main effect for shape, F(6, 102) = 2.39, p < .05; however, post hoc analyses revealed a significantly greater number of fixations only for the comparison between LO and VL, p < .05.
Total eye trajectory length was significantly different across shapes, F(3, 51.1) = 4.23, p < .01. Post hoc assessments revealed, however, that eye trajectory length was significantly smaller only for LO in comparison with VO and VL, p < .05. When eye trajectory length was measured per cycle, there was also a significant main effect for shape, F(6, 102) = 2.39, p < .05, with post hoc comparisons revealing only that LO was significantly smaller than VL, p < .05.
We measured distance traveled between fixations to determine whether the pattern of oculomotor control varied across shapes. There was a significant main effect for shape, F(3.2, 54.8) = 3.94, p < .05. Post hoc comparisons revealed differences between HL and LL, p < .05. VL and LL had the smallest distance traveled (~4.8 cm), whereas the HL and HO lines had the largest (~7.0 cm). There was a 1.5-fold increase in distance traveled for horizontal shapes compared with those for vertical and tilted shapes.
Eye and Arm Movements
The profile distributions for spatial location of events in polar coordinates segmented into 20° bins are shown for VL and HO in Figure 3A and B. Significantly higher numbers of fixations compared with the test value were found and are signified by an asterisk (*) in the figure. We conducted a t test for each bin across participants to determine whether there was a uniform distribution of fixations for each shape. For each shape, the distribution of fixations was not uniform. For the other characteristics, significant values are not depicted in the figure, but the peaks should be noted.
FIGURE 3.
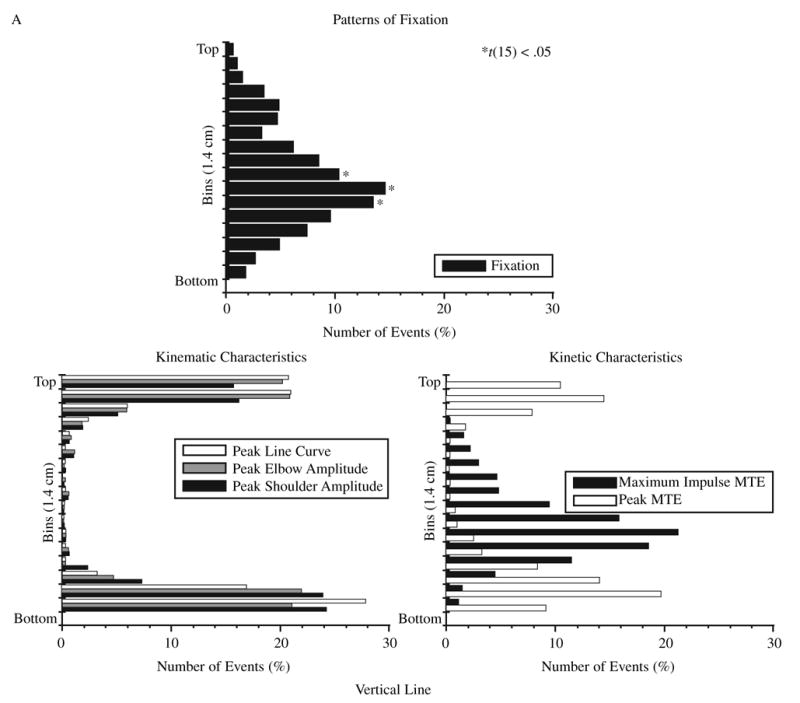
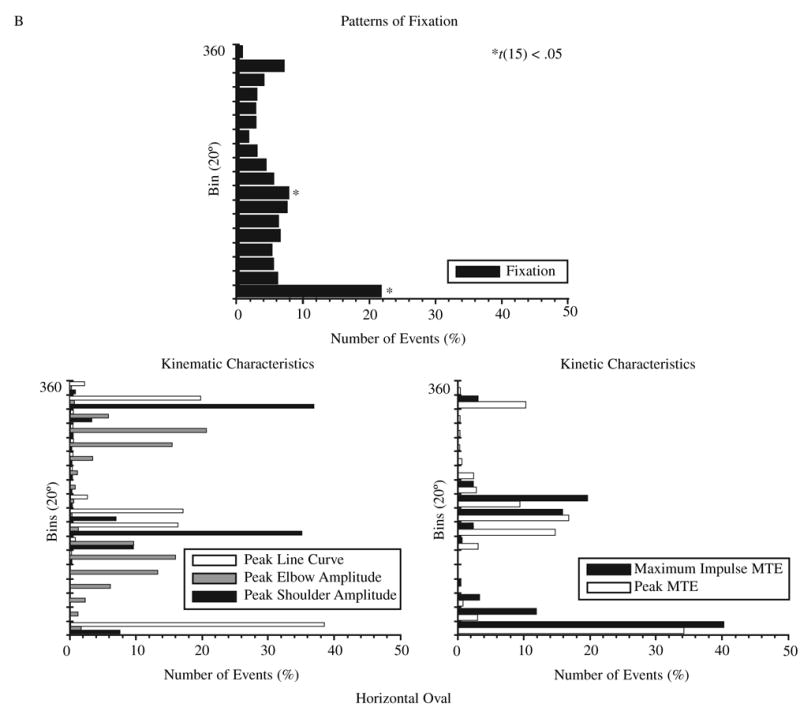
Profile of the distribution of the average number of events per bin for fixations and for each defined movement characteristic for two example shapes: (A) vertical line and (B) horizontal oval. *t(15), p < .05, only for fixations (higher values). Abbreviations: Peak Elbow Amplitude = maximum and minimum elbow excursion, Peak Line Curve = points of maximum curvature of the hand trajectory, Peak MTE = maximum and minimum elbow muscle torques, Maximum Impulse MTE = maximum impulse of elbow muscle torque.
We conducted several additional analyses to evaluate whether the patterns of visual fixations were related to the defined movement characteristics (operationally defined overlap variables PeakShlAmp, PeakElbAmp, PeakLineCurve, PeakMTE, and MaxImpMTE) either spatially or temporally, as discussed next.
Spatial Overlap Analysis
We analyzed the spatial overlap between occurrences of fixations and PeakShlAmp, PeakElbAmp, PeakLineCurve, PeakMTE, and areas where MTE contributed the most to NTE (MaxImpMTE). The magnitudes of overlap for all overlap variables with fixations for each shape can be seen in Figure 4. Fixations showed more overlap across overlap variables during certain shapes than in others; a significant main effect of shape was found, F(6, 90) = 18.19, p < .001. Post hoc analysis revealed that fixations during ovals had the greatest overlap with defined movement characteristics, followed by those during the circle and then the lines (overlaps were significantly greater in C, HO, VO, and LO than in HL, VL, and LL, p < .05). There was also a significant main effect for overlap, F(1.9, 28.5) = 28.86, p < .001. That finding means that the spatial locations of fixations were differentially related to the spatial locations of defined movement characteristics. Post hoc analyses revealed that overlap was highest for PeakMTE and MaxImpMTE, which did not significantly differ from each other, p > .05, but were significantly different from PeakLineCurve, PeakShlAmp, and PeakElbAmp, p < .05, for all shapes. Last, a significant Shape × Overlap interaction was also found, F(6.1, 91.2) = 9.78, p < .001, suggesting that each shape had a different pattern of overlap of fixations and defined movement characteristics. Therefore, we analyzed each shape across overlap variables with a repeated measures ANOVA. For all shapes, MTE overlap variables showed the highest overlap and were significantly different from the other overlap variables, p < .05. There were some differences in the orders of overlap in the other overlap variables across shape, but the MTE variables were always the highest (Figure 4).
FIGURE 4.
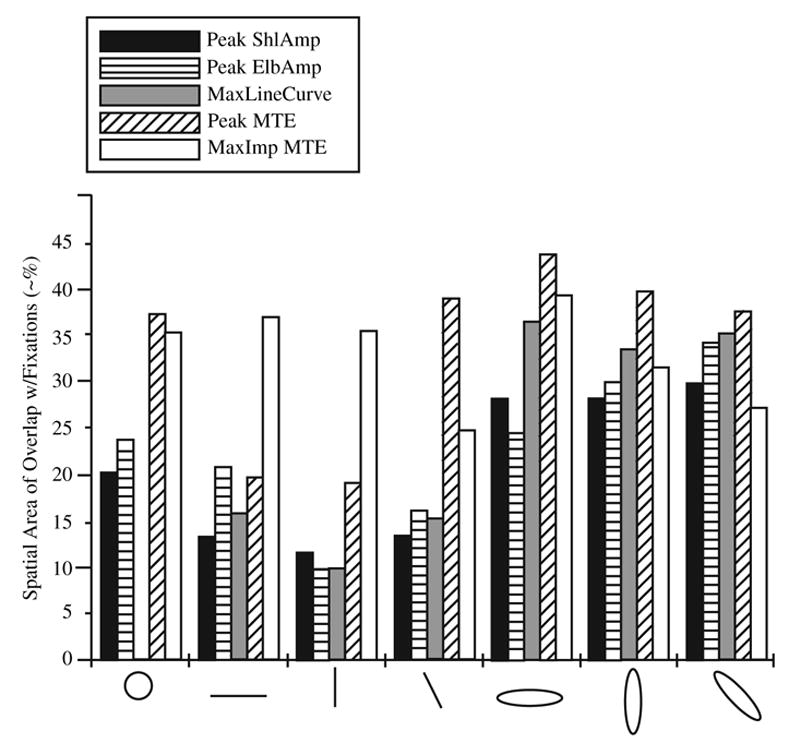
Spatial area of overlap between fixations and defined movement characteristics for each shape. Values do not have defined units, although they approximate percentage of overlap. Peak ShlAmp = maximum and minimum shoulder excursion. Peak ElbAmp = maximum and minimum elbow excursion. MaxLineCurve = maximum curvature of the hand trajectory. Peak MTE = minimum and maximum elbow muscle tongue. MaxImp MTE = maximum impulse of elbow muscle torque.
An additional analysis was conducted for lines. We analyzed fixations in relation to the template to determine whether participants looked at the endpoints of the template. There was an overall main effect for shape, F(1.4, 24.8) = 8.00, p < .005, with post hoc analyses revealing that the HL had more fixations to the endpoints than did the LL, p < .001. The average percentage of fixations was very low, however: HL = 6%, VL = 2%, and LL = 1%. Therefore, that difference was functionally rather insignificant. Participants looked at the endpoint of the template in only 6% of all fixations compared with numbers closer to 35% for MTE components.
Temporal Overlap Analysis
We did a similar analysis for the temporal overlap of fixations with defined movement characteristics. We analyzed the area of overlap between the times of fixations and the times of PeakShlAmp, PeakElbAmp, PeakLineCurve, PeakMTE, and also the areas where MTE contributed the most to NTE. The magnitudes of temporal overlap for defined movement characteristics with fixations for each shape (overlap variables) are shown in Figure 5. Fixations during certain shapes showed more overlap across overlap variables than others did; significant main effect of shape, F(6, 90) = 5.22, p < .001. Post hoc analysis revealed that C, HL, and HO had the highest overlaps. There was also a significant main effect for overlap, F(1.9, 28.5) = 83.73, p < .001. Post hoc analyses revealed that overlap was greatest for PeakLineCurve, followed by PeakMTE and Max-ImpMTE. Temporal overlap was lowest for PeakShlAmp and PeakElbAmp. PeakLineCurve had a significantly higher overlap than did all other overlap variables, p < .001, when collapsed across shapes. MTE measures (PeakMTE and MaxImpMTE) were significantly higher than PeakAmp measures, p < .001, but did not differ from each other, p > .05. Similarly, PeakAmp measures were not statistically different from each other, p > .05.
FIGURE 5.
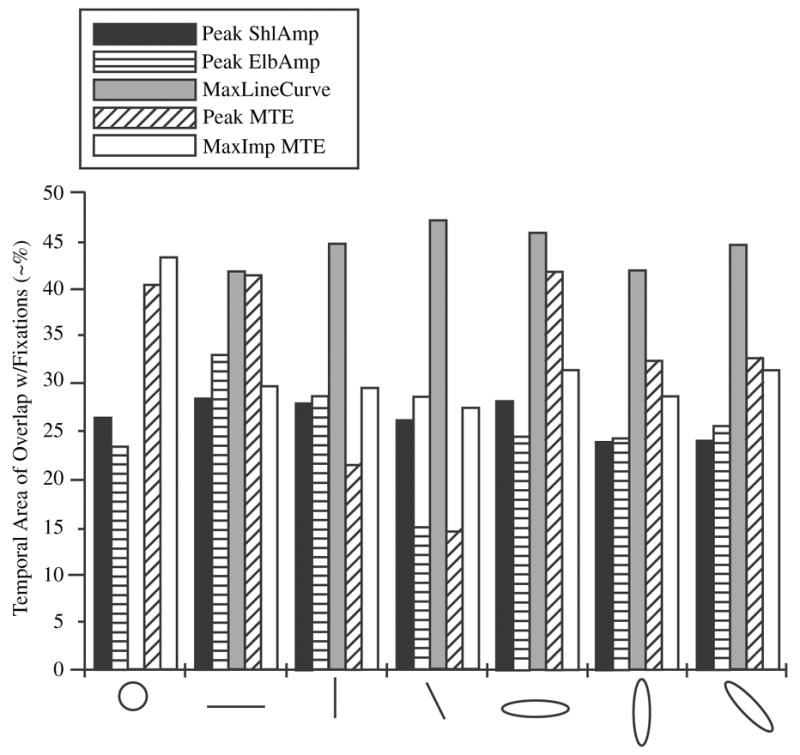
Temporal area of overlap between fixations and defined movement characteristics for each shape. Values do not have defined units, although they approximate the percentage of overlap. For abbreviations, see Figure 4.
In addition to main effects, there was a significant Shape × Overlap interaction, F(7.4, 110.4) = 16.02, p < .001, suggesting that each shape had a different pattern of overlap of fixations and defined movement characteristics. Therefore, we analyzed each shape across overlaps with a repeated measures ANOVA. Those analyses revealed that for all shapes except the circle, PeakLineCurve had a significantly higher overlap than did other overlap variables, p < .05. There were some slight differences in the order of overlaps for variables beyond PeakLineCurve, but, in general, the magnitude of temporal overlap between fixations and the other defined movement characteristics was not high. The only exception to that finding was the circle, which was characterized by the highest overlap with MTE events. For the circle, we did not analyze PeakLineCurve because the distribution was uniform across bin segments, t(15) sig. > .05. (The magnitudes of the temporal overlaps between fixations and defined movement characteristics for each shape are shown in Figure 5.)
Time Lag Analysis
We conducted an analysis of the time lag between the eyes and the stylus to determine whether the eyes led the hand, as has been reported previously (Johansson et al., 2001; Neggers & Bekkering, 1999, 2000, 2001; Vercher et al., 1997). Only a rough estimation of time lag could be obtained because the eyes did not move in a smooth pursuit fashion and participants were not told where to look (i.e., to target locations). Results showed that the main effect of shape was not significant for the circle and ovals, p > .05. The eyes led the hand by approximately 45° ± 6° (~125 ms) for all circle and oval conditions.
Discussion
We examined the pattern of oculomotor control during the drawing of various shapes at a preferred pace. The first finding was that across all shapes, the eye movements consisted of a series of fixations and did not follow a smooth pursuit pattern. The second finding was that the fixations were shape dependent. They were systematically distributed across each contour, with a specific pattern for each shape. In some shapes, the eyes gazed across the shape; in others, they focused on one area. We first assessed the pattern of visual fixations to document the differences across the shapes. The data on patterns of fixations measured by distance traveled between fixations showed that oculomotor control varied depending on the shape. The eyes moved around more in some shapes than in others, but the overall path length traveled by the eyes was similar across most of the shapes. The distance between fixations did vary across shapes, however; it was much lower for the VL and LL than for the HL and HO lines.
To identify factors defining the locations for the observed eye fixations, we examined three types of anchor points that could potentially attract the gaze, namely, characteristics of endpoint kinematics, joint motion, and joint kinetics. For endpoint kinematics, we identified points of highest curvature because they may provide the system with necessary information regarding the shape and size of the trajectory. For joint motion, we identified peak shoulder and elbow flexion and extension because timing and amplitude of joint reversals are important for accurate trajectory formation. Finally, for joint kinetics, we identified portions of the movement that the sensorimotor system had to actively control to produce the most detailed modulation of the influence of interactive torques at the subordinate joint, because that modulation has been shown to be important for accurate coordination. Distinguishing the type of anchor points that caused dominant attraction of the gaze was possible because the shapes included in the experiment resulted in differential modulation of the three types of anchor points. For instance, the points of highest curvature of the endpoint path and joint motion reversals coincided during the drawing of straight lines but were different during oval drawing. Also, joint control differed across the shapes because the shapes required different combinations of joint movements (amplitudes and relative phase between joint rotations). Next, we discuss the results of the analyses used for identification of the types of anchor points that caused eye fixations.
The analysis of spatial overlap between fixations and defined movement characteristics (PeakShlAmp, PeakElb-Amp, PeakLineCurve, PeakMTE, and MaxImpMTE) revealed that fixations were spatially related to specific control features of the movement. The overall percentage of overlap was the highest for the ovals (~40%), followed by the circle (~30%) and then the lines (~20%), when collapsed across overlap variables. Results showed that the highest spatial overlap of fixations with defined movement characteristics occurred for MTE measures (PeakMTE and MaxImpMTE) across all shapes. There was also an interaction of overlap and shape, however, suggesting that the pattern of oculomotor control and overlap with defined movement characteristics varied across the shapes. When each shape was analyzed separately, PeakMTE and Max-ImpMTE always showed the highest overlap; the order of overlap between other characteristics varied across shapes, with the magnitude of overlap being significantly lower than MTE events for all shapes. Most often, fixations spatially overlapped with events in which muscle control was the highest and had to compensate for the influence of IT.
Also of interest was the timing of visual fixations. We assessed the temporal overlap of the median time of fixations and the time of occurrence of defined movement characteristics to determine whether the timing of fixations was systematically related to the timing of movement characteristics. Temporal measures of overlap of defined movement characteristics and fixations showed overall tendency to occur at the time of the highest trajectory curvature. The highest curvature was also related to the time when movement velocity was the lowest, in accordance with the two-thirds power law (Lacquaniti et al., 1982; Viviani & Terzuolo, 1982). Therefore, it is probable that the timing of fixations occurred when movement velocity was low so that there was more relative time to gather and integrate visual information. Where the gaze was directed is of interest with respect to what information is gathered, however. We found that the information gathered related to modulation of IT with MT.
In addition, we conducted a time lag analysis between the hand endpoint and visual fixations. The eyes did not move in a smooth pursuit fashion; therefore, the eyes and hand did not always cross the same location in each cycle. Nevertheless, the data demonstrated that the eyes led the hand by approximately one-eighth of a cycle for circles and ovals (~125 ms), which is consistent with previous reports on manuoocular tracking (Bahill & McDonald, 1983a, 1983b; Barnes & Rubbock, 1989; Vercher et al., 1997; Yasui & Young, 1984) and on discrete aiming tasks (Johansson et al., 2001; Neggers & Bekkering, 1999, 2000, 2001). In those studies, participants used visual information in a feed-forward manner to plan and organize the movement. In many of the aforementioned tasks, participants were instructed to use their eyes as an effector. In the present experiment, participants were not instructed with respect to eye movements, and a similar finding was still observed. That result suggests that the sensorimotor system uses vision to gather information ahead of the moving limb; the information is then integrated and processed as feedforward information and used in the execution of the ongoing movement. Thus, vision is providing predictive control to the system so that it can maintain accuracy.
In a large portion of research, vision has been highlighted as a feedback system. According to that literature, the visuomotor system uses visual information to evaluate the disparity between the intended movement and the performed movements. If a movement is inaccurate, the system can use visual feedback to correct the ongoing movement (Ketcham, Seidler, van Gemmert, & Stelmach, 2002; Meyer, Abrams, Kornblum, Wright, & Smith, 1988; Seidler-Dobrin & Stelmach, 1998; Walker, Philbin, & Fisk, 1997; Woodworth, 1899). The system can also use feedback to update the organization of a ballistic movement so that the subsequent attempt will be more accurate (Adams, 1971; Fitts & Posner, 1967; Gentile, 1972; R. A. Schmidt, 1975, 1988). The focus in much of the cited research was on how individuals learn a skill in which feedback and knowledge of results play a huge role in improving skill performance.
In other studies, investigators manipulated visual feedback so that participants were unaware whether they would receive visual feedback in the upcoming movement (Elliott & Allard, 1985; Zelaznik, Hawkins, & Kisselburgh, 1983). They found that when participants knew that vision would be available, movements were quicker and more accurate. The authors attributed that finding to the availability of visual feedback.
Although in the aforementioned studies, researchers have elaborated on the feedback use of visual information, the results reported in a more recent body of literature have shown that vision is also used in a feedforward manner and is particularly related to the dynamics (kinetics, mechanical properties, or both) of the moving limb (Ariff, Donchin, Nanayakkara, & Shadmehr, 2002; Ghez, Gordon, & Ghilardi, 1995; Ketcham et al., 2004a, 2004b; Sainburg, Ghilardi, Poizner, & Ghez, 1995). Ariff et al. demonstrated that saccades are an unbiased real-time estimator of limb position when the kinetics of the limb is predictable. In their experiment, the participants’ limb was covered, and they were asked to look where they thought their limb was as they pointed to a target. A force field was applied to their limb so that the dynamics of the limb was perturbed, but the force was detectable only via proprioceptive sensors because vision of the limb was occluded. Participants were able to accurately predict the location of their limb in normal movements but were unable to do so when the force field was turned on; therefore, movement was elicited within a novel environment. Those findings, in combination with the present study results, suggest that the eyes move in prediction of intersegmental dynamics of the moving limb and that one of the functions of vision is to provide feedforward information about upcoming requirements for regulation of interactive torque.
In the present research, we have demonstrated that although different factors may influence visual gaze, the most consistent locations of fixations are related to the location of the hand trajectory where muscle control at the elbow is the most demanding. In addition, we have shown that those fixations occur at the time when curvature of the movement is the highest and, therefore, velocity of the movement is the lowest. Thus, it follows that visual fixations are directed toward locations of the movement where joint control has to be the most detailed and that those fixations occur ahead of the hand and at times when the velocity of the movement is the slowest. Those findings tentatively support the leading joint hypothesis (Dounskaia, 2005; Dounskaia et al., 2002a; Dounskaia, Swinnen, et al. 2000; Dounskaia et al., 1998). The present data, in combination with previous work (Dounskaia et al., 2002b; Ketcham et al., 2000; Ketcham et al., 2004a, 2004b), suggest that visual fixations are related to the detailed modulation of interactive torques at the elbow and may be related to the gathering of information about upcoming control, which must be integrated and executed by the sensorimotor system in a feedforward manner. In those studies, the removal of vision resulted in distortions of trajectory shape. A detailed analysis of torque profiles revealed that the fine modulation of elbow control was lost when vision was occluded at high movement speeds.
It should be noted that although fixations showed the largest spatial overlap with MTE events (~40%) and the largest temporal overlap with PeakLineCurve (~45%), those findings do not account for the total percentage of fixations. The pattern revealed is the prominent pattern and represents a significant portion of fixations, but by no means the only locations where the eyes were fixating. The circle, for example, showed the highest overlap with MTE events both spatially and temporally, with overlap around 40%. Moreover, we took the temporal measures for fixations from the median time of each fixation. Therefore, the time of a MTE event may occur within that period, depending on the length of the fixation, even though the eyes do lead the hand spatially. Further study is necessary so that investigators can tease out exactly what information is being gathered dynamically throughout the movement by controlling what information is available to participants. In addition, there is the possibility that peripheral vision plays a role, and, therefore, investigations related to the manipulation of shape size are necessary. However, the present research is the first step in answering questions regarding the role of vision in the control of continuous multijoint movements.
Acknowledgments
National Institutes of Health grants NINDS-NS 43502, NINDS-NS 39352, and NIA-AG 14676 awarded to G. E. Stelmach supported this research. We would like to acknowledge Srikanth Manian, Ashish Shah, Kaushik Bhatt, and Pulkit Sangani for their extensive help with data analysis. Portions of these data were presented at the 2003 Society for Neuroscience Conference, New Orleans, LA. This work is part of Caroline J. Ketcham’s doctoral dissertation.
APPENDIX
Joint angles were determined as follows (see Figure A1):
We collected two reference points before and at the end of the experiments. The reference points were at an equal distance from the shoulder (Ls). The shoulder coordinates (xs, ys) were found as the coordinates at the point where two circles (of Ls diameter) intersected; we assumed that the shoulder coordinates were constant.
Using the shoulder coordinates (xs, ys), endpoint coordinates (xend, yend), and the upper (Lu) and lower (Ll) arm lengths, we calculated elbow coordinates (xe, ye) at each moment of time as the right intersection of two circles, one centered at xend, yend with a radius of Ll and the other centered at xs, ys with a radius of Lu.
We computed the elbow angle (α) by using endpoint, elbow, and shoulder coordinates (xend, yend), (xe, ye), and (xs, ys), respectively.
We computed the shoulder angle (α) as the angle of the upper arm with respect to the x-axis set by the experimental setup. Namely, we computed the shoulder angle by using the elbow and shoulder coordinates, (xe, ye) and (xs, ys), respectively, and (0, ys).
FIGURE A1.
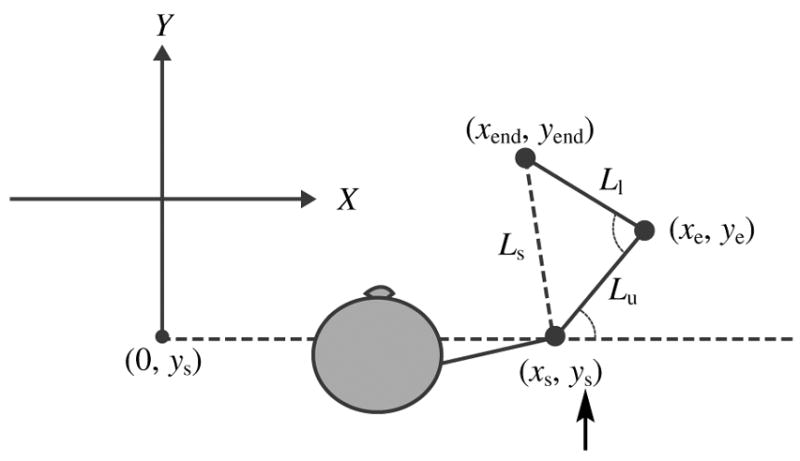
Schematic of how joint angles were determined.
Footnotes
Two participants went through additional testing without the eye-tracking system, but with Optotrak (Northern Digital, Waterloo, Ontario, Canada), so that we could measure shoulder movements (the two systems had substantial cross-talk when on at the same time). Translation of the trunk was less than ±0.1 cm and translation of the shoulder was less than ±0.5 cm for both participants at a comfortable pace. The translation was minor and can be accounted for by marker placement and movement of the skin. Therefore, we assumed the shoulder coordinates were stable for all kinetic analyses and joint angles interpolated from endpoint data. Furthermore, we set up our analysis software for all participants such that an error would occur if the calculated distance from shoulder to endpoint was greater than 1 cm of the measured arm length (suggesting that the trunk translated forward to reach distance, not that the arm grew a centimeter) and the trial was not included in the analysis. Two participants showed those errors at high movement speeds (not reported), and therefore those participants were not analyzed for any kinematic or kinetic data related to joint angles. We used their endpoint and fixation data in the appropriate analyses.
We determined those increments of 20° segmentation because we tested 3 additional participants in a control experiment in which they put their stylus on the digitizing tablet and looked at the exact location of the endpoint depicted on the screen. Discrepancies between eye position and hand position were evaluated and were of a range of ±1 cm, even with excellent calibrations. That value is within the specified spatial accuracy of 1.0° for the Eye-Link system. Therefore, 20° increments allowed for such spatial deviations, although they still were representative of the spatial location of the stylus endpoint and visual gaze.
We conducted additional analyses on start and end times of fixations, but those analyses did not result in any significantly different findings and are not reported.
References
- Adams JA. A closed-loop theory of motor learning. Journal of Motor Behavior. 1971;3:111–150. doi: 10.1080/00222895.1971.10734898. [DOI] [PubMed] [Google Scholar]
- Angel RW, Alston W, Garland H. Functional relations between the manual and oculomotor control systems. Experimental Neurology. 1970;27:248–257. doi: 10.1016/0014-4886(70)90218-9. [DOI] [PubMed] [Google Scholar]
- Ariff G, Donchin O, Nanayakkara T, Shadmehr R. A real-time state predictor in motor control: Study of saccadic eye movements during unseen reaching movements. The Journal of Neuroscience. 2002;22:7721–7729. doi: 10.1523/JNEUROSCI.22-17-07721.2002. [DOI] [PMC free article] [PubMed] [Google Scholar]
- Bahill AT, McDonald JD. Model emulates human smooth pursuit system producing zero-latency target tracking. Biological Cybernetics. 1983a;48:213–222. doi: 10.1007/BF00318089. [DOI] [PubMed] [Google Scholar]
- Bahill AT, McDonald JD. Smooth pursuit eye movements in response to predictable target motions. Vision Research. 1983b;23:1573–1583. doi: 10.1016/0042-6989(83)90171-2. [DOI] [PubMed] [Google Scholar]
- Barnes GR, Rubbock CJS. Factors affecting the predictability of pseudo-random motion stimuli in the pursuit reflex of man. Journal of Physiology. 1989;408:137–165. doi: 10.1113/jphysiol.1989.sp017452. [DOI] [PMC free article] [PubMed] [Google Scholar]
- Biguer B, Jeannerod M, Prablanc C. The coordination of eye, head and arm movements during reaching at a single visual target. Experimental Brain Research. 1982;46:301–304. doi: 10.1007/BF00237188. [DOI] [PubMed] [Google Scholar]
- Chaffin DB, Anderson GBJ. Occupational biomechanics. New York: Wiley; 1984. [Google Scholar]
- De Jong WP, Hulstijn W, Kosterman BJM, Smits-Engelsman BCM. OASIS software and its application in experimental handwriting research. In: Simner ML, Leedham CG, Thomassen AJWM, editors. Handwriting and drawing research: Basic and applied issues. Amsterdam, The Netherlands; IOS: 1996. [Google Scholar]
- de’Sperati C, Viviani P. The relationship between curvature and velocity in two-dimensional smooth pursuit eye movements. The Journal of Neuroscience. 1997;17:3932–3945. doi: 10.1523/JNEUROSCI.17-10-03932.1997. [DOI] [PMC free article] [PubMed] [Google Scholar]
- Dounskaia N. The internal model and the leading joint hypothesis: Implications for control of multi-joint movements. Experimental Brain Research. 2005;166(1):1–16. doi: 10.1007/s00221-005-2339-1. [DOI] [PubMed] [Google Scholar]
- Dounskaia N, Ketcham CJ, Leis B, Stelmach GE. Disruptions in joint control during drawing arm movements in Parkinson’s disease. Experimental Brain Research. 2005;164:311–322. doi: 10.1007/s00221-005-2251-8. [DOI] [PubMed] [Google Scholar]
- Dounskaia N, Ketcham CJ, Stelmach GE. Commonalities and differences in control of a large set of drawing movements. Experimental Brain Research. 2002a;146:11–25. doi: 10.1007/s00221-002-1144-3. [DOI] [PubMed] [Google Scholar]
- Dounskaia N, Ketcham CJ, Stelmach GE. Influence of biomechanical constraints on horizontal arm movements. Motor Control. 2002b;6:368–389. doi: 10.1123/mcj.6.4.366. [DOI] [PubMed] [Google Scholar]
- Dounskaia N, Stelmach GE. Movement planning and movement execution: What is in between? Behavioral Brain Sciences. 2001;24:41–42. [Google Scholar]
- Dounskaia N, Swinnen SP, Walter CB. A principle of control of rapid multijoint movements: The leading joint hypothesis. In: Winter JM, Crago PE, editors. Biomechanics and neural control of posture and movement. New York: Springer; 2000. pp. 390–404. [Google Scholar]
- Dounskaia N, Swinnen SP, Walter CB, Spaepen AJ, Verschueren SMP. Hierarchical control of different elbow-wrist coordination patterns. Experimental Brain Research. 1998;121:239–254. doi: 10.1007/s002210050457. [DOI] [PubMed] [Google Scholar]
- Dounskaia N, Van Gemmert AWA, Stelmach GE. Interjoint coordination during handwriting-like movements. Experimental Brain Research. 2000;135:127–140. doi: 10.1007/s002210000495. [DOI] [PubMed] [Google Scholar]
- Elliott D, Allard F. The utilization of visual feedback information during rapid pointing movements. The Quarterly Journal of Experimental Psychology. 1985;37A:407–425. doi: 10.1080/14640748508400942. [DOI] [PubMed] [Google Scholar]
- Fitts PM, Posner MI. Human performance. Belmont, CA: Brooks/Cole; 1967. [Google Scholar]
- Galloway JC, Koshland GF. General coordination of shoulder, elbow and wrist dynamics during multijoint arm movements. Experimental Brain Research. 2002;142:163–180. doi: 10.1007/s002210100882. [DOI] [PubMed] [Google Scholar]
- Gentile AM. A working model of skill acquisition with application to teaching. Quest. 1972;17:3–23. [Google Scholar]
- Ghez C, Gordon J, Ghilardi MF. Impairments of reaching movements in patients without proprioception II. Effects of visual information on accuracy. Journal of Neurophysiology. 1995;73:361–372. doi: 10.1152/jn.1995.73.1.361. [DOI] [PubMed] [Google Scholar]
- Gribble PL, Ostry DJ. Compensation for interaction torques during single and multijoint limb movement. Journal of Neurophysiology. 1999;82:2310–2326. doi: 10.1152/jn.1999.82.5.2310. [DOI] [PubMed] [Google Scholar]
- Hollerbach MJ, Flash T. Dynamic interactions between limb segments during planar arm movement. Biological Cybernetics. 1982;44:67–77. doi: 10.1007/BF00353957. [DOI] [PubMed] [Google Scholar]
- Johansson RS, Westling G, Backstrom A, Flanagan JR. Eye-hand coordination in object manipulation. Journal of Neuroscience. 2001;21:6917–6932. doi: 10.1523/JNEUROSCI.21-17-06917.2001. [DOI] [PMC free article] [PubMed] [Google Scholar]
- Ketcham CJ, Dounskaia NV, Seidler RD, Stelmach GE. Multijoint control is compromised in Parkinson’s disease patients. Journal of Human Kinetics. 2000;4(Suppl):85–95. Suppl. [Google Scholar]
- Ketcham CJ, Dounskaia NV, Stelmach GE. Age-related differences in the control of multijoint movements. Motor Control. 2004a;8:422–436. doi: 10.1123/mcj.8.4.422. [DOI] [PubMed] [Google Scholar]
- Ketcham CJ, Dounskaia NV, Stelmach GE. Multijoint movement control: The influence of interactive torques. In: Mori S, Stuart D, Weisendanger M, editors. Brain mechanisms for the integration of posture and movement: Progress in brain research. Vol. 143. London: Elsevier; 2004b. pp. 207–218. [DOI] [PubMed] [Google Scholar]
- Ketcham CJ, Seidler RD, Van Gemmert AWA, Stelmach GE. Age-related kinematic differences as influenced by task difficulty, target-size, and movement amplitude. Journal of Gerontology: Psychological Sciences and Social Sciences. 2002;57B:P54–P64. doi: 10.1093/geronb/57.1.p54. [DOI] [PubMed] [Google Scholar]
- Krakauer JW, Ghilardi MF, Ghez C. Independent learning of internal models for kinematic and dynamic control of reaching. Nature Neuroscience. 1999;2:1026–1031. doi: 10.1038/14826. [DOI] [PubMed] [Google Scholar]
- Krakauer JW, Pine ZM, Ghilardi MF, Ghez C. Learning of visuomotor transformations for vectorial planning of reaching trajectories. The Journal of Neuroscience. 2000;20:8916–8924. doi: 10.1523/JNEUROSCI.20-23-08916.2000. [DOI] [PMC free article] [PubMed] [Google Scholar]
- Lacquaniti F, Terzuolo C, Viviani P. The law relating the kinematics and figural aspects of drawing movements. Acta Psychologica. 1982;54:115–130. doi: 10.1016/0001-6918(83)90027-6. [DOI] [PubMed] [Google Scholar]
- Land M, Mennie N, Rusted J. The roles of vision and eye movements in the control of activities of daily living. Perception. 1999;28:1311–1328. doi: 10.1068/p2935. [DOI] [PubMed] [Google Scholar]
- Land MF. Predictable eye-head coordination during driving. Nature. 1992;359:318–320. doi: 10.1038/359318a0. [DOI] [PubMed] [Google Scholar]
- Land MF, McLeod P. From eye movements to actions: How batsmen hit the ball. Nature Neuroscience. 2000;3:1340–1345. doi: 10.1038/81887. [DOI] [PubMed] [Google Scholar]
- Levin O, Ouamer M, Steyvers M, Swinnen SP. Directional tuning effects during cyclical two-joint arm movements in the horizontal plane. Experimental Brain Research. 2001;141:471–484. doi: 10.1007/s002210100874. [DOI] [PubMed] [Google Scholar]
- Mardia KV. Statistics of directional data. London: Academic Press; 1972. [Google Scholar]
- Meyer DE, Abrams RA, Kornblum S, Wright CE, Smith JEK. Optimality in human motor performance: Ideal control of rapid aimed movements. Psychological Review. 1988;95:340–370. doi: 10.1037/0033-295x.95.3.340. [DOI] [PubMed] [Google Scholar]
- Nakano E, Imamizu H, Osu R, Uno Y, Gomi H, Yoshioka T, et al. Quantitative examinations of internal representations for arm trajectory planning: Minimum commanded torque change model. Journal of Neurophysiology. 1999;81:2140–2155. doi: 10.1152/jn.1999.81.5.2140. [DOI] [PubMed] [Google Scholar]
- Neggers SFW, Bekkering H. Integration of visual and somatosensory target information in goal-directed eye and arm movements. Experimental Brain Research. 1999;125:97–107. doi: 10.1007/s002210050663. [DOI] [PubMed] [Google Scholar]
- Neggers SFW, Bekkering H. Ocular gaze is anchored to the target of an ongoing pointing movement. Journal of Neurophysiology. 2000;83:639–651. doi: 10.1152/jn.2000.83.2.639. [DOI] [PubMed] [Google Scholar]
- Neggers SFW, Bekkering H. Gaze anchoring to a pointing target is present during the entire pointing movement and is driven by a non-visual signal. Journal of Neurophysiology. 2001;86:961–970. doi: 10.1152/jn.2001.86.2.961. [DOI] [PubMed] [Google Scholar]
- Neggers SFW, Bekkering H. Coordinated control of eye and hand movements in dynamic reaching conditions. Human Movement Science. 2002;21:349–376. doi: 10.1016/s0167-9457(02)00120-3. [DOI] [PubMed] [Google Scholar]
- Pelisson D, Prablanc C, Goodale MA, Jeannerod M. Visual control of reaching movements without vision of the limb: Evidence of fast unconscious processes correcting the trajectory of the hand to the final position of a double-step stimulus. Experimental Brain Research. 1986;62:303–311. doi: 10.1007/BF00238849. [DOI] [PubMed] [Google Scholar]
- Prablanc C, Echallier JF, Komilis E, Jeannerod M. Optimal response of eye and hand motor systems in pointing at a visual target. I. Spatio-temporal characteristics of eye and hand movements and their relationships when varying the amount of visual information. Biological Cybernetics. 1979;35:113–124. doi: 10.1007/BF00337436. [DOI] [PubMed] [Google Scholar]
- Reina GA, Schwartz AB. Eye-hand coupling during closed-loop drawing: Evidence of shared motor planning? Human Movement Science. 2003;2:137–152. doi: 10.1016/s0167-9457(02)00156-2. [DOI] [PubMed] [Google Scholar]
- Sainburg RL, Ghilardi MF, Poizner H, Ghez C. Control of limb dynamics in normal subjects and patients without proprioception. Journal of Neurophysiology. 1995;73:820–835. doi: 10.1152/jn.1995.73.2.820. [DOI] [PMC free article] [PubMed] [Google Scholar]
- Schmidt RA. A schema theory of discrete motor skill learning. Psychological Review. 1975;82:225–260. [Google Scholar]
- Schmidt RA. Motor control and learning: A behavioral emphasis. 2. Champaign, IL: Human Kinetics; 1988. [Google Scholar]
- Schmidt RC, Treffner PJ, Shaw BK, Turvey MT. Dynamical aspects of learning an interlimb rhythmic movement pattern. Journal of Motor Behavior. 1992;24:67–84. doi: 10.1080/00222895.1992.9941602. [DOI] [PubMed] [Google Scholar]
- Seidler-Dobrin RD, Stelmach GE. Persistence in visual feedback control by the elderly. Experimental Brain Research. 1998;119:467–474. doi: 10.1007/s002210050362. [DOI] [PubMed] [Google Scholar]
- Vercher JL, Lazzari S, Gauthier G. Manuoocular coordination in target tracking. II. Comparing the model with human behavior. Biological Cybernetics. 1997;77:267–275. doi: 10.1007/s004220050387. [DOI] [PubMed] [Google Scholar]
- Viviani P, Flash T. Minimum-jerk, two-thirds power law, and isochrony: Converging approaches to movement planning. Journal of Experimental Psychology. 1995;21:32–53. doi: 10.1037//0096-1523.21.1.32. [DOI] [PubMed] [Google Scholar]
- Viviani P, Terzuolo C. Trajectory determines movement dynamics. Neuroscience. 1982;7:431–437. doi: 10.1016/0306-4522(82)90277-9. [DOI] [PubMed] [Google Scholar]
- Walker N, Philbin DA, Fisk AD. Age-related differences in movement control: Adjusting submovement structure to optimize performance. Journal of Gerontology: Psychological Sciences. 1997;52B:P40–P52. doi: 10.1093/geronb/52b.1.p40. [DOI] [PubMed] [Google Scholar]
- Woodworth RS. The accuracy of voluntary movement. Psychological Review Monographs. 1899;63 Whole No. 302. [Google Scholar]
- Yasui S, Young LR. On the predictive control of foveal eye tracking and slow phases of optokinetic and vestibular nystagmus. Journal of Physiology. 1984;347:17–33. doi: 10.1113/jphysiol.1984.sp015050. [DOI] [PMC free article] [PubMed] [Google Scholar]
- Zelaznik HN, Hawkins B, Kisselburgh L. Rapid visual feedback procession in single-aiming movements. Journal of Motor Behavior. 1983;15:217–236. doi: 10.1080/00222895.1983.10735298. [DOI] [PubMed] [Google Scholar]