Abstract
Parallel, spatial-encoded MRI requires a large number of independent detectors that simultaneously acquire signals. The loop structure and mutual coupling in conventional phased arrays limit the number of coils and therefore the potential reduction in minimum scan time achievable by parallel MRI tchniques. A new near-field MRI detector array, the planar strip array (PSA), is presented that eliminates the coupling problems and can be extended to a very large number of detectors and high MRI frequencies. Its basic structure is an array of parallel microstrips with a high permittivity substrate and overlay. The electromagnetic (EM) wavelength can be adjusted with the permittivity, and the strip lengths tuned to a preselected fraction of the wavelength of the MRI frequency. EM wave analysis and measurements on a prototype four-element PSA reveal that the coupling between the strips vanishes when the strip length is either an integer times a quarter wavelength for a standing-wave PSA, or a half wavelength for a travelling-wave PSA, independent of the spacing between the strips. The analysis, as well as phantom and human MRI experiments performed by conventional and parallel-encoded MRI with the PSA at 1.5 T, show that the decoupled strips produce a relatively high-quality factor and signal-to-noise ratio, provided that the strips are properly terminated, tuned, and matched or coupled to the preamplifiers.
Keywords: MRI detector, phased array, planar strip array (PSA), sensitivity encoding, SMASH, SENSE, ASP, standing wave detector, surface coil
Parallel spatial-encoding techniques, such as the simultaneous acquisition of the spatial harmonics method (SMASH (1)), sensitivity encoding (SENSE (2)), and the analytical SMASH procedure (ASP (3)) are practical methods for dramatically reducing the minimum MRI scan time by replacing phase-encoding steps with the encoding inherent in the sensitivity profiles of a set of phased-array detection coils. Conceivably, if pushed to the extreme, these methods could completely replace the MRI phase-encoding gradients, reducing the minimum acquisition time to a single free-induction decay. Accomplishing this would require at least a very large array of detectors, ultimately with sensitivity profiles that match the image resolution in the phase-encoding direction. However, conventional MRI phased-array coil design limits the number of coils in a phased array, mainly due to the practical difficulties associated with the loop structure of the coil elements and the difficulty in decoupling them (4).
The loop surface coils that serve as detector elements in MRI phased-arrays (4–8) currently have higher-quality factors (Q) and lower electric field losses than dipole-type antennas (9). Although linear elements, such as conducting strips combined with lumped reactances, are often integrated into single-channel detectors, such as ladder surface (10) and birdcage coils (11–13), they are not used as independent detectors in multicoil arrays. In high-field MRI scanners, linear elements— including transmission lines (14,15) and slotted tubes (16,17)—take direct advantage of the wave characteristics of the electromagnetic (EM) field for radiofrequency (RF) detection, but, again, they are not used as independent detector elements in multidetector arrays.
Here we introduce a new type of phased-array detector, the planar strip array (PSA). Its structure is an array of parallel commensurate-length microstrips with a layer of high relative permittivity (∊r) material overlay on top. The microstrip substrate can have the same permittivity as the overlay. These materials reduce the EMF wavelength by a factor of , in order to make a quarter wavelength (λ/4) resonator (or a resonator at an integral multiple of λ/4) at the MRI frequency correspond to a reasonable length for a clinical MRI detector. Under these conditions, the behavior of the PSA can be evaluated with the EM wave equation. The properties of wave propagation are used both for decoupling the elements and enhancing the signal-to-noise ratio (SNR). We identified several types of PSA that utilize different mechanisms for narrow-band decoupling, and we provide criteria for broadband decoupling and enhancing the Q.
The PSA has several advantages over conventional loop design. First, the length of the strips in the PSA can be adjusted such that the coupling between the strips vanishes, and the strips are decoupled regardless of spacing. Second, with an appropriate termination, a standing wave resonance occurs and provides high SNR on the isolated strips, analogous to the tuning of loop elements for resonance. Third, the electrical field is concentrated between the strips and a ground plane, so that the loss associated with the electrical field is minimized. Fourth, theoretical analysis demonstrates that the PSA structure is capable of accommodating a large number of detectors for simultaneously acquiring near-field MRI signals without interference from each other. Fifth, the PSA is readily adaptable for high-field MRI by adjusting geometric length and/or the dielectric substrate and overlay, enabling high-frequency MRI phased-arrays, which are largely unavailable today. We demonstrate the principle of the PSA with two experimental prototypes implemented on a clinical 1.5 T MRI scanner with a standard four-channel array capability.
STRUCTURE ANALYSIS
Comparison of Linear and Loop MRI Detectors
Current parallel spatial-encoded MRI methods, such as SMASH or ASP, require that the sensitivity of each coil element of the phased array is highly localized along at least one direction. To achieve the maximum decimation of the scan-time via parallel acquisition, a large number of coil elements are required, with coil dimensions decreased accordingly. As the width of conventional loop coils (Fig. 1a) is reduced, the opposite polarity of the signals induced in opposite sides of the loop in essence reduces the sensitivity of the coils for depths beyond about one coil width. This structural disadvantage of loop geometry can be overcome by using a linear detector element for the phased array. We compare the signals detected in a loop coil of length l with those of a strip conductor of the same length, as illustrated in Fig. 1.
FIG. 1.
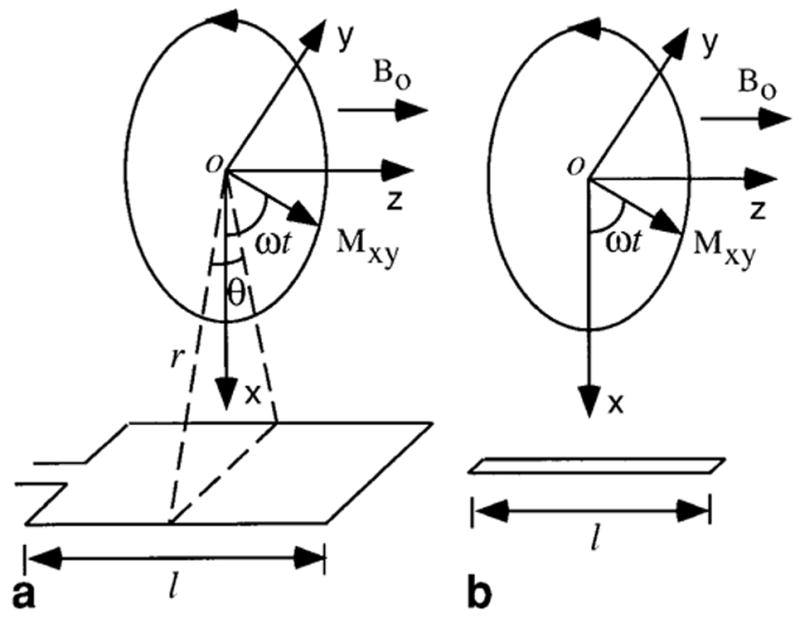
MRI signal detection by (a) loop and (b) linear antennas. Here z is the longitudinal direction that is parallel to the static magnetic field B0. The x-y plane is the transverse plane in which the transverse magnetization Mxy(r), originated at point O, rotates with frequency ω to generate a time-varying magnetic field B. In part a a loop antenna is used to detect B. The angle θ is the view angle from the point O. This angle provides the measure of how close the two sides of the loop are. In part b a linear antenna is used to detect B. The distance between point O and the linear antenna is r.
Ignoring relaxation effects, the voltage induced in a loop detector by the detectable transverse nuclear magnetization Mxy(r) rotating with angular frequency ω at a point source located a distance r from the side of the loop can be calculated by:
| [1] |
where B = μMxy(r) is the magnetic field due to Mxy(r), μ is the permeability of the object, E is the induced electrical field in the conductor, v = r × ω, and θ is the angle between r, as defined in Fig. 1a. Please notice that the sensitivity of the surface coil decreases faster than 1/r. Therefore, in Eq. [1] the detectable magnetization Mxy(r) decreases faster than 1/r, and Vloop cannot increase with increasing r. If the two sides of the loop are very close, as will arise when the loop dimension is reduced to achieve higher and higher decimation factors for parallel spatial-encoded MRI, θ becomes very small. Consequently, the sin θ/2 term in Eq. [1] results in a diminishingly small signal voltage Vloop as the field in the two sides of the loop cancel. On the other hand, if the loop is replaced by a single conductor line (Fig. 1b), the induced voltage is
| [2] |
which has no θ dependence. Comparing Eqs. [1] and [2] as θ approaches zero, the voltage detected by the linear detector Vlinear is unaffected by this dimensional reduction. Thus, the cancellation effect for small loop structures disappears, and an important sensitivity advantage results. If the linear detector is properly terminated and tuned to form a standing wave, the maximum detectable voltage can be increased, analogous to the tuning of the loop coil with lumped or distributed elements.
The electrical and magnetic field distribution of one type of linear antenna, a microstrip with overlay, is illustrated in Fig. 2. The differential form of the induced MRI signal from Eq. [2] is
FIG. 2.
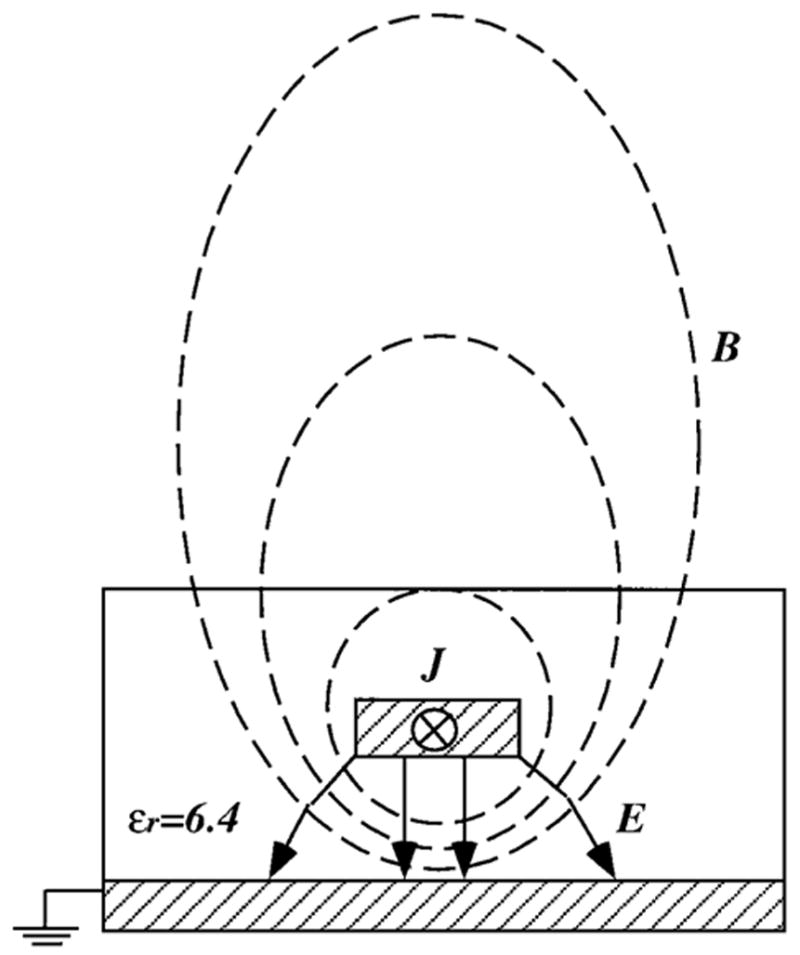
An end elevation view of the EM field of a linear antenna, a microstrip with a dielectric overlay. The substrate and overlay of the microstrip have the same dielectric constant, ∊r. Here J is the current induced by transverse magnetization, and Bt and Et are the TEM field associated with J.
| [3] |
where J is the current density induced in the strip by the rotation of the transverse magnetization, and ρ is the electronic charge density in the conducting strip. Based on the Maxwell equation, this longitudinal time-varying current density will have an associated magnetic field Bt and an electrical field Et that are both transverse to the longitudinal axis of the strip. These transverse EM (TEM) fields Bt and Et cause coupling to adjacent conductors and between other linear antennas that may be assembled in a detector array. Therefore, for the purpose of analyzing coupling effects, we shall assume that the EM field is substantially in the TEM mode. However, the boundary conditions dictate the presence of small longitudinal fields at the interface between the dielectric and air and at the ends of the strip. Thus, we say that this type of EM field is in quasi-TEM mode, in which case most TEM analysis is still valid.
Transmission Lines and Transmission Line Resonators
The microstrip with overlay (Fig. 2) can be treated like a transmission line. For a sinusoidal excitation, the Maxwell equations can be resolved into two second-order differential equations:
| [4] |
where
| [5] |
Here γ is known as the propagation constant, α is the attenuation constant (α = 0 if the dielectric medium is lossless), β is the phase constant, and tan δ ≡ σ/ω∊ is the loss tangent of the dielectric which has permittivity ∊ and conductivity σ.
A transmission line can be analyzed as a two-port network, which is often characterized by the ABCD matrix formalism, as shown in Fig. 3, where
FIG. 3.
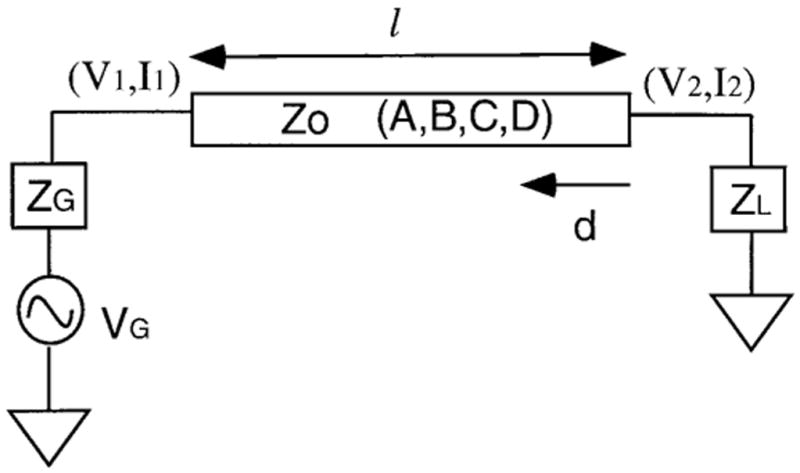
Representation of a strip as a transmission line sandwiched between a source and a load. The transmission line can be described by an ABCD matrix. Its characteristic impedance of the transmission line is Z0, and the length of the line is l. d is the distance measured from the output point of the line. The source voltage is VG, the source impedance is ZG, and the load impedance is ZL. V1 and I1 are the input voltage and current. V2 and I2 are the output voltage and current.
| [6] |
V1 and I1 are the input voltage and current of the two-port network, and V2 and I2 are the output voltage and current. The ABCD matrix of the transmission line is
| [7] |
where Z0 is the characteristic impedance of the strip. From Eq. [6], the normalized input impedance of the transmission line is
| [8] |
where Z is the input impedance, ZL is the impedance of the load, and bars denote normalized values with Z̄L = ZL/Z0, Ā = A, B̄ = B/Z0, C̄ = CZ0, and D̄ = D. The input reflection coefficient of the strip is then:
| [9] |
where V1+ is the incident wave voltage and V1− is the reflection wave voltage.
Transmission line resonators are tuned transmission lines with special terminations. The transmission line length should be either a quarter (l = λ/4) or a half-wavelength (l = λ/2) or an integral multiple thereof at the resonant frequency, and they should be terminated with either a short (ZL = 0) or an open circuit (ZL = ∞). The quality factor of an unloaded transmission line resonator is derived in Appendix A:
| [10] |
From Eq. [5], if the dielectric loss is small, (tan δ < 0.10), and the conductor loss can be ignored, β/2α ~ 1/tan δ, the loss tangent of the dielectric. For example, if the transmission line conductor is inside a glass dielectric, which has a loss tangent of 0.001–0.006, then the unloaded Q of such a transmission line resonator is 167–1000. Thus, the unloaded Q of the linear antenna can be comparable to that of loop coils.
PSA Structure and Decoupling
The PSA is designed to take advantage of linear detector element for phased array detection. It can be made of an array of parallel commensurate microstrips (18–21) with a dielectric layer overlay on the top, as shown in Fig. 4. For our prototype PSA, the dielectric medium is glass with ∊r = 6.4. The quarter wavelength, λ/4, of the proton MRI frequency at 1.5 T (63.87 MHz) is reduced from 117 cm in air to 46 cm in the glass, which is not an unreasonable length for an RF detector for a clinical MRI scanner. Because our General Electric Signa MRI scanner is limited to only four receiver channels, a four-element PSA was fabricated with four copper strips laid in parallel between two sheets of glass. The strips are surrounded by a grounded copper guard ring, which minimizes the EM field interference from the environment and provides the four antenna strips with a nearly identical field distribution. The strip length l can be either a quarter wavelength (λ/4) or a half wavelength (λ/2). The strip width w, spacing s, and thickness of the dielectric, h, are chosen to make the characteristic impedance of the strip, Z0, match the impedance of the connecting cable (or the optimum input impedance of the preamplifiers), in this case, 50 Ω. At both ends of each strip, BNC panel connectors are installed to provide feeding points and terminations.
FIG. 4.
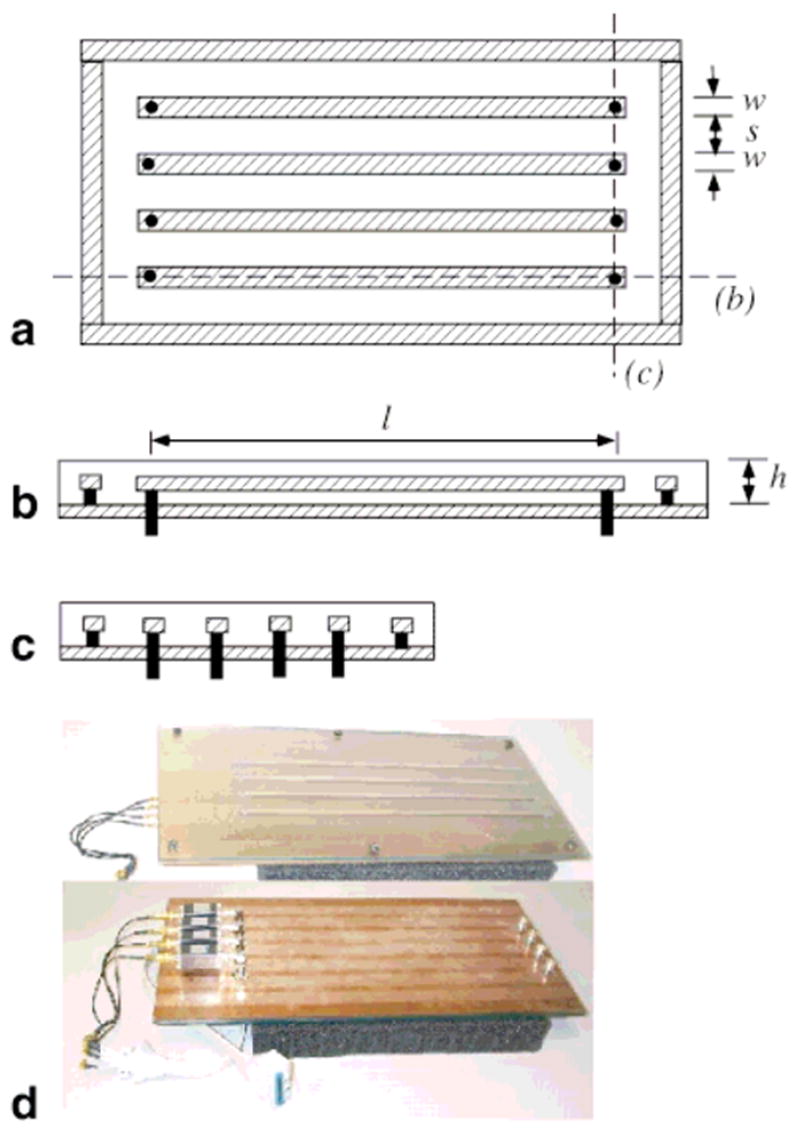
The structure of the PSA: (a) planar view, (b) side elevation, and (c) end elevation. The conductor is shaded; black bars and circles correspond to BNC surface mounts. The four conducting strips are surrounded by a rectangular guard ring. The strips have width w, length l, and spacing s. The thickness of the dielectric medium is h. d shows photographs of the top (above) and underside (below) of the λ/4 PSA prototype.
The TEM field coupling between any two strips can be analyzed with even/odd mode theory (22,23). The analysis assumes that any coupling between two strips can be decomposed into two basic modes, termed even and odd. In the even mode the currents on both strips have the same direction and amplitude, the middle plane between the two strips is equivalent to an open circuit. The odd mode results when the currents on the two strips have the same amplitude but opposite direction, the middle plane between the two strips is equivalent to a short circuit. Since in either mode the reflections and the transmissions on both strips are the same, the net coupling effect is determined by superposing the even- and odd-mode couplings. The coupling coefficient between the two strips is derived in Appendix B:
| [11] |
where subscripts e and o denote the even- and odd-mode input reflection coefficients of the strip at the feeding points, and ΓG is the reflection coefficient of the receiver channel at the feeding point.
There are two special cases in which the coupling between the two strips vanishes due to cancellation of the EM fields. As illustrated in Fig. 5, wave propagation along the strips can either include both forward and reflected waves for an unmatched load, or just a forward wave if the load is matched. In the case of two λ/4 strips terminated either with a short or an open circuit, the standing wave contains both forward and reflected waves with the exact opposite changing rates. By Faraday’s law, the coupled signal is the derivative of the time-varying field that causes it. So the couplings induced by forward and reflected waves are exactly out of phase and cancel each other. From the point of view of a four-port network, the signal incident on port 1 of the coupled lines in Fig. 5, parts 1 and 2, generates a coupled signal, c, emanating from port 2. Normally the coupled signal c is small, so nearly all of the incident signal propagates along the λ/4 strip to the end of the line at port 4, where it is undergoes a 90° phase shift and is reflected by the open or short circuit at the end. The coupled signal c is generated at port 3 by the reflection at port 4, and is itself reflected by the open or short circuit back to port 2 with another 90° phase shift. The net signal leaving port 2 is the sum of the initial coupled signal c plus a similar coupled signal c delayed by 180° because each λ/4 line produces a 90° phase shift. The net signal leaving port 2 is thus zero.
FIG. 5.
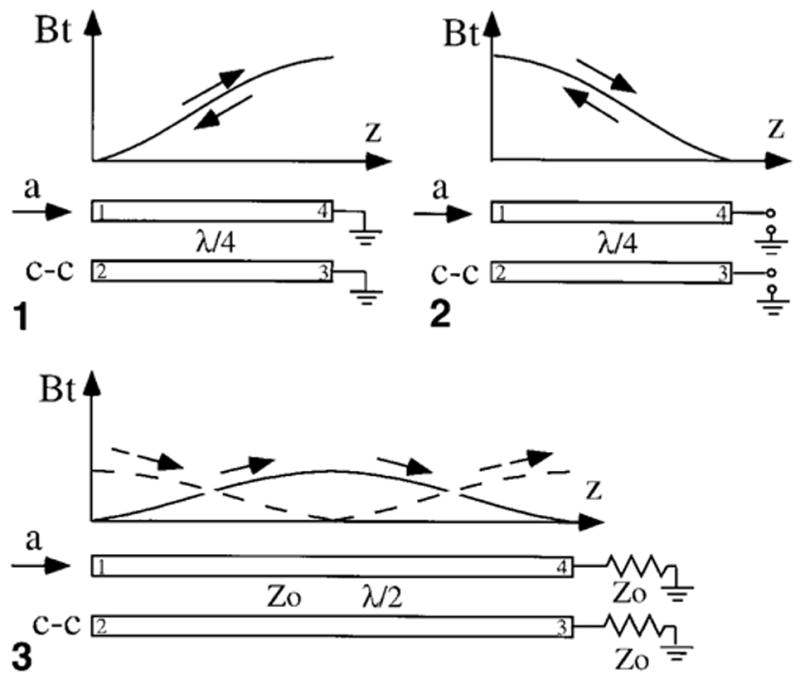
The demonstration of the physical principle of the decoupling between the parallel transmission lines caused by field cancellations. Parts 1 and 2 show a pair of λ/4 transmission line resonators terminated with either a short or open circuit. If incident current is a, the standing wave on the strip is decomposed into a forward current a and a reflection current −a. The transverse magnetic fields Bt generated by a and −a induce coupling currents c and −c in the adjacent strips, which cancel each other, resulting in no coupling between the two strips. Part 3 shows a pair of λ/2 transmission lines with matched loads. The increasing Bt and decreasing Bt generate coupling currents c and −c, which also cancel each other, so there is no coupling between the two λ/2-matched transmission lines either.
The second special case is of two λ/2 strips terminated with matching resistance, as shown in Fig. 5, part 3. Although only a forward travelling wave exists, if the magnetic field at the first λ/4 increases with time then the field at the second λ/4 decreases with time, and vice versa. Therefore, the coupled currents induced by the first λ/4 and the second λ/4 have the same amplitude but opposite directions, so they cancel each other too.
In both cases the strips are decoupled. Based on these two cases, we categorize the PSA into standing wave PSA and travelling wave PSA.
Standing Wave PSA (SW-PSA)
The practical strip length of the SW-PSA is λ/4, and its termination can be with either an open or a short circuit. The standing wave caused by reflection at the short or open termination can double the signal voltage, and provide a high Q via Eq. [10], and SNR. We now shown formally that the coupling among the strips conveniently vanishes for these arrangements of strip length and termination, regardless of the spacing of the strips.
The coupling between two SW-PSA strips can be derived by substituting Eqs. [7]–[9] into Eq. [11]. We shall assume that the attenuation is trivial, that is, α ~ 0. When the strip is terminated with a short circuit, Z̄L = 0, the coupling, k, is:
| [12] |
where Z̄0e and Z̄0o are the normalized even- and odd-mode input impedances of the strips, as defined above. When l = λ/4, βl = π/2 and sin2βl = 0. Thus, provided that ΓG ≠ 1, k = 0, there is no coupling between any two strips in the SW-PSA. But if ΓG = 1, in which the feeding point is open circuit, the sin2βl term cancels, the coupling resumes with maximum, k = (Z̄0e − Z̄0o)/( Z̄0o + Z̄0e).
When the strip is terminated with an open circuit, Z̄L → ∞ , the k becomes:
| [13] |
Equation [13] again indicates that when l = λ/4, βl = π/2, and sin2βl = 0. There is no coupling between strips provided that ΓG ≠ −1. Otherwise, when the feeding point is short circuit, the coupling resumes with maximum, . Thus, special values of the reflection coefficient, ΓG at the feeding point can destroy the otherwise robust decoupling properties of the PSA.
The sensitivity of the standing wave PSA can also be affected by ΓG. The magnetic field sensitivity of the strip corresponds to the current distribution on the strip. Using the transmission line model in Fig. 3, the lossless standing wave current distribution is given by (23):
| [14] |
where d is a parameter measuring the distance from the termination point toward the feeding point, and ΓL is the reflection from the load at the termination point. If a λ/4 strip is terminated by a short, ΓL = −1, and Eq. [14] becomes:
| [15] |
If a λ/4 strip is terminated by an open circuit, ΓL = 1, Eq. [14] becomes
| [16] |
Equation [15] shows that for the shorted λ/4 strip, the standing wave is independent of ΓG. However, for an open λ/4 strip, Eq. [16] shows that the standing wave can be affected by ΓG, unless the input is matched, whereupon ΓG = 0. Equations [15] and [16] demonstrate the sinusoidal nature of the sensitivity distribution (Fig. 5).
To determine the resonance characteristics of an SW-PSA, real dimensions were inserted into planar EM field analysis software (Sonnet Lite, Liverpool, NY). Here four strips are terminated with open circuits. The simulation results, shown in Fig. 6, demonstrate the current distribution and isolation of our λ/4 SW-PSA. The sensitivity distribution as a function of position along the strip predicted by the simulations is consistent with the sinusoidal distribution predicted by Eqs. [15] and [16].
FIG. 6.
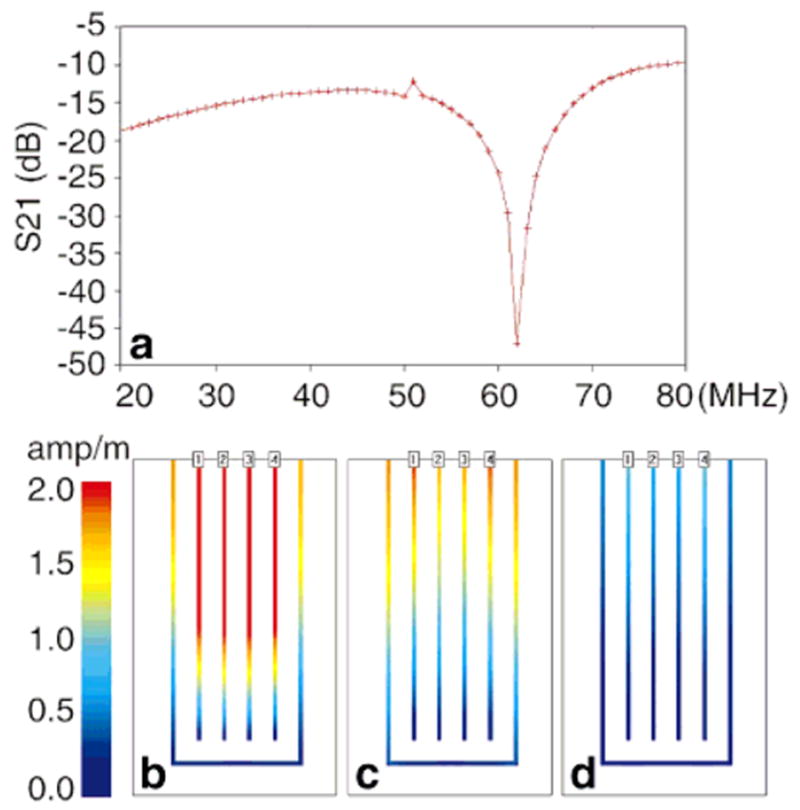
The results of the transmission line analysis of the PSA. a: The simulated S21 response. b: The current distribution at 64 MHz with a strip length of a quarter wavelength, λ/4. There is no distinction among the signals on the four strips, and the standing wave makes the amplitude of the signal high. c: The current distribution at 48MHz, wherein the strip length is 3λ/16. d: The current distribution at 32MHz, wherein the strip length is λ/8. In both c and d, the coupling causes the signals on the center two strips to differ from the signals at the ends. However, a low standing-wave ratio makes the amplitude of the signals much weaker than in a.
Although the standing wave generates high SNR from the strip, the direct coupling of the signal from the strip to the preamplifier is quite inefficient. This is because the open termination results in a short circuit at the feeding point, and the short termination results in an open circuit at the feeding point. One method of addressing this problem is to use a reactive device to couple the signal to the preamplifier. When the strip is terminated with a short circuit, a series capacitor is used for coupling the signal out of the strip. When the strip is open circuit, a shunt inductor can be used for coupling the signal out of the strip.
Travelling Wave PSA (TW-PSA)
The minimum strip length of the TW-PSA is λ/2 and the terminations are the matched loads, Z̄L = 1. Substituting this condition into Eqs. [7]–[9] and [11], the coupling coefficient becomes
| [17] |
At l = λ/2, βl = π, and sinβl = 0, so that again no coupling occurs between the strips. The TW-PSA is a valid design for a fully decoupled strip array that can provide uniform sensitivity along the strip. Its biggest disadvantage is that the matching load shares half of the signal power and causes a corresponding SNR reduction. Also, its minimum length is twice that of the SW-PSA.
Broadband Decoupling
The decoupling mechanisms mentioned above for both types of PSA are directly related to the strip length, so they are wavelength dependent, or narrow-band. Such narrow-band decoupling, however, does not rely on the transverse dimensions (s, w, and h) of the PSA. Therefore, the strips are decoupled regardless of their spacing.
In addition to the narrow-band decoupling, if the ratio of the strip spacing to the height of the medium (s/h) is large enough, the coupling between strips also vanishes. Here the ground plane is used to assist decoupling. Because this type of decoupling only depends on the transverse dimensions (s and h), and is not related to the strip length, it is broadband decoupling. It is characterized analytically by satisfaction of the condition Z0e = Z0o, which results in k = 0 in Eqs. [12], [13], and [17]. The analytical expressions of Z0e and Z0o for a strip pair in a PSA are derived in Appendix C (22). The condition for Z0e = Z0o is:
| [18] |
Equation [18] is solved graphically in Fig. 7. This shows that when s/h > 3, the even- and odd-mode impedance are about equal, and the strips are decoupled regardless of their length.
FIG. 7.
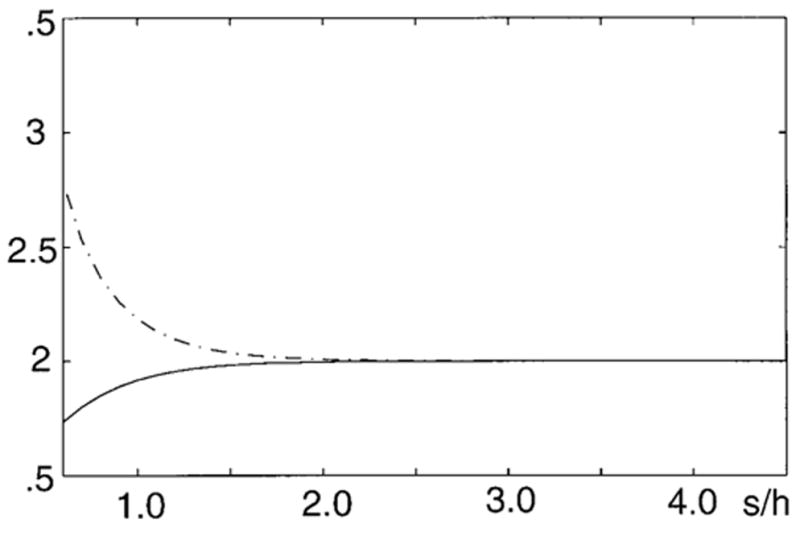
The graphic solution of Eq. [11]. The solid line is the left side of the equation, and the dashed line is the right side of the equation. When s/h > 3, both sides of Eq. [11], and therefore the even- and odd-mode impedance, are equal. The vertical axis is an arbitrary unit.
EXPERIMENTS AND RESULTS
Two PSA prototypes have been built, and the photos of both sides of the λ/4 PSA are shown in Fig. 4d. One is the standing wave PSA with a strip length l = λ/4 = 46 cm. The second is the traveling wave PSA with strip length l = λ/2 = 92 cm. Both have the same strip width w = 0.635 cm, spacing s = 3.175 cm, and dielectric thickness, h = 1.27 cm. All of the antenna strips are parallel to the direction of the static magnetic field of the magnet bore. At the feeding point each strip is connected to an RF-screened box containing a PIN diode transmit/receive switch and a DC blocking capacitor. The boxes for the SW-PSA also contain the reactive coupling and matching circuits.
The performance of the PSA was measured with S-parameters on a Hewlett-Packard network analyzer (HP 8722D and HP 4195A; Hewlett Packard, Palo Alto, CA) and GE Signa and LX 1.5 T MRI scanners (GE Medical Systems, Milwaukee, WI). The S21 measurements confirmed the decoupling predicted by Eqs. [12], [13], and [17]. MRI was performed to demonstrate the standing wave condition described in Eqs. [15] and [16] for the PSA, and, moreover, to show that the PSA is a viable near-field phased-array detector for in vivo MRI.
Coupling Measurements
Equations [12], [13], and [17] indicate that both the SW-PSA and TW-PSA can have narrow-band decoupling if the strips are of a proper length. Such decoupling can be measured by the S21 parameter on the network analyzer, as shown in Fig. 8. The S-parameter measurement reveals that the SW-PSA is fully narrow-band-decoupled when it is loaded, while the TW-PSA exhibits such decoupling when it is unloaded. The comparison is shown in Fig. 8. The network analyzer is unable to show narrow-band decoupling of the unloaded SW-PSA because an unloaded λ/4 strip converts a short termination into an open circuit at the feeding point. Therefore, the characteristics of the standing wave signal cannot be detected at the feeding points. When the PSA is loaded, the coupling between the PSA and the load causes a phase shift on the standing wave, which allows the network analyzer to sense the existence of standing waves. Note that the narrow-band decoupling property of the TW-PSA deteriorates somewhat because the human body loads the strips unevenly over their length.
FIG. 8.
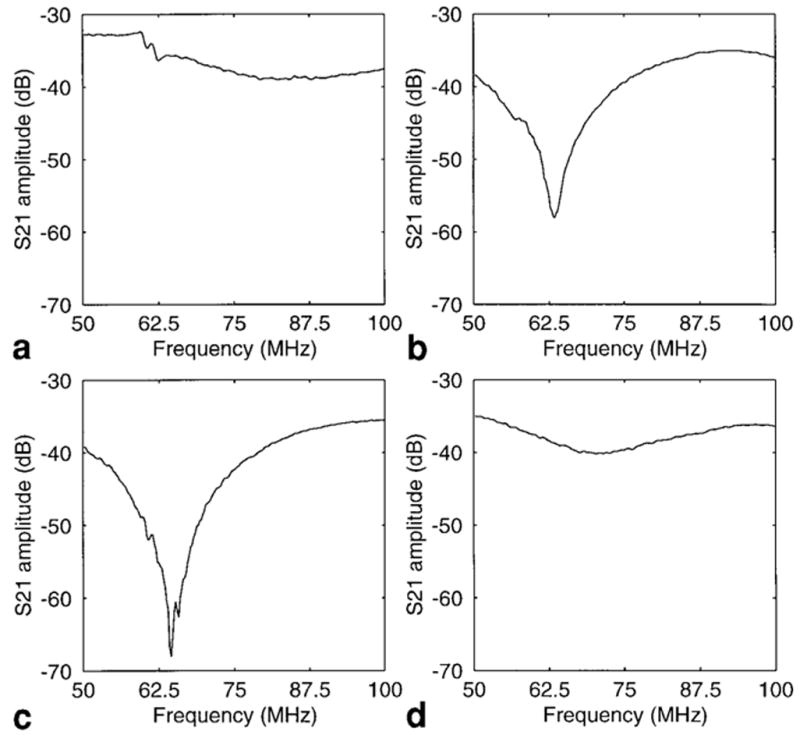
S21 measurements of the prototype 64 MHz PSA recorded from the network analyzer, demonstrating both narrow- and broadband decoupling in (a and b) the SW-PSA and (c and d) the TW-PSA. Part a is the S21 of an unloaded, shorted λ/4 strip pair of the SW-PSA. Although broadband decoupling of 30–40 dB is evident, narrow-band decoupling at resonance cannot be seen due to the open circuit at the input. b: The S21 when the shorted λ/4 strip pair of the SW-PSA is loaded. The load causes a phase shift, revealing the narrow-band decoupling. c: The S21 of an unloaded, matched λ/2 strip pair of the TW-PSA. d: The S21 of the matched λ/2 strip pair of the TW-PSA when it is loaded. The SW-PSA has a much better performance than the TW-PSA when it is loaded (b vs. d).
Because the transverse dimension of the PSA under test has s = 3.175 cm, h = 1.27 cm, s/h ≥ 2.5, Eq. [18] and Fig. 7 show that it will have some broadband decoupling properties. Figure 8 shows evidence that the PSA benefits from both narrow- and broadband decoupling properties. Broadband decoupling of about −30 dB or more is evident as a result of the approximate satisfaction of the broadband decoupling condition, Ze ≈ Zo. At the resonance frequency, an additional −30 dB decoupling results from the tuned length of the PSA, providing a total decoupling of about −60 dB.
Standing and Travelling Waves
When the strip is terminated with a match, the EM field on the strip is a travelling wave. The sensitivity is uniformly distributed along the strip, as shown by MRI in Fig. 9a. If the strip is terminated with an open or short circuit, the EM field on the strip is a standing wave. As predicted by Eqs. [15] and [16] for the sensitivity along the strips, the MRI sensitivity should be much higher than the travelling wave on one side, but lower on the other side, and this is evident in Figs. 9b and c. Thus, by terminating the strip with open or short circuits, the sensitivity along certain sections of the strip can be effectively enhanced. Alternate or switched termination arrangements are also envisaged that could provide uniform or controlled sensitivity profiles over extended fields of view (FOVs).
FIG. 9.
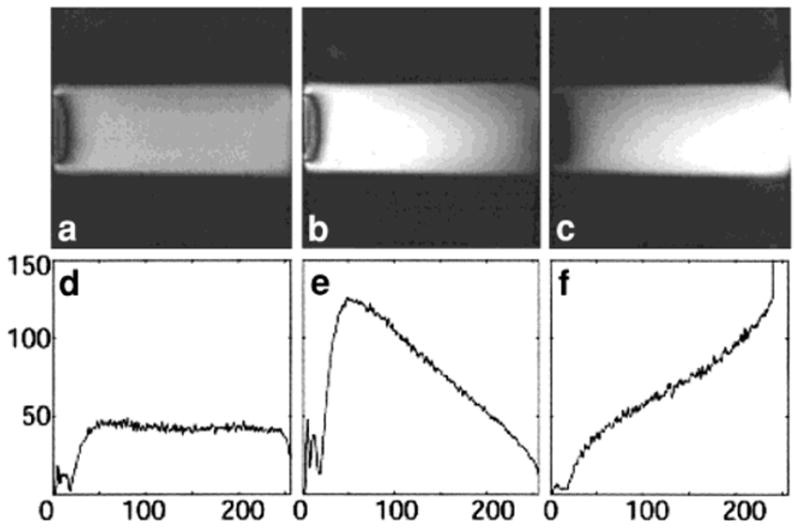
(a–c) Coronal images and (d–f) corresponding intensity profiles acquired from a water phantom oriented parallel with the strips, and at the same height from the surface of the SW- and TW-PSA. The length of the phantoms is the same as the length of the strips of the SW-PSA (46 cm) and the FOV of the images. Part a was acquired with the TW-PSA and shows a uniform signal density along the strips. Parts b and c were acquired with the SW-PSA terminated with open and short circuits, respectively. The regional variation in sensitivity is due to the standing wave. In parts d–f, the vertical axes are signal intensity (arbitrary units) and the horizontal axes are vertical pixel numbers of the corresponding images. The SW-PSA produces higher but less uniform SNR from the water phantom than does the TW-PSA.
Sensitivity Profiles
The sensitivity profiles of the individual strips of the PSA are obtained with an axial MRI using the TW-PSA and a GE water-filled phantom, as shown in Fig. 10. It is evident from Fig. 10 that the sensitivity profile of each strip during parallel detection does not interfere with the sensitivities of the other strips in the PSA. Note that in the regions where the strips have overlapping sensitivity, there is no signal enhancement or signal cancellation due to phase differences between the signals from different strips. Other experiments show that if the strips are not well decoupled, this beneficial feature is not realized. Like the circular loop surface coil, the highest sensitivity occurs closest to the strip.
FIG. 10.
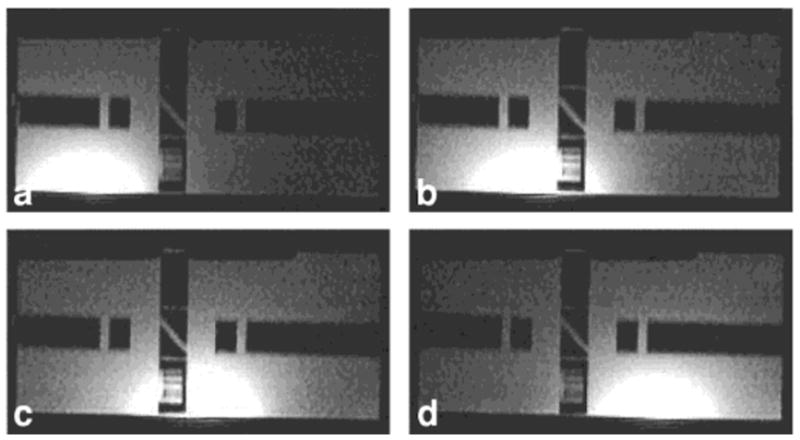
a–d: Axial images of each separate strip of the four-strip TW-PSA during a parallel detection from a GE Medical Systems standard phantom containing rectangular signal voids. The images, which correspond to the sensitivity profiles of each strip, show no mutual interference, even in regions where the elements have overlapping sensitivity. FOV = 28 cm.
Conventional and Parallel-Encoded MRI
The PSA can be used in MRI with conventional phase-encoding steps. It has the potential of providing a large number of strips to boost SNR and FOV. In vivo MRI of the human knee and spine were acquired with gradient echo and spin-echo pulse sequences using the four-element PSA, and are shown in Fig. 11. The images show that the PSA can be used for detecting MRI signals with a potential for using a much larger number of strips in a detector array than is presently practical with conventional designs.
FIG. 11.
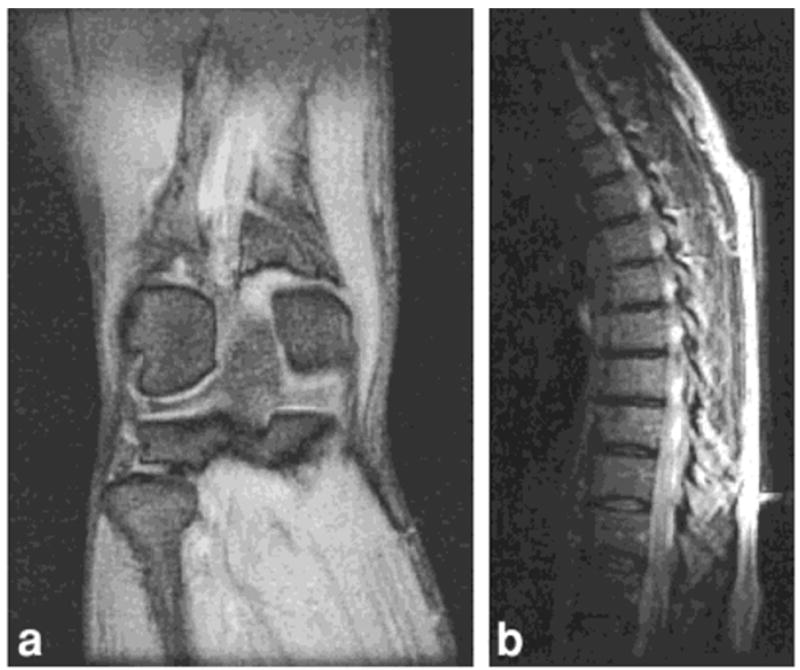
Conventional images acquired with a four-channel PSA. a: A coronal gradient echo image of the human knee (NEX = 2, TR = 500 msec, TE = 11 msec, NEX = 2, 256 × 256 points, FOV = 32 cm). b: A fast spin-echo sagittal image of the human spine (NEX = 2, TR = 4 sec, TE = 102 msec, echo train length = 16, 256 × 160 points, receiver bandwidth 16 kHz).
Using the PSA as a detector and ASP (3) as a reconstruction method, a sensitivity-encoded MRI experiment was performed on a phantom with a decimation factor of 2. The results showing the individual decimated images from the four channels of the PSA, and an image reconstructed with ASP are shown in Fig. 12a–e. Note that in the ASP image (Fig. 12e) there is a slight aliasing along the phase-encoding direction due to slight imperfections in the generated harmonics (1,3,25). There is also some distortion along the frequency-encoding direction, where we performed a simple fast Fourier transform reconstruction without the standard “gradient warp” correction for the gradient nonlinearity. This is not an artifact of the PSA.
FIG. 12.

Demonstration of partial parallel spatial-encoded MRI using the ASP method (3) with PSA on a GE Medical Systems standard resolution phantom with a horizontal void. a–d: The decimated images from four channels of the PSA with a decimation factor of 2. e: The image reconstructed from this raw ASP PSA data showing substantial elimination of the residual aliasing artifacts. The images are acquired with a spin-echo sequence (coronal, TR = 1 sec, TE = minimum, FOV = 16 cm, NEX = 2).
DISCUSSION
A novel near-field MRI phased-array detector, the PSA, was introduced. Its EM properties and criteria for optimum performance were analyzed, and two prototypes were designed and fabricated for a conventional four-channel, whole-body 1.5T MRI scanner. Both conventional and sensitivity-encoded (ASP) techniques were demonstrated on phantoms and/or a normal volunteer.
This novel design takes advantage of narrow- and broadband TEM wave properties that eliminate coupling between all the elements of the array. The analysis shows that narrow-band decoupling depends only on the strip length and not on the transverse dimensions (s, w, or h). Therefore, the narrow-band decoupling property of the PSA will remain when the spacing s and strip width w are reduced to accommodate larger numbers of elements. In contrast, the broadband decoupling property does not depend on the strip length, but is a function of the transverse dimensions, specifically, the ratio s/h. Thus, if the spacing s is reduced to accommodate a larger number of elements, the height of the dielectric medium h should be reduced proportionately in order to maintain the broadband decoupling effect. Therefore, the inherent decoupling properties of the PSA—particularly its narrow-band decoupling property—ideally suit it to detector arrays with very large numbers of elements that are essential for maximizing the benefits of fast, parallel sensitivity-encoded MRI techniques, such as SMASH or ASP.
Note that unlike the phased-arrays based on loop coil elements, the sensitivity of the PSA does not scale down when the spacing and strip width are decreased, as the number of array elements are increased for parallel sensitivity-encoded MRI. The analysis shows that while the signal voltage of the loop coil element decreases with reductions in loop dimension as the signals detected by opposite sides of the loop effectively cancel for large depths, the signal voltage in the PSA does not suffer from this effect. The SNR characteristics as a function of depth are accordingly different, and are more akin to those of the “loopless antenna” (26).
The potential for deploying large numbers of detectors offers new opportunities for designing detection systems to produce SNR improvements that approach the ultimate intrinsic SNR, by increasing the options available for placement of the detector elements (27,28). In particular, the PSA design could render practical phased-array systems for high-field MRI scanners. Currently, phased-array technology is largely precluded from such scanners by the tuning and coupling problems endemic to conventional designs. The higher-resonance frequencies are simply accommodated by shortening the strip length, and/or adjusting the permittivity of the substrate and overlay, while retaining all of the beneficial decoupling properties. If the λ/4 strip length becomes too short, the length can be increased to λ/2, which has the benefit of moving the high sensitivity region to the middle of the SW-PSA strips.
APPENDIX
Q-Factor of the Transmission Line Resonators
In general, the Q-factor of both series and parallel resonance circuits can be calculated by the following equations:
| [A1] |
Here ωr is the resonant frequency, the impedance of the series resonator is Z = R + jX, and the admittance of the parallel resonator is Y = G + jB.
An open λ/4 transmission line resonators is equivalent to a series LC resonator, and its impedance can be calculated based on Eqs. [7] and [8]:
| [A2] |
When αl ≪ 1, tanhαl ≈ αl, (αl)2 ≈ 0. And if l → λ/4, βl → λ/2, (cotβl)2 ≈ 0. Eq. [A2] becomes
| [A3] |
Given β = ω/v, v is the phase velocity, substituting Eq. [A3] into Eq. [A1], we have Q = β/2α.
A short λ/4 transmission line resonator is equivalent to a parallel LC resonator. Its admittance can be calculated based on Eqs. [7] and [8]:
| [A4] |
Substituting Eq. [A4] into Eq. [A1], we have Q = β/2α. With the same principle, we can derive Q = β/2α for the λ/2 transmission line resonators.
Coupled Signal in a Pair of Planar Strips
The coupled signal between two strips can be calculated from an odd/even mode analysis, as depicted in Fig. 13. We assume that a0 is the normalized incident power when ΓG = 0, a1 is the normalized incident powers when ΓG ≠ 0, and b1, b2, b3, and b4 are the normalized reflected power eminating from each port. According to Ref. 23,
FIG. 13.
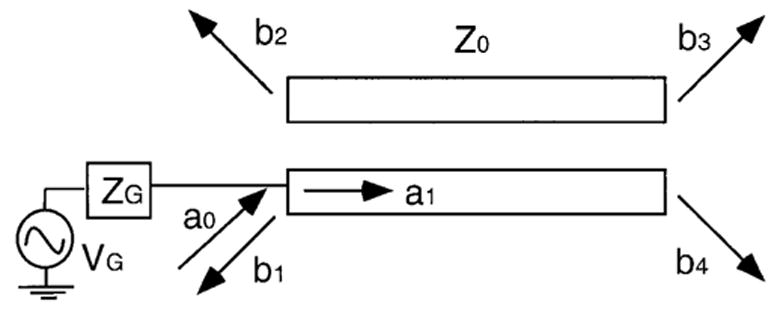
Circuit diagram for even/odd mode analysis of a pair of transmission lines. VG is the source voltage; ZG is impedance of the source; a0 is the incident power wave (23) without reflection from the source; a1 is the incident power wave with reflection from the source; and b1, b2, b3, and b4 are the reflection or scatter power wave (23) from the four ports. The incident wave at port 1 is decomposed into even- and odd-mode power wave components. The even mode is comprised of incident waves a1/2 at both ports 1 and 2. The odd mode assumes is comprised of incident waves a1/2 at port 1, and −a1/2 at port 2. The superposition of both even and odd modes is equivalent to the incident wave a1 at port 1 only.
| [B1] |
We define Γe and Γo as the even- and odd-mode reflection coefficients, and Te and To are the even- and odd-mode transmission coefficients. By superimposing the even and odd modes together,
| [B2] |
Here, we are only concerned with b2, which is:
| [B3] |
where . Thus the coupling coefficient k = b2/a0, as shown in Eq. [11].
Distributed Capacitance of a Pair of Planar Strips
In general, as indicated in Ref. 22, the even- and odd-mode characteristic impedance of a pair of coupled transmission lines is
| [C1] |
Here Ceven and Codd, the even- and odd-mode distribution capacitance of two planar strips, are defined as in Fig. 14, where
FIG. 14.
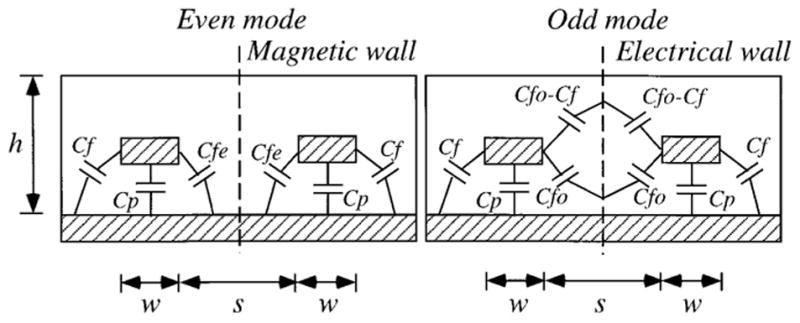
End elevation sketch of the PSA showing the distributed capacitance for even (left) and odd (right) modes of a pair of coupled strips. The vertical dashed lines indicate magnetic and electric “walls” where the magnetic and electric fields are zero (virtual ground for the electric field).
| [C2] |
Cp is the parallel plate capacitance, Cf is the edge fringing capacitance, Cfe is the even-mode coupling capacitance, and Cfo is the odd-mode coupling capacitance. They can be expressed in terms of the physical parameters of the two strips, as shown by Cohn (24):
| [C3] |
Given the transverse dimensions of the PSA strips (s, w, and h), Z0e and Z0o can be calculated from Eqs. [C1], [C2], and [C3]. Note that arrangements of the transverse dimensions exist such that the even- and odd-mode impedances are equal. From Fig. 13 and Eq. [C2], we know that condition is
| [C4] |
Footnotes
Grant sponsor: National Institutes of Health; Grant numbers: 1R21HL62332; R01HL56882; 1R01-HL61695-0; 1R01-HL61912-01.
References
- 1.Sodickson DK, Manning WJ. Simultaneous acquisition of spatial harmonics (SMASH): fast imaging with radiofrequency coil arrays. Magn Reson Med. 1997;38:591–603. doi: 10.1002/mrm.1910380414. [DOI] [PubMed] [Google Scholar]
- 2.Pruessmann KP, Weiger M, Scheidegger MB, Boesiger P. SENSE: sensitivity encoding for fast MRI. Magn Reson Med. 1999;42:952–962. [PubMed] [Google Scholar]
- 3.Lee RF, Westgate CR, Weiss RG, Bottomley PA. An analytical SMASH procedure (ASP) for sensitivity-encoded MRI. Magn Reson Med. 2000;43:716–725. doi: 10.1002/(sici)1522-2594(200005)43:5<716::aid-mrm14>3.0.co;2-k. [DOI] [PMC free article] [PubMed] [Google Scholar]
- 4.Roemer PB, Edelstein WA, Hayes CE, Souza SP, Mueller OM. The NMR phased array. Magn Reson Med. 1990;16:192–225. doi: 10.1002/mrm.1910160203. [DOI] [PubMed] [Google Scholar]
- 5.Wright SM, Magin RL, Kelton JR. Arrays of mutually coupled receiver coils: theory and application. Magn Reson Med. 1991;17:252–268. doi: 10.1002/mrm.1910170128. [DOI] [PubMed] [Google Scholar]
- 6.Porter JR, Wright SM, Reylowski A. A 16-element phased-array head coil. Magn Reson Med. 1998;40:272–279. doi: 10.1002/mrm.1910400213. [DOI] [PubMed] [Google Scholar]
- 7.Lee RF, Giaquinto R, Constantinides C, Souza S, Weiss RG, Bottomley PA. A broadband phased-array system for direct phosphorus and sodium metabolic MRI on a clinical scanner. Magn Reson Med. 2000;43:269–277. doi: 10.1002/(sici)1522-2594(200002)43:2<269::aid-mrm14>3.0.co;2-j. [DOI] [PubMed] [Google Scholar]
- 8.Kwiat D, Einav S. A decoupled coil detector array for fast image acquisition in magnetic resonance imaging. Med Phys. 1991;18:251–265. doi: 10.1118/1.596723. [DOI] [PubMed] [Google Scholar]
- 9.Chen C-N, Hoult DI. Biomedical magnetic resonance technology. Bristol, New York: Adam Hilger; 1989. [Google Scholar]
- 10.Hayes CE, Foo TKF, Perman WH, Moran PR, Bottomley PA. NMR radio frequency field coil with distributed current. 4,783,641. US patent. 1988
- 11.Hayes CE, Edelstein WA, Schenk JF, Mueller OM, Eash M. An efficient, highly homogeneous radiofrequency coil for whole-body NMR imaging at 1.5T. J Magn Reson. 1985;63:622–628. [Google Scholar]
- 12.Tropp J. The theory of the birdcage resonator. J Magn Reson. 1989;82:51–62. [Google Scholar]
- 13.Foo TKF, Hayes CE, Kang YW. An analytical model for the design of RF resonators for MR body imaging. Magn Reson Med. 1991;21:165–177. doi: 10.1002/mrm.1910210202. [DOI] [PubMed] [Google Scholar]
- 14.Vaughan JT, Hetherington HP, Out JO, Pan JW, Pohost GM. High frequency volume coils for clinical NMR imaging and spectroscopy. Magn Reson Med. 1994;32:206–218. doi: 10.1002/mrm.1910320209. [DOI] [PubMed] [Google Scholar]
- 15.Vaughan JT. An improved volume coil for high field MRI; Proceedings of the 7th Annual Meeting of ISMRM; Philadelphia. 1999. p. 167. [Google Scholar]
- 16.Schneider HJ, Dullenkopf P. Slotted tube resonator: a new NMR probe head at high observing frequencies. Rev Sci Instrum. 1977;48:68–73. [Google Scholar]
- 17.Roschmann PK. High-frequency coil system for a magnetic resonance imaging apparatus. 4,746,866. US patent. 1988
- 18.Wenzel RJ. Exact design of TEM microwave networks using quarter-wave lines. IEEE Trans Microwave Theory Tech. 1964;MTT-12:94–111. [Google Scholar]
- 19.Jones EMT, Bolljahn JT. Coupled-strip-transmission-line filters and directional couplers. IEEE Trans Microwave Theory Tech. 1956;MTT-4:75–81. [Google Scholar]
- 20.Napoli LS, Hughes JJ. Characteristics of coupled microstrip lines. RCA Rev. 1970 Sept;:479–498. [Google Scholar]
- 21.Bryant TG, Weiss JA. Parameters of microstrip transmission lines and of coupled pairs of microstrip lines. IEEE Trans Microwave Theory Tech. 1968;MTT-16:1021–1027. [Google Scholar]
- 22.Helszajn J. Microwave planar passive circuits and filters. New York: John Wiley & Sons; 1994. [Google Scholar]
- 23.Rizzi PA. Microwave engineering passive circuits. New Jersey: Prentice Hall; 1988. [Google Scholar]
- 24.Cohn SB. Shielded coupled-strip transmission line. IRE Trans. 1955;MTT-3:29–38. [Google Scholar]
- 25.Jacob PM, Griswold MA, Edelman RR, Sodickson DK. AUTO-SMASH: a self-calibrating technique for SMASH imaging. MAGMA. 1998;7:42–54. doi: 10.1007/BF02592256. [DOI] [PubMed] [Google Scholar]
- 26.Ocali O, Atalar E. Intravascular magnetic resonance imaging using a loopless catheter antenna. Magn Reson Med. 1997;37:112–118. doi: 10.1002/mrm.1910370116. [DOI] [PubMed] [Google Scholar]
- 27.Ocali O, Atalar E. Ultimate intrinsic signal-to-noise ratio in MRI; Proceedings of the 5th Annual Meeting of ISMRM; Vancouver, Canada. 1997. p. 1487. [Google Scholar]
- 28.Schnell W, Vester M, Renz W, Ermert H. Ultimate SNR of planar MR array coils; Proceedings of the 5th Annual Meeting of ISMRM; Vancouver, Canada. 1997. p. 1506. [Google Scholar]


