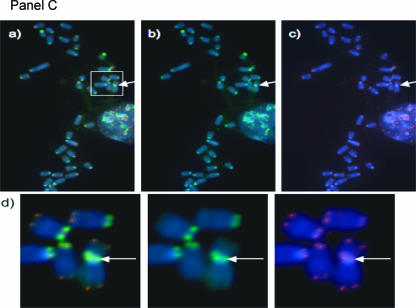
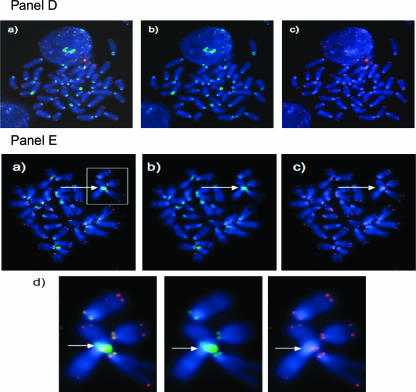
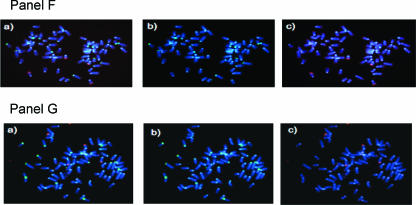
Figure 3.
Centromere-telomere FISH performed on metaphases of mouse lymphocytes. Representative images are shown: Panel (A) primary lymphocyte metaphase from a T38HxBalb/c mouse; Panel (B) metaphase of MOPC460D; Panel (C) partial metaphase of the primary mouse plasmacytoma PCT1G1; Panel (D) preB cell metaphase without MycER activation; Panel (E) preB metaphase 30 hours after MycER activation; Panel (F) Ba/F3 cells without Δ106-MycER activation; Panel (G) Ba/F3 cells 30 hours after Δ106-MycER activation. In each panel, (a) represents dual-color FISH hybridization signals of telomeres (red) and centromeres (green); (b) shows only centromeric signals; and (c) shows only telomeric signals. Rb chromosomes shown in Panel (B), Panel (C), and Panel (E) are highlighted with white boxes and arrows, and then enlarged (d) to observe CTC signals. Note small telomeric signals at Rb fusion in Panel (B, d). The overall telomeric length in MOPC460D is reduced in comparison to the telomeric length of primary B cells and preB cells (data not shown; Figure 1, Panel C).


