

Abstract
Electrical coupling between neurons with similar properties is often studied. Nonetheless, the role of electrical coupling between neurons with widely different intrinsic properties also occurs, but is less well understood. Inspired by the pacemaker group of the crustacean pyloric network, we developed a multicompartment, conductance-based model of a small network of intrinsically distinct, electrically coupled neurons. In the pyloric network, a small intrinsically bursting neuron, through gap junctions, drives 2 larger, tonically spiking neurons to reliably burst in-phase with it. Each model neuron has 2 compartments, one responsible for spike generation and the other for producing a slow, large-amplitude oscillation. We illustrate how these compartments interact and determine the dynamics of the model neurons. Our model captures the dynamic oscillation range measured from the isolated and coupled biological neurons. At the network level, we explore the range of coupling strengths for which synchronous bursting oscillations are possible. The spatial segregation of ionic currents significantly enhances the ability of the 2 neurons to burst synchronously, and the oscillation range of the model pacemaker network depends not only on the strength of the electrical synapse but also on the identity of the neuron receiving inputs. We also compare the activity of the electrically coupled, distinct neurons with that of a network of coupled identical bursting neurons. For small to moderate coupling strengths, the network of identical elements, when receiving asymmetrical inputs, can have a smaller dynamic range of oscillation than that of its constituent neurons in isolation.
INTRODUCTION
Cells that are electrically coupled through gap junctions are found in numerous biological tissues, including nervous systems of both vertebrates and invertebrates (Bennett 1997; Dermietzel and Spray 1993). The common role of electrical coupling among neurons is believed to be synchronization of their activities (Jefferys 1995; Perez Velazquez and Carlen 2000), although theoretical studies show that electrical coupling can lead to more complex network activity (Chow and Kopell 2000; Sherman and Rinzel 1992). When the neurons involved are intrinsically distinct, the behavior of an electrically coupled 2-cell network can be fairly unintuitive (Medvedev and Kopell 2001; Wilson and Callaway 2000). A passive neuron electrically coupled to an oscillatory neuron can have a nonmonotonic effect on the oscillatory cell frequency as the coupling strength is increased (Kepler et al. 1990). Electrical coupling between an oscillatory and a bistable neuron can result in a wide variety of behaviors, again depending on their intrinsic properties and the coupling strength (Kopell et al. 1998).
The rhythmically active pyloric network of the crustacean stomatogastric ganglion (STG) is driven by a pacemaker kernel consisting of one anterior burster (AB) neuron and 2 pyloric dilator (PD) neurons that are electrically coupled. The AB neuron is a small neuron that, when isolated from all local network interactions, produces rhythmic bursts of action potentials. The PD neurons are larger than the AB neuron and in isolation they fire tonically. Rhythmic bursting cannot be typically induced in the PD neurons by externally injected current (Eisen and Marder 1984; Miller and Selverston 1982). These neurons also differ in the neurotransmitters they use (Marder and Eisen 1984b), their response to neuromodulators, and pre- and postsynaptic targets (Marder and Eisen 1984a). In the intact network, the AB–PD group reliably produces in-phase bursts in a wide frequency range that can be altered by current injection (Ayali and Harris-Warrick 1999; Eisen and Marder 1984; Hooper 1997; Miller and Selverston 1982).
We developed a model of an electrically coupled AB–PD pair. To take into account the distinct intrinsic and dynamic properties of these neurons we used current measurements from cultured STG neurons of the spiny lobster Panulirus interruptus (Turrigiano et al. 1995) as a starting point. To tune the model to capture the dynamic activity of the biological pacemaker neurons, we used experimental data from the individual isolated neurons or the isolated pacemaker group under the 2 conditions in which they are usually experimentally studied; that is, in the absence and presence of the descending neuromodulatory inputs to the STG.
We use this model to illustrate, at the single neuron level, behaviors that arise from coupling compartments that in isolation are capable of producing very different oscillations. At the network level we explore the coupling ranges for which an intrinsically bursting neuron drives a tonic spiking neuron to burst synchronously with it, and the effect of the compartmental structure on their ability to synchronize. We conclude by asking how the dynamical repertoire of an intrinsically bursting neuron is affected when it is electrically coupled to an identical neuron or to an intrinsically distinct one.
METHODS
Experiments
Adult male and female spiny lobsters (Panulirus interruptus), weighing 400 – 800 g, were purchased from Don Tomlinson Fisheries (San Diego, CA) and kept in artificial seawater tanks at 12–15°C until use. Before dissection, the animals were covered in ice for about 30 min. Standard methods (Harris-Warrick 1992; Selverston et al. 1976) were used to isolate the stomatogastric nervous system [including the STG and the esophageal (OG) and the paired commissural (CoG) ganglia], which was then pinned down in a Sylgard-coated petri dish. The preparations were superfused with normal saline, 18°C, pH 7.35, containing (in mM) 12.8 KCl, 479 NaCl, 13.7 CaCl2, 10.0 MgSO4, 3.9 NaSO4, 11.2 Trizma base, and 5.1 maleic acid.
The STG was desheathed to allow penetration of the cell bodies. Glass microelectrodes pulled using a Flaming–Brown micropipette puller (Sutter Instruments, Novato, CA) were filled with 0.6 M K2SO4 and 0.02 M KCl (resistance 15–23 MΩ) for neuron identification and current injections or backfilled with 5–10% lucifer yellow (in dH2O) backfilled with 1 M LiCl (resistance 30 –50 MΩ) for photoinactivation. Identification of the neurons was achieved by matching their intracellular recordings to extracellular recordings on motor nerves (Selverston et al. 1976).
On identification, the neurons were isolated by photoinactivating all neurons that establish synaptic connections onto them. That is, for AB isolation, the 2 PD and the ventricular dilator (VD) neurons were inactivated, whereas for PD isolation, the AB, the VD, and the lateral pyloric (LP) neurons were inactivated. To isolate the AB–PD group, the VD and LP neurons were inactivated. The complete photoinactivation procedure is outlined in Eisen and Marder (1984), Hooper and Marder (1987), and Miller and Selverston (1982).
Once isolated, the AB neuron was impaled with 2 electrodes, one for injecting current and one for recording voltage in current clamp. The current-injection protocol was carried out using an Axoclamp 2B amplifier (Axon Instruments, Union City, CA). Single square pulses (duration 60 s) were injected into the AB neuron with various DC current levels to shift the baseline membrane potential ±70 mV from rest. For isolated PD neuron experiments, both PD neurons were impaled with 2 electrodes and current was simultaneously injected into both neurons using the same protocol as above. For isolated AB–PD unit experiments, the AB neuron and one PD neuron were impaled with 2 electrodes each. Descending neuromodulatory inputs to the STG were reversibly blocked by building a Vaseline well around the desheathed stomatogastric nerve that was filled with 1 M sucrose and 10−6 M tetrodotoxin (TTX; Biotium, Hayward, CA).
A Digidata 1332A board was used for data acquisition and current injection with pClamp 9 software (Axon Instruments). The acquired data were saved as individual binary files and were analyzed either with the readscope software (http://stg.rutgers.edu/software/software.htm) developed in the Nadim laboratory or with scripts on a Linux platform.
Simulations
Each neuron was modeled with 2 compartments, one representing the soma, primary neurite, and dendrites (S/N), and the other representing the axon (A). Each A compartment is responsible for the production of action potentials. In each compartment the membrane potential V obeyed the current conservation equation
where C is the membrane capacitance, Iext is the externally injected current, Iint is the sum of intrinsic and modulatory currents, and Icoup is the sum of the axial current (Iaxial) from the adjacent compartment and (in the case of the S/N compartment) the gap-junctional current (Igap).
The intrinsic and modulatory currents were based primarily on experimental data from P. interruptus cultured STG neurons (Turrigiano et al. 1995).
These currents are described as a product of a maximal conductance gi, activation mi, and inactivation hi variables, and a driving force (V − Ei), where Ei is the reversal potential that corresponds to the particular ion i
The exponents pi and qi take integer values between 0 and 4, depending on the current type. The behavior of the activation and inactivation variables is described by
where m∞ and h∞ represent the steady-state values, and τm and τh are the respective time constants. The dependency on voltage and intra-cellular Ca2+ concentration ([Ca2+]) of each of these functions is given in Table 1. The steady-state activation of IKCa also depends on [Ca2+] (Table 1). The values of maximal conductances gi are given in Table 2.
TABLE 1.
Voltage and calcium dependency for the steady-state activation m and inactivation h of the currents

TABLE 2.
Parameter values of the model
| AB |
PD |
|||
|---|---|---|---|---|
| gi, μS | Ei,mV | gi, μ S | Ei, mV | |
| Axon | ||||
| INa | 300 | 50 | 1,110 | 50 |
| IK | 52.5 | −80 | 150 | −80 |
| IL | 0.0018 | −60 | 0.00081 | −55 |
| C | 1.5 nF | 6.0 nF | ||
| Soma | ||||
| ICaT | 55.2 | 22.5 (10) | ||
| ICaS | 9 | 60 (54) | ||
| INap | 2.7 | 50 | 4.38 | 50 |
| Ih | 0.054 | −20 | 0.219 | −20 |
| IK | 1,890 | −80 | 1576.8 | −80 |
| IKCa | 6,000 | −80 | 251.85 | −80 |
| IA | 200 | −80 | 39.42 | −80 |
| Iproc | 570 (0) | 0 | ||
| IL | 0.045 | −50 | 0.105 | −55 |
| C | 9.0 nF | 12.0 nF | ||
| [Ca] | τca = 303 ms, F = 0.418 μM/nA, Co = μM | τca = 300 ms, F = 0.515 μM/nA, Co = μM | ||
| Icoup | gaxial = 0.3 μS, ggap = 0.75 μ S | gaxial = 1.05 μS ggap = 0.75 μ S, | ||
The numbers in parentheses denote the absence of modulatory inputs.
In the S/N compartments, [Ca2+] is governed by
where τCa is the Ca2+ buffering time constant, Co is the background intracellular Ca2+ concentration, and the factor F translates the total Ca2+ current ICa (in nA) into an intracellular concentration. The values of τCa, F, and Co used in this model are given in Table 2.
The reversal potential ECa for the calcium currents was computed using the intracellular calcium concentration from the Nernst equation, assuming an extracellular concentration of 13 mM (Buchholtz et al. 1992). All other reversal potentials were constant and are given in Table 2.
In the case of the model AB neuron, the presence of neuromodulatory inputs was modeled by adding a fast, noninactivating, voltage-gated, inward current referred to as the modulatory proctolin current Iproc (Golowasch et al. 1992; Swensen and Marder 2000). The voltage dependency and related parameters of the proctolin current are described in Tables 1 and 2. Because, in P. interruptus, proctolin has no effect on the biological PD neuron (Hooper and Marder 1987), we modeled the presence of neuromodulatory inputs in the PD neuron not by adding Iproc, but as an increase in the maximal conductance of the Ca2+ currents (Table 2), which have been shown to be targets of modulation in this neuron (Johnson et al. 2003).
The mathematical description for the axial currents Iaxial and the gap-junctional currents Igap is the same. For each model neuron the axial current in the S/N compartment IaxialS/N is the product of an axial conductance and the difference of the membrane potential in the A and S/N compartments
Similarly, Igap is the product of a gap-junctional conductance and the membrane voltage difference of the 2 S/N compartments
Coupling currents in coupled compartments were symmetrical: IaxialS/N = −IaxialA and IgapPD = −IgapAB.
To distinguish between weak bursting and irregular spiking, for both experimental data and simulation results, bursting was considered weak when the amplitude of the slow wave oscillation was between 2 and 4 mV and either the number of spikes per burst was <3 or the oscillation period was irregular. When the slow wave was <2 mV in amplitude the behavior was labeled as spiking.
Simulations were performed on a PC with the Linux platform using the network software developed in the Nadim laboratory. We used a 4th-order Runge–Kutta numerical integration method with time steps of 0.05 and 0.01 ms.
RESULTS
The behavior of the AB–PD network in response to current injection
To tune the qualitative behavior of the model to match that of the biological network, we used a dynamic perturbation of the biological AB–PD oscillator after synaptic isolation from other STG neurons. By injecting different values of constant DC current into the AB or PD neurons, the activity of these neurons was changed from quiescent to bursting to tonic firing in different conditions. We first examined the activity of these neurons with the neuromodulatory inputs to the STG intact.
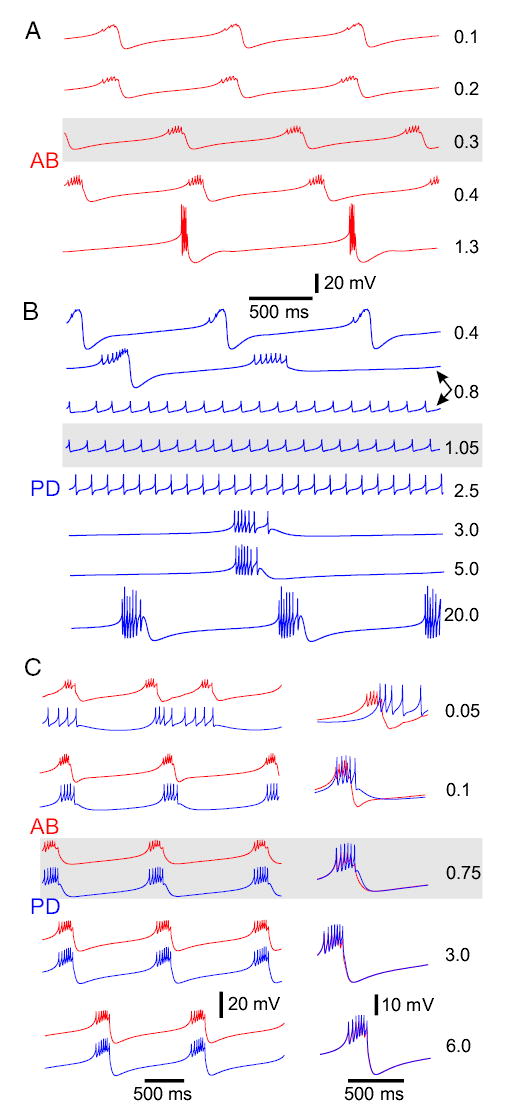
A comparison between the behavior of the biological neurons (left traces) and the model (right traces) is shown in Fig. 1. In each panel, the gray background illustrates the traces with 0 current injection, and depolarizing and hyperpolarizing DC current was injected in increasing amounts. In all cases shown, the model network mimicked the activity of the biological neurons.
FIG. 1.
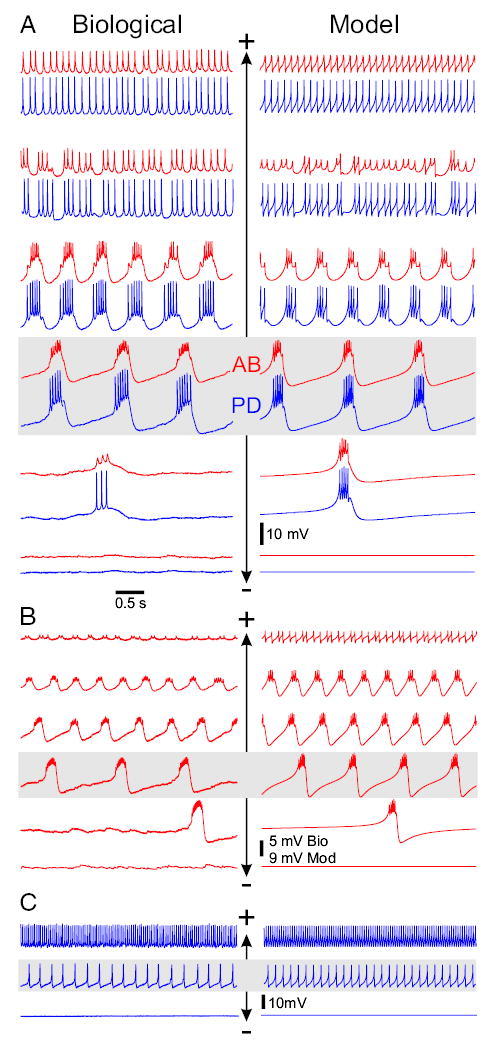
Activity of the anterior burster (AB) and pyloric dilator (PD) neurons in response to current injection with intact modulatory inputs to the stomatogastric ganglion (STG). Gray background shows 0 current injection, + denotes positive current injection, and − denotes negative current injection. A: voltage traces of the biological (left) AB (red) and PD (blue) neurons show in-phase bursting oscillations that become faster with increasing current injection in the AB neuron. This behavior is mimicked by the model neurons (right). Iext in nA from top: Biological, 5, 3, 0.5, 0, −8, −8.5; Model, 5, 1.1, 0.8, 0, −0.22, −0.3. Minimum Vm in mV from top: Biological AB, 36, −41, −49, −51, −85, −86; Biological PD, −41, −42, −45, −46, −53, −54; Model AB, −45.2, −47.5, −48, −53, −52.4, −51; Model PD, −46, −46.5, −48.1, −53, −52.4, −51. Model pacemaker has a frequency range of 0.22 to 1.7 Hz. B: voltage traces of the synaptically isolated biological (left) and model (right) AB neurons show bursting oscillations that become faster and smaller in amplitude with injected current. Iext in nA from top: Biological, 33, 12, 6, 0, −3, −5; Model: 8, 1.0, 0.3, 0, −0.19, −0.27. Minimum Vm of the AB neuron in mV from top: Biological, 27, −17, −36, −60, −66, −76; Model, −44.6, −51, −54.8, −58.4, −59.2, −52.75. Model AB neuron has a frequency range of 0.24 to 3.4 Hz. C: voltage traces from the isolated biological (left) and model (right) PD neurons show tonic spiking activity that increases in frequency with current injection. Iext in nA from top: Biological, 15, 0, −1; Model: 12, 0, −0.3. Minimum Vm of the PD neuron in mV from top: Biological, −27, −50, −53; Model, −44, −46.5, −53. In the model, current injection runs were started at 0 nA with subsequent steps of 0.1 or 0.2 nA that lasted 20 to 30 s ≤8 nA (in A), 1.5 nA (in B), or 12 nA (in C). Current was then reset to 0 nA and subsequently decreased to −0.3 nA in steps of −0.01 nA or −0.02 nA.
In the intact network (Fig. 1A), with 0 current injection, the AB and PD neurons showed in-phase rhythmic bursting activity. Hyperpolarization of the AB neuron caused the bursting cycle to slow down and the amplitude of the oscillations to decrease. With sufficient hyperpolarization, the neurons became quiescent. Depolarization of the AB neuron increased the oscillation frequency and decreased its amplitude. The electrically coupled model AB–PD neurons showed behavior similar to that of the biological neurons (Fig. 1A).
The isolated biological AB neuron always showed bursting oscillations and showed a similar response with the oscillation frequency increasing as the depolarization was increased (Fig. 1B, left). However, in contrast with the intact AB–PD network, the amplitude of oscillations consistently decreased as a function of injected current. The isolated AB neuron typically did not exhibit pure tonic firing with large injected DC current. Instead it produced high-frequency and low-amplitude bursts of 2–3 action potentials (Fig. 1B, left top trace). The isolated model AB neuron showed behavior similar to that of the biological neuron.
In contrast to the isolated AB neuron, isolated biological PD neurons typically showed only tonic spiking activity (Fig. 1C, left middle trace) whose frequency increased with injected current. Injection of negative current silenced this activity. In some cases (n = 2 of 5), the isolated PD neuron showed weak (small-amplitude and irregular) rhythmic bursting activity that turned into tonic spiking with positive current injection (data not shown). Again, the model PD neuron (Fig. 1C, right) showed behavior similar to that of the biological neuron.
Removing the neuromodulatory inputs to the STG drastically changes the activity of the AB–PD network (Bal et al. 1988; Miller and Selverston 1982; Selverston and Miller 1980). The activity of the AB–PD kernel in the absence of neuromodulatory inputs is shown in Fig. 2. Without current injection the biological AB–PD neurons were typically quiescent (Fig. 2, bottom left panel, gray) or weakly tonically active (not shown). Injection of positive DC current caused these neurons to produce weak bursting oscillations with 1–3 spikes per burst. The oscillation frequency increased and its amplitude decreased with injected current. Removal of the modulatory currents in the model AB and PD neurons (Fig. 2, right) resulted in a model AB–PD kernel that showed behavior similar to that of the biological coupled AB–PD neurons.
FIG. 2.
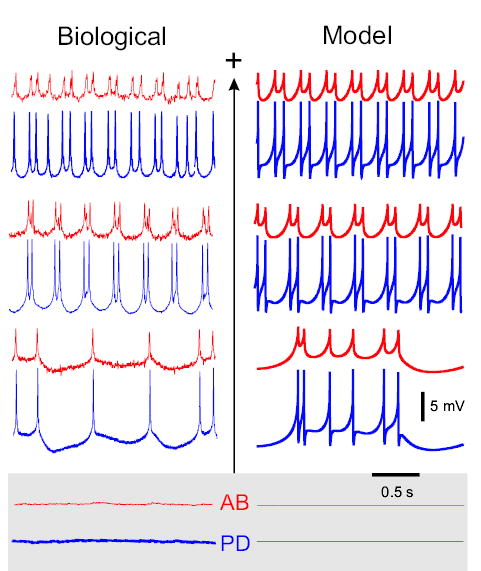
Activity of the AB and PD neurons in response to current injection in the AB neuron in the absence of modulatory input. Biological AB (red) and PD (blue) neurons are quiescent with no current injections (gray background; left traces). Positive DC current injection (+) in the biological AB neuron evokes in-phase bursting oscillations that become faster with increasing current levels (left). This behavior is reproduced by the model neurons (right). Iext in nA from top: Biological, 10, 6, 1, 0; Model, 1, 0.6, 0.2, 0. Minimum Vm in mV from top: Biological AB neuron, −12, −35, −66, −77; Biological PD neuron, −51, −52, −55, −56; Model AB neuron, −45.3, −45.8, −48.2, −49.7; Model PD neuron, −47.7, −47.7, −48.5, −49.8. In the model, current injection runs were started at 0 nA, with subsequent steps of 0.2 to ≤2 nA. Each run was 30 s.
In the absence of neuromodulatory inputs, the isolated biological AB neuron was silent (n = 4 of 5). (In one preparation, however, small-amplitude oscillations were recorded in the isolated AB neuron.) Positive current injection produced very weak bursts with 1–2 spikes per burst (n = 5, data not shown). The isolated PD neuron showed tonic activity very similar to its activity in the presence of neuromodulatory inputs (n = 3, data not shown).
Figure 3A shows a qualitative comparison of the waveforms of the AB neuron when coupled to the PD neurons (thin trace) and after isolation from the PD neurons (thick trace). The amplitude and number of spikes/burst were measured in 5 preparations (5 cycles each), and consistent with the data shown in Fig. 3A, the spike amplitude per burst increased by an average of 142% (SD 64%), whereas the number of spikes per burst decreased by an average of 45% (SD 11%). Figure 3B shows a similar comparison of the waveforms for the model AB neuron, in isolation (thick trace) and when coupled to the model PD neuron (thin trace). The model AB neuron showed a decrease in burst amplitude and increase in period when coupled to the model PD neuron, as well as an increase in the burst duration and the number of spikes per burst. These changes were consistent with the experimental results. These data show that the amplitude of the AB neuron slow wave is significantly decreased by its coupling to the PD neurons.
FIG. 3.
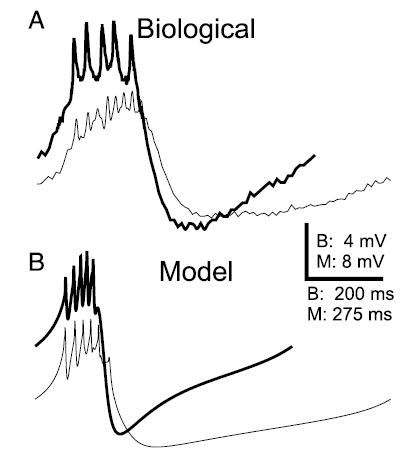
Membrane potential waveform of the AB neuron is changed by electrical coupling to the PD neuron. A: intracellular recordings show the waveforms of an AB neuron when electrically coupled (thin trace) to the PD neuron and when isolated (thick trace). On isolation, the average spike amplitude increased and the average spike number per burst decreased. Minimum Vm (in mV): −61.3 for coupled and −62.9 for isolated AB neuron. B: a comparison of the waveforms in the model AB neuron when it is coupled to the PD neuron (thin trace) and when isolated (thick trace) shows that the isolated AB neuron waveform has a larger amplitude and shorter period, as in the biological neuron. Spike number per burst also decreased. Minimum Vm (in mV): −53.5 for coupled and −58.4 for isolated AB neuron.
Understanding the network model behavior as a function of its components
The AB–PD neuron model described in the previous section has a number of properties. We now describe how these properties contribute to the behavior of the model, and use these to make some more general statements about networks in which nonidentical neurons are electrically coupled.
THE TWO COMPARTMENTS OF THE MODEL NEURONS
There have been previous models that were inspired by the pyloric pacemaker neurons, focusing on the effect of electrical coupling on the frequency of an oscillator to a second neuron that was silent or tonically active (Kepler et al. 1990), and on the effects on frequency and burst duration of electrically coupled 2-dimensional oscillators (Abbott et al. 1991; Meunier 1992). These studies provided valuable insights into the nature of electrical coupling, but were not meant to reproduce the dynamic behavior of the pyloric pacemaker neurons. To build a biophysically plausible model that accounted for the specific intrinsic properties of the individual neurons, we based our model on voltage-clamp descriptions of the ionic currents in cultured STG neurons (Turrigiano et al. 1995). We then adjusted the parameters of the ionic currents, as described later in RESULTS, to reproduce the behavior of the biological pacemaker neurons, both in isolation and as a group.
Figure 4A shows a schematic representation of the segregation of the currents in the 2 compartments in the model neurons. The currents responsible for action potential generation were separated from those responsible for the generation of slow oscillations (approximately 1 Hz; see Fig. 4B) for the following reasons: 1) Pyloric neurons produce slow-wave voltage oscillations in the absence of action potentials (Raper 1979). 2) Under some modulatory conditions (such as high-frequency stimulation of the inferior ventricular nerve, a modulatory nerve that connects the brain to the stomatogastric nervous system), the PD neuron is able to produce long, slow bursts (Eisen and Marder 1984; Miller and Selverston 1982).
FIG. 4.
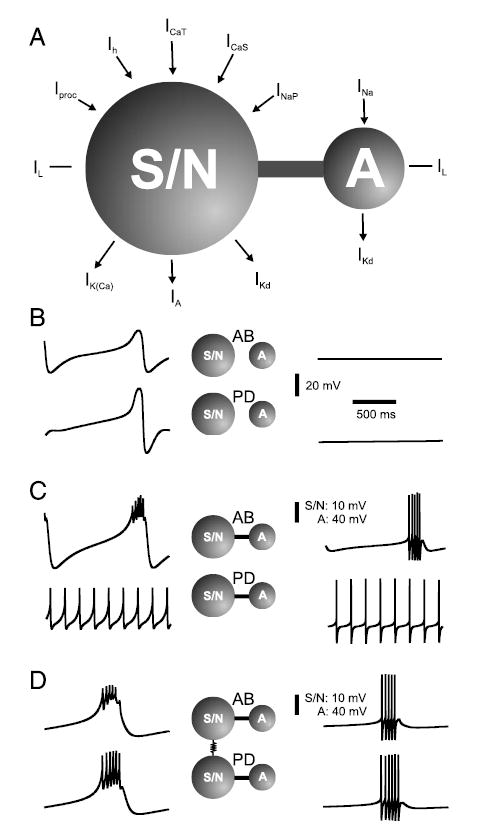
Compartmentalization of the model neurons. A: schematic representation of the distribution of intrinsic currents in the model neurons. Ionic currents responsible for action potential generation were placed in the “A” (axon) compartment. Ionic currents underlying the generation of slow oscillations were placed in the S/N (soma-primary neurite) compartment. Presence of anterior inputs was modeled with a voltage-gated inward current Iproc in the model AB neuron, and with larger calcium currents ICaS and ICaT in the model PD neuron. In B, C, and D, the top voltage traces correspond to the AB neuron and the bottom voltage traces to the PD neuron; the left traces show the membrane potential of the S/N compartments, whereas those on the right show the A compartments. B: activity of each compartment is shown in isolation, with parameters as described in Table 2. Lowest voltage values are for the AB neuron: −63.5 mV (S/N), −60 mV (A); for the PD neuron: −73 mV (S/N), −57.5 mV (A). C: each S/N compartment shown in B is joined to the corresponding A compartment, with axial conductances as in Table 2. Resulting input resistances were 14.8 MΩ (AB) and 6.9 MΩ (PD). Lowest voltage values are for the AB neuron: −58.4 mV (S/N), −74 mV (A); for the PD neuron: −46.5 mV (S/N), −72.5 mV (A). D: 2 S/N compartments shown in C are electrically coupled to simulate a gap junction with maximal conductance as in Table 2. Two model neurons now burst in-phase. Lowest voltage values are for the AB neuron: −53.5 mV (S/N), −74 mV (A); for the PD neuron: −53.5 mV (S/N), −73 mV (A).
In each model neuron, the action potentials were generated in the axon (A) compartment by fast sodium INa and delayed-rectifier potassium IKd currents with Hodgkin–Huxley type dynamics. The compartments labeled as S/N represent the soma and primary neurite. The A compartment was excitable, but in isolation from the S/N compartment remained quiescent (Fig. 4B). In the S/N compartment, the intrinsic outward currents were a delayed-rectifier IKd, a calcium-dependent IKCa, and a transient IA potassium current. The inward currents consisted of a transient ICaT and a persistent ICaS calcium current, a persistent sodium current INaP, and a hyperpolarization-activated inward current Ih. To model the effect of descending modulatory inputs, a voltage-gated inward current (such as the one activated by the neuropeptide proctolin) Iproc was added to the S/N compartment of the model AB neuron (Fig. 4A) (Hooper and Marder 1987; Marder et al. 1986; Swenson and Marder 2000). In the case of the isolated biological PD neuron in P. interruptus, however, proctolin has been reported to show no noticeable effect (Hooper and Marder 1987). Thus the presence of modulatory inputs in the PD neuron was modeled as a slight increase in the conductances of the 2 Ca2+ currents (Johnson et al. 2003). Together with the leak current IL, the currents in the S/N compartments generated large-amplitude (about 35 mV) slow oscillations with a frequency of about 1 Hz (Fig. 4B). In the absence of IKCa, the membrane potential remained in a depolarized steady state (not shown).
Figure 4C shows the results of coupling each of the S/N compartments with its respective A compartment, with axial conductances as shown in Table 2. In the model AB neuron, the electrical interaction between the excitable A compartment and the intrinsically oscillatory S/N compartment produced intrinsic bursting activity (Fig. 4C, top panel). In contrast, in the case of the PD model neuron (Fig. 4C, bottom panel), the electrical interaction between the excitable A compartment and the intrinsically oscillatory S/N compartment produced tonic spiking activity (see following text). The electrical synapse between the AB and the PD neurons was modeled by coupling the 2 S/N compartments (gap-junctional conductances as in Table 2). This coupling caused the PD neuron to burst in-phase with the AB neuron (Fig. 4D), as seen in the biological network.
THE ROLES OF AXIAL AND GAP-JUNCTIONAL CONDUCTANCES
Figure 5, A and B show the isolated AB and isolated PD model neurons, respectively, as the axial conductance between their 2 compartments was increased from top to bottom. The gray background shows the “reference” model with parameters as in Tables 1 and 2. When the axial conductance between the S/N and A compartments of the isolated AB neuron was weak, the activity of the S/N compartment of this neuron was very similar to that of its isolated S/N compartment (Fig. 5A, top trace). As the axial conductance was increased, both the spike amplitude and the number of spikes per burst consistently increased. In contrast, the AB neuron burst amplitude and period behaved nonmonotonically: they initially decreased and then increased. Increasing the axial conductance value to 1.3 μS served to merge the S/N and A compartments of the model AB neuron and effectively turn it into a one-compartment bursting neuron (Fig. 5A, bottom trace). Note that, in this case, the amplitude of the action potentials was considerably larger. (This increase occurred as a fairly sudden transition as the axial conductance was increased from 0.4 to 0.5 μS; not shown). Irrespective of the strength of the axial coupling, the AB neuron always remained an intrinsic burster, although as the coupling was increased more than 0.4 μS the waveform of the biological AB neuron was lost.
FIG. 5.
Effects of varying the axial and gap-junctional conductances. Gray boxes show the activity of the “reference” model. A: behavior of the S/N compartment of the isolated model AB neuron as the axial coupling between the S/N and A compartments is increased. Values (in μS) shown to the right are the maximal conductance of the axial current. Most hyperpolarized voltages in each trace are, from top (in mV): −61, −58.5, −58.4, −59.5, and −69. B: behavior of the S/N compartment of the isolated model PD neuron as the axial coupling between the S/N and A compartments is increased. Values (in μS) shown to the right are the maximal conductance of the axial current; note that there is bistability at 0.8 μS. There was no change in the behavior of the neurons when couplings larger than those shown were used. Most hyperpolarized voltages are (from top to bottom in mV): −71, −67.8, −46, −46.5, −48.5, −52, −55, and −64. C: behavior of the pacemaker AB–PD network as the gap-junctional conductance is increased. Red traces correspond to the AB neuron, the blue traces to the PD neuron. Traces are superimposed on the right to allow a direct comparison of the waveforms. Values (in μS) shown to the right are the gap junction conductances. Most hyperpolarized voltages are (from top to bottom in mV): −52.6, −54.7, −53.5, −57, and −58. In all cases, the simulations were started from the “reference” AB–PD model (Table 2), and the conductance of interest was changed in increments or decrements of 0.05 μS, with each run using as initial conditions the last point of the previous run.
In contrast, as the axial conductance between the 2 compartments of the model isolated PD neuron was increased (Fig. 5B), there was a range of coupling values (0.9 to 2.5 μS) for which it was not able to produce intrinsic bursting oscillations. For small coupling values, small to medium-size spikes rode on top of the slow-wave oscillation of the S/N compartment. As the axial conductance increased, the coupling current had a hyperpolarizing effect on the burst phase of the S/N compartment that eventually prevented the S/N compartment from producing slow oscillations. The S/N compartment, however, could still induce spiking in the A compartment and thus the neuron spiked tonically. Both irregular bursting and tonic spiking could be obtained for the same conductance strength, as is shown in the second and third traces of Fig. 5B. Further increasing the axial conductance served to increase the spike frequency (and amplitude) and to subsequently cause enough calcium ion accumulation to activate IKCa and thus restore bursting. For large axial coupling (in excess of 20 μS), the model was effectively a single-compartment burster with overshooting spikes (Fig. 5B, bottom trace).
Figure 5C shows the behavior of the model AB–PD pacemaker group as the strength of the electrical coupling between the 2 neurons was increased from top to bottom by varying the gap-junctional conductance values. The gray background shows the “reference” model with parameters as in Tables 1 and 2. For very small coupling, the AB neuron produced irregular bursting and, although the PD neuron produced long, small-amplitude bursts, it was not able to fire in phase with the AB neuron (Fig. 5C, top panel). As the coupling strength increased, both model neurons produced regular bursts, but the PD neuron burst started slightly after and lasted longer than the AB neuron burst. In this case, the spikes of the 2 neurons occurred out of phase (Fig. 5C, second trace). Further increasing the coupling strength caused the slow-wave oscillation of the neurons to become better aligned, the number of spikes per burst to increase, and the spikes (although not completely synchronized) to occur almost in phase (Fig. 5C, superimposed traces in middle panel). For the waveforms of the AB and PD neurons to be almost indistinguishable from each other, the coupling strength needed to be further increased, as shown in the bottom trace in Fig. 5C. Remarkably, for more than a 50-fold range of gap-junctional conductance values (0.1– 6 μS) the coupled AB–PD pacemaker group produced qualitatively similar synchronous bursting oscillations. In the following subsection, we show that this need not be the case if the model neurons involved are one-compartment neurons.
TWO-COMPARTMENT MODELS PROVIDE A MORE ROBUST BURSTING MECHANISM FOR THE PACEMAKER NETWORK
Thus far, we have used our 2-compartment per neuron model to show that it is possible for an intrinsically bursting neuron to drive a tonically spiking neuron to oscillate in synchrony with it for a wide range of coupling strengths. We now address the question of whether it is possible to obtain similar results with one-compartment model neurons. To answer this question, we built several AB–PD networks, and assayed the network oscillations as the gap-junctional strength was varied (Fig. 6). We used 2 distinct versions of the model AB and PD neurons. These were either the “reference” model neurons (AB and PD) or slightly modified versions of these neurons (AB and PD). The S/N compartment of the PD neuron was intrinsically oscillatory, as in Fig. 4B, whereas that of PD lacked IKCa and thus PD had no intrinsic ability to oscillate (and was quiescent). The AB neuron had a smaller transient calcium current ICaT (gCaT = 42 μS) than that of the AB neuron, which decreased the slow oscillation amplitude. This reduction in gCaT was done so that the one-compartment (see following text) AB neuron would have a slow-wave oscillation similar to that of the 2-compartment reference AB neuron.
FIG. 6.
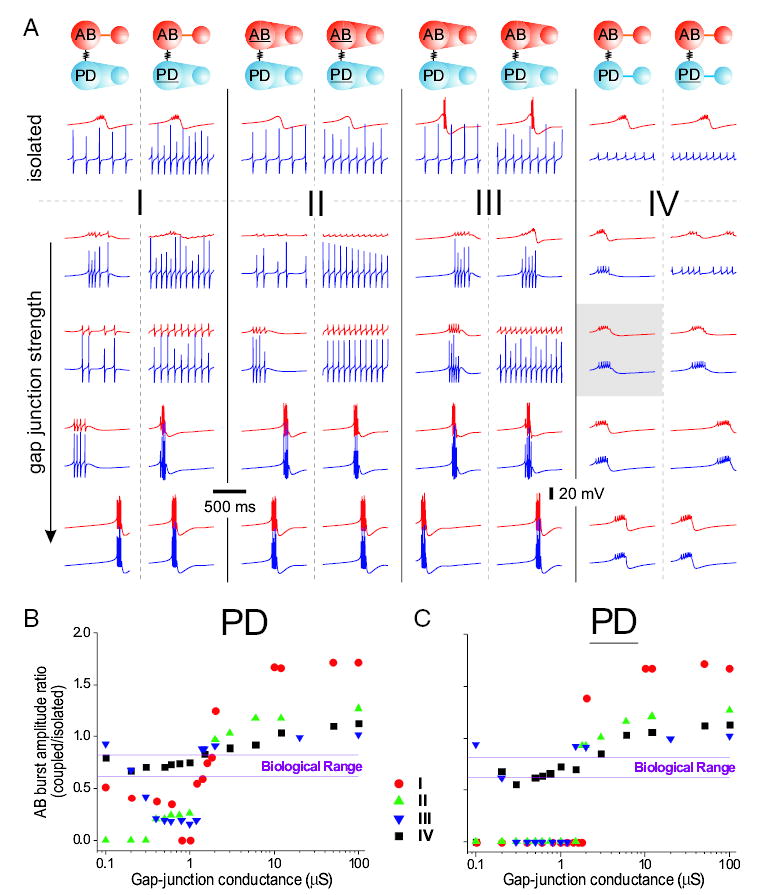
Comparison of the behavior of different AB–PD networks constructed from one- and 2-compartment model neurons. A: each column shows examples of outputs from a given network as the maximal conductance of the gap junction is increased from top to bottom. Red voltage traces correspond to the model AB neuron and blue traces to the model PD neuron. Diagram on top of each column describes the type of model neuron used. Two-compartment models are shown with a thin line connecting the S/N and A compartments; one-compartment model neurons are shown with whole region between the 2 compartments shaded. Each of the 2 columns in Cases I–IV is built with the same AB neuron but 2 different PD neurons. Gray box shows the activity of the “reference” AB–PD network. Isolated neurons differ from the maximal conductances shown in Table 2 as follows. Case I AB: no difference; Case II AB gCaT = 42 μS and gaxial = 100 μS; Case III AB: gaxial = 100 μS; Case IV AB: no difference. Cases I, II, and III model PD neurons: gNa = 2500 μS in the A compartment and gaxial = 100 μS. Cases I, II, and III model PD neurons: gNa = 2500 μS in the A compartment, gKCa = 0 and gaxial = 500 μS. Case IV PD: no difference; Case IV PD: gKCa = 0. Values for the gap-junctional conductances are (from top in μS): Case I AB–PD: 0, 0.4, 1.0, 1.6, 100. Case I AB–PD: 0, 0.1, 1.6, 2, 100. Case II AB–PD: 0, 0.2, 0.75, 3, 100. Case II AB–PD: 0, 0.2, 1.5, 3, 100. Case III AB–PD: 0.4, 1.2, 2,100. Case III AB–PD: 0, 0.2, 0.8, 1.5, 100. Case IV: 0, 0.1, 0.75, 3, 100. Most hyperpolarized voltage values for the traces are (from top in mV). Case I AB–PD, AB: −58.2, −51, −52, −53, −69; PD: −71.2, −71, −70, −68, −69. Case I AB–PD, AB: −58.2, −50.2, −54.5, −68, −62.7, −68; PD: −73, −73, −70, −73.2, −68. Case II AB–PD, AB: −58.4, −45.8, −49.4, −63.6, −69; PD: −71.2, −71.2, −70, −71.5, −69. Case II AB–PD, AB: −58.4, −46.4, −51.6, −63.2, −69; PD: −72, −71.8, −69, −71, −69. Case III AB–PD, AB: −68, −51.6, −53.5, −65.2, −68.8; PD: −71.2, −71, −69.4, −72, −68.8. Case III AB–PD, AB: −68, −58.2, −49.2, −65.5, −68.8; PD: −72, −71.5, −70, −71.2, −68.8. Case IV AB–PD, AB: −58.2, −54.5, −52.9, −53.7, −59.9; PD: −71.2, −51.2, −53, −56.7, −59.9. Case IV AB–PD, AB: −58.2, −49.8, −51.5, −55.8, −59.5; PD: −72, −47, −51.6, −55.8, −59.5. B and C: ratio of the AB neuron burst amplitude when coupled to the PD neuron to the burst amplitude of the isolated AB neuron shown as a function of the maximal gap-junctional conductance. A zero ratio corresponds to a coupled AB neuron that produces tonic spikes instead of bursting oscillations. B: plots of the burst amplitude ratios are shown for both the AB–PD network (B) and the AB–PD network (C) in Cases I–IV.
We then addressed the significance of compartmentalization by comparing the one- and 2-compartment model neurons. The one-compartment neurons were obtained by increasing (≥100-fold) the axial conductance between the A and S/N compartments, thus effectively collapsing the 2 compartments. (These are shown schematically in Fig. 6A with the whole region between the 2 compartments shaded.) The networks were divided into 4 cases (I–IV) and in each case, we compared the coupling of the AB (or AB) neuron to either the PD or the PD neuron, resulting in a total of 8 networks (Fig. 6A). The behavior of the “reference” AB–PD network is highlighted in the gray box in Fig. 6A. The case of the 2-compartment AB was similar to Case I and it is not shown.
To measure the electrical “load” that the PD neuron placed on the AB neuron, the burst amplitudes of the coupled and isolated AB neurons (see Fig. 6A) were compared for the networks that produced synchronous bursting. When the network output was tonic, the ratio of the burst amplitudes was set to zero. The ratios as a function of the gap-junctional conductance were plotted for Cases I–IV (Fig. 6, B and C). These ratios were compared with the range (0.65– 0.85) calculated from the biological AB neuron as in the experiment shown in Fig. 3A.
In Case I, we used the “reference” 2-compartment model AB neuron and coupled it to either a one-compartment model PD (Fig. 6A, left column) or model PD neuron (Fig. 6A, right column). In contrast to PD, PD was able to burst in synchrony with the AB neuron for all coupling strengths (Fig. 6A, Case I). However, the burst amplitude of the AB neuron increased as the coupling strength was increased, irrespective of whether it was coupled to PD or PD (Fig. 6A, Case I). When AB was coupled to PD, the range of gap-junctional conductances for which the burst amplitude ratio remained within the biological range (0.65– 0.85) was approximately 1–2 μS (see Fig. 6A, Case I, left column, fourth panel from top, ggap ≅ 1.6 μS, and Fig. 6B, orange circles). For large coupling conductances (ggap > 2 μS), this AB–PD network output was very similar to that of the 2-compartment AB neuron with large axial coupling (compare Fig. 6A, Case I, left column, bottom panel to Fig. 5A, bottom panel). When the AB neuron was coupled to the PD neuron (Fig. 6A, Case I, right column), the network behavior progressed from tonic spiking for small to moderate coupling conductances to large-amplitude bursting for large coupling conductances (ggap > 2 μS; Fig. 6A, Case I, right panel and Fig. 6C, orange circles).
In Case II, we replaced the 2-compartment AB neuron with the one-compartment AB neuron that had similar slow-wave amplitude of oscillations (compare the top voltage traces in Fig. 6A, Cases I and II). When the model AB neuron was coupled to the one-compartment model PD neuron, this network was able to produce bursting oscillations for only moderate to large coupling strengths (Fig. 6A, Case II, left column). However, the burst amplitude ratios of the coupled to the uncoupled AB neuron calculated as the gap-junctional conductance was increased did not fall within the biological range (Fig. 6B, green triangles), suggesting that the burst amplitudes of AB were either too small or too large. Coupling the AB neuron to the one-compartment PD neuron produced only tonic spiking behavior for all but large coupling strengths, in which case the burst amplitude of AB was again too large (Fig. 6C, green triangles).
In Case III, the burst amplitude of the one-compartment model AB neuron was considerably larger (84%) than that of the “reference” AB neuron. Even with this larger-amplitude oscillation in the model AB neuron, however, when it was coupled to the one-compartment model PD (Fig. 6B, blue inverted triangles) or PD (Fig. 6C, blue inverted triangles) neuron, the range of gap-junctional conductances for which the burst amplitude ratio of the AB neuron was adequate was very small. As in Cases I and II, with large coupling strengths, the network behavior was very similar to that of the 2-compartment AB neuron with a large axial conductance (compare the bottom panel of Fig. 5A to the bottom panels of the first 6 columns in Fig. 6A). From these results, we suggest that a one-compartment model PD (and PD) neuron behaves as an additional “axon” on the AB oscillator.
In contrast, as shown in Case IV, the 2-compartment per neuron networks were able to function like the biological pacemaker for a wider range of coupling strengths (Fig. 6A). The burst amplitude ratio of the coupled to the uncoupled model AB neuron remained in the biological range for a much wider range of gap-junctional conductances than in any of the previous cases (see Fig. 6, B and C, black squares). However, similar to Cases I–III, large coupling strengths increased the burst amplitude of the AB neuron to values that were beyond the biological range. The burst durations in Case IV remained stable for all coupling strengths (21–38 ms) as opposed to the networks with one-compartment neurons, in which the burst durations shortened for large coupling strengths (10–15 ms). A similar shortening of the burst duration occurred in the isolated model AB neuron when the axial coupling between its 2 compartments was large (see Fig. 5A, bottom trace). This is consistent with our earlier suggestion, based on burst amplitudes, that the one-compartment model PD (and PD) neuron behaves as an additional “axon” on the AB oscillator.
Functional consequences of electrically coupling two identical and two distinct neurons
So far we showed that compartmentalization provides a reliable mechanism for the model neurons to produce in-phase bursts when they are electrically coupled. We then proceeded to examine the functional consequences of coupling identical or different neurons on bursting oscillations. We did this by comparing a model AB–AB network to the reference model AB–PD network and to the isolated AB neuron. We assayed differences among these models by measuring the range of oscillation periods each model produced in response to DC current injection (Fig. 7). For each value of the gap-junctional conductance, increasingly larger amounts of hyper- or depolarizing DC current were injected in the S/N compartment of one of the coupled neurons until the network became silent or produced irregular bursts or tonic activity.
FIG. 7.
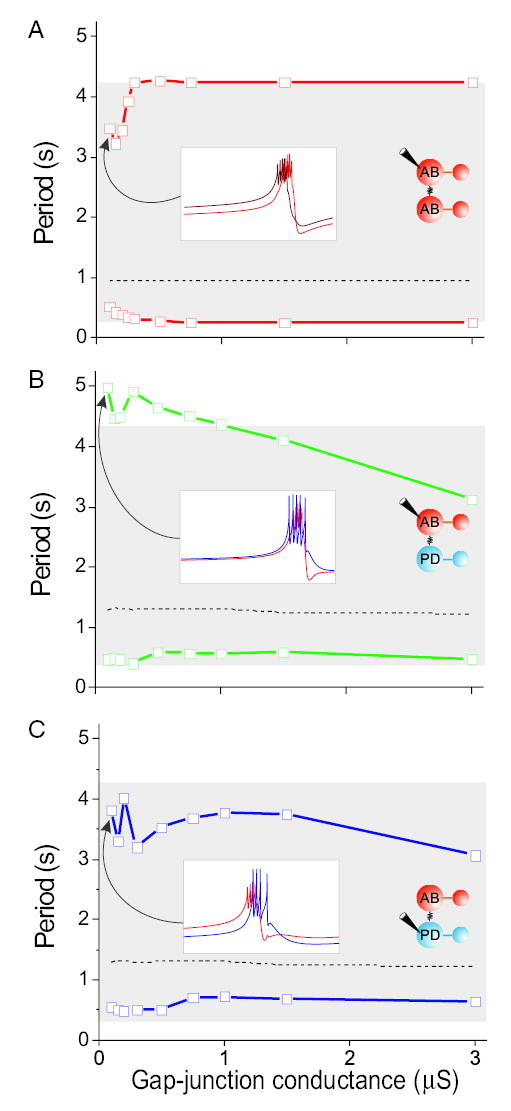
Oscillation period range of a model AB–AB network and the model AB–PD network as a function of the gap-junctional strength (in μS). Burst period range was obtained by DC current injection in the AB neuron (A, B) or the PD neuron (C), as depicted in the inset schematic network diagrams. Dashed curve represents no current injection; the top curve corresponds to the longest possible period that the network produced with hyperpolarizing current injection before becoming quiescent; the bottom curve represents the shortest period that the network produced with depolarizing current injection before the bursts became irregular or changed to tonic spiking. Gray area shows the burst period range of the isolated AB neuron. White insets show 2 s long voltage traces of the coupled neurons for a coupling conductance of 0.1 μS and the largest hyperpolarizing current injection. Voltage in the insets is from −60 to −30 mV. A: an AB–AB model network cannot oscillate with periods longer than those of an isolated AB model neuron. For small coupling conductances (−0.3 μS) its period range was smaller than that of the isolated AB neuron. Inset: 2 phase-locked AB neurons when hyperpolarizing current (I = −0.41 nA) was applied to one of them (lighter trace). B: when current is injected into the model AB neuron, for small to moderate coupling conductance the AB–PD network can produce slower (but not faster) oscillations than the isolated AB neuron. Inset: phase-locked bursting with the PD neuron bursting slightly earlier, as hyperpolarizing current (I = −0.23 nA) was injected into the AB neuron. C: when current is injected into the model PD neuron, the AB–PD network period range of oscillations is smaller than that of the isolated AB. Inset: phase-locked bursting, with the AB neuron bursting slightly earlier, as hyperpolarizing current (I = −0.27nA) was injected into the PD neuron. Most hyperpolarized voltages in the insets are (in mV): −56.5 (A), −48.2 (B), and −52.2 (C).
The 2 limits of the oscillation period range produced by the AB–AB network when DC current was applied to one AB neuron are plotted in Fig. 7A. In the absence of current injection (dashed line) for all coupling strengths the bursting oscillation produced by each of the coupled AB neurons was indistinguishable from each other and from those of the isolated model AB neuron. However, the asymmetry introduced by injecting DC current into one of the 2 identical AB neurons when they were weakly coupled did not allow them to completely synchronize but instead caused them to become phase-locked, as shown in the inset of Fig. 7A (ggap = 0.1 μS). The AB neuron that received the hyperpolarizing DC input (Fig. 7A, inset, lighter red trace) burst after its coupled twin neuron. Note that when the 2 identical AB neurons are completely in phase, Igap = 0 (not shown). In contrast, the slightly out of phase oscillation of the coupled AB neurons results in a nonzero Igap, thus producing a load on the oscillation of each neuron. As a result, for weak coupling strengths (ggap < 0.3 μS), the period range of the AB–AB network was actually smaller than that of the isolated AB neuron (period range of isolated AB marked with gray area). As the gap-junctional conductance was increased, however, the period range of the AB–AB network approached that of the isolated AB neuron until they became identical for ggap > 15 μS (not shown). For all coupling strengths shown, the hyperpolarizing DC current injection that caused the coupled AB neuron to become quiescent was 100% more than the current for the isolated AB neuron. In contrast, the minimum depolarizing DC current that caused the coupled AB neuron to produce tonic spiking, compared with the current for the isolated AB neuron, increased from 31% (at ggap = 0.1 μS) to 315% (at ggap = 3 μS) as the gap-junctional conductance was increased.
Figure 7B shows that with small to moderate gap-junctional conductances, the AB–PD network could oscillate with longer periods (≤18%) than the isolated AB neuron. The inset in Fig. 7B shows simultaneous voltage traces of weakly coupled (ggap = 0.1 μS) model AB and PD neurons when the AB neuron was hyperpolarized (note that the 2 neurons are more in phase here than those shown in the other 2 insets of Fig. 7). For larger coupling strength (ggap = 3 μS), the longest period that the coupled AB–PD network produced was 26% smaller than that produced by the isolated AB neuron (Fig. 7B) and decreased ≤46% for even larger coupling (ggap = 100 μS; not shown). For the range of coupling strengths shown in Fig. 7B, the hyperpolarizing DC current necessary to silence the coupled AB–PD network was 15% more than the current for the isolated AB neuron, whereas the depolarizing DC current necessary for transition to tonic spiking was never more than 50% of the current for the isolated AB neuron. Taken together, these results suggest that, for moderate coupling strengths, the presence of the PD neuron broadens the period range of the AB–PD network to encompass larger periods (≤5 s) as DC current is injected into the AB neuron, whereas it continues to buffer the activity of the AB neuron from hyperpolarizing inputs.
When DC current was injected into the PD neuron, the period range of the AB–PD network was smaller than that of the isolated AB neuron for all coupling strengths (Fig. 7C). The inset of Fig. 7C (ggap = 0.1 μS) illustrates that for small coupling strengths, the injection of hyperpolarizing current into the model PD neuron was more effective in disrupting synchronous bursting of the AB–PD network (the AB neuron fired slightly earlier than the PD neuron) than current injection into the model AB neuron (compare with inset of Fig. 7B). For small to moderate coupling strengths, hyperpolarizing current injection into the PD neuron prevented the network from oscillating as slowly as it would if current were injected into AB. As the gap-junctional conductance was increased (Fig. 7, B and C), the difference in oscillation range as a consequence of current injection into either the AB or PD neuron slowly diminished, and eventually the oscillation ranges became identical (ggap = 100 μS, not shown). For the range of gap-junctional conductances shown in Fig. 7C, the amount of hyperpolarizing DC current (injected in the PD neuron) that caused the AB–PD network to become silent was 15 to 35% more than the current for the isolated AB neuron. Thus, similar to the case shown in Fig. 7B, the presence of the model PD neuron buffered the AB–PD network from hyperpolarizing inputs. However, in this case, the model AB–PD network was able to tolerate only 10 to 24% of the amount of depolarizing current that the isolated AB neuron would before transitioning to tonic spiking. These values should be contrasted with the much larger depolarizing current necessary to eliminate bursting in the AB–AB network (Fig. 7A), despite the fact that the PD neuron had a lower input resistance than that of the AB neuron (14.8 MΩ for AB and 6.9 MΩ for PD; see also legend of Fig. 4).
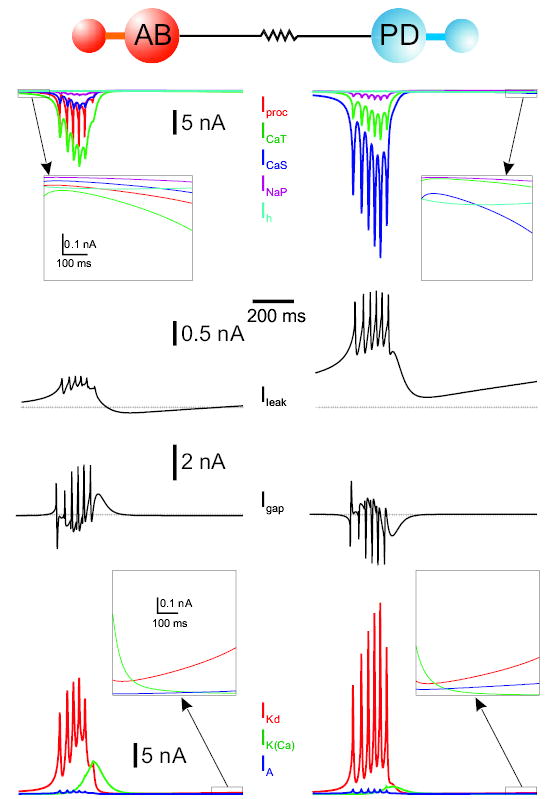
The role of ionic currents in the model and the action of neuromodulators
The biological AB and PD neurons are differentially modulated by a variety of different amines and neuropeptides (Ayali and Harris-Warrick 1999; Flamm and Harris-Warrick 1986; Hooper and Marder 1987; Marder and Eisen 1984a). To provide some insight into the function of differential modulation of 2 electrically coupled but distinct neurons, we examined the time course of activity of the inward (Fig. 8, top panels) and outward (Fig. 8, bottom panels) currents when descending neuromodulatory inputs were present. Variations of the leak current IL (plotted separately in the middle panels of Fig. 8) allow for a comparison of the time course of the membrane potential in all cases because the membrane potential is linearly related to IL (Vm = EL + IL/gL).
FIG. 8.
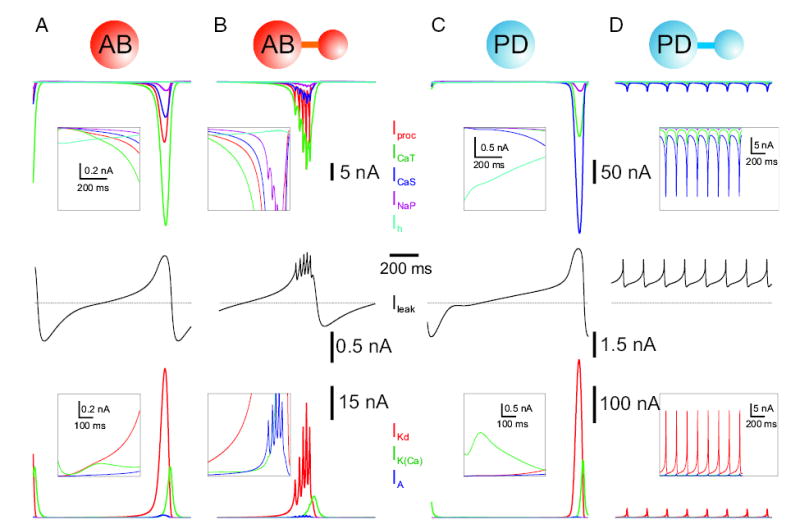
Currents that participate in the approximately 1-Hz oscillations in the isolated S/N compartments, and their behavior in the isolated model neuron. For each model neuron, the leftmost column shows the currents for its isolated S/N compartment, and the rightmost column shows the same currents when the S/N and A compartments are connected. Boxes in the first 3 columns display the currents at a different scale for 600-ms duration, after the first 100 ms of activity. Boxes in the fourth column display enlargements of the full 1,100 ms of activity. Parameters are as in Table 2.
The membrane potential oscillation in the S/N compartment of the model AB neuron was obtained by a balance between the inward and outward currents (Fig. 8A). During the slow initial rise of the membrane potential, the inward currents barely dominated the outward currents until Iproc and ICaS strongly activated to produce a more rapid rise of the membrane potential. This rise was followed by a rapid increase in the outward current IKd with smaller contributions from IA and IKCa. In the most depolarized phase, the outward and inward currents were in balance. At this time, the calcium-activated outward current IKCa increased, first gradually and then rapidly, to produce a decrease in the membrane potential of the neuron, and the cycle repeated. In the absence of IKCa, the membrane potential remained in a depolarized steady state (not shown). For the generation of this large slow-wave voltage oscillation, INaP, Ih, and IA were not necessary: the slow wave was still produced in their absence (not shown). The oscillation period of about 1 s was set mainly by the activation and inactivation time constants of the transient calcium current ICaT and was modulated by the maximal conductances of the leak current IL and the outward currents IKd and IKCa. To obtain oscillations with a frequency around 1 Hz, we had to modify some parameters of the currents described in Turrigiano et al. (1995); the main changes were in the transient calcium current ICaT (activation and inactivation midpoints and their time constants) and in the calcium-dependent potassium current IKCa (activation midpoint).
When the S/N compartment of the AB neuron was coupled to the A compartment (Fig. 8B), an initial slow rise of the membrane potential that was similar to the uncoupled case occurred until the membrane potential was large enough for the axial current to induce the generation of action potentials in the axon. Thus began the active or spiking phase, which subsequently ended by the activation of IKCa. An increase of 33% in the maximal conductance of IKCa decreased both the number of spikes per burst (by 1) and the burst duration, whereas a decrease of 50% in the maximal conductance produced a longer burst duration with one extra spike per burst (not shown). The way in which the transition from bursting to tonic spiking took place as constant depolarizing current was injected into the S/N compartment of the AB neuron depended on the amount of IKCa. Increasing gKCa shortened the burst duration (with no applied current) and maintained bursting with larger amounts of current injection. With smaller gKCa, depolarizing current injection produced a transition to the tonic spiking regime more easily. This was a smooth transition where no irregular bursting or spiking was seen (not shown). Similar transitions from bursting to tonic spiking without intermediate irregular bursting or spiking have been observed in other studies (Shilnikov and Cymbalyuk 2005).
Recall that the neuromodulatory actions on the AB neuron were modeled by adding the ionic current Iproc. When gproc in the model was set to 0 to mimic the removal of neuromodulatory actions on the AB neuron, the large-voltage oscillation in the S/N compartment of the AB neuron was lost (not shown). In this case, a small-voltage oscillation could be obtained by injecting a small constant depolarizing current. This small oscillation was sufficient to trigger a single spike per cycle and the model neuron produced small-amplitude bursts, with only one spike per burst. The amplitude of the oscillation and the number of spikes per burst could be increased by increasing gCaT (not shown).
The currents involved in the generation of the large-amplitude voltage oscillation of the S/N compartment of the isolated PD neuron are shown in Fig. 8. There were several differences between these oscillations and those of the S/N compartment of the model AB neuron. First, in the S/N compartment of the PD neuron, the persistent calcium current ICaS was more prominent than the transient ICaT. Second, the calcium-dependent potassium current IKCa was smaller. Third, the large oscillation as a single stable state depended on the presence of the hyperpolarization-activated current Ih: in its absence there was bistability between a quiescent state and the large oscillation. The oscillation still persisted, however, in the absence of INaP and IA. Figure 8D shows the role of the intrinsic currents in the S/N compartment of the PD neuron when it is coupled to its A compartment. In this case Ih provided enough background depolarization to allow the A compartment to fire continuously. In turn the axial current from the A compartment to the S/N compartment had a hyperpolarizing effect that prevented it from continuing to produce large-amplitude oscillations and thus the 2-compartment neuron spiked tonically. Note that the leak current was now entirely outward because the spiking occurred above the leak reversal potential (−60 mV), and that IKCa played a very small role. In this case the smaller ICaT to ICaS ratio and smaller IKCa (compared with the model AB neuron S/N compartment) were essential to produce the correct output for the isolated PD neuron. If either gCaT was increased by more than 15% or gKCa was increased by 80% the 2-compartment PD neuron became an intrinsic burster (not shown). However, if both gCaT and gCaS were increased by 20%, the 2-compartment coupled PD neuron remained tonically spiking. An increase of more than 50% of gNaP could also turn this spiking neuron into a bursting one, whereas an increase of more than 50% in gA caused it to become quiescent (not shown).
We modeled the removal of the neuromodulatory inputs onto the PD neuron by a slight decrease in the maximal conductance of the calcium currents. The persistent current (gCaS) was decreased by 10%, which served to decrease the spiking frequency by removing some of the background depolarization provided by this current (see Fig. 8D, top panel). The transient current (gCaT) was decreased by 66.6%. This change had the effect of turning the PD neuron into a quiescent cell that spiked tonically with a small depolarizing current injection (not shown). The roles of the intrinsic currents in this case were very similar to those shown in Fig. 8D and thus are not shown. It is interesting to note that the PD model neuron could be built and tuned (by changing gCaT to 20.5 μS and gproc to 35 μS from those shown in Table 2) to have a neuromodulatory current Iproc, as in the AB neuron, and yet produce activity similar to that of the model PD neuron described above (not shown). In this case, the removal of Iproc from the PD neuron would have effects that are similar to those obtained by decreasing the calcium currents (data not shown).
Figure 9 shows the currents in the S/N compartments of the model AB and PD neurons when these 2 compartments were electrically coupled, mimicking the gap junction in the biological network. The electrical coupling current allowed the PD neuron to produce slow, bursting oscillations in phase with the AB neuron. In turn, the coupling current into the S/N compartment of the AB neuron affected the waveform of the AB neuron by diminishing its burst amplitude, lengthening both the burst and the silent phases and thereby increasing its period (see also Fig. 3B). The gap-junctional current in the AB neuron (Fig. 9, left column, third trace from top) was mostly hyperpolarizing during the silent phase and also (at least on average) during the initial part of the burst. This was consistent with the decrease in amplitude of the AB neuron burst, as well as the lengthening of the silent phase. The lengthening of the AB neuron burst phase was mainly attributed to the depolarizing effect from the gap-junctional current later in the burst. The roles of the intrinsic currents of the coupled AB neuron (Fig. 9, left column) are very similar to those of the isolated AB neuron (Fig. 8B). The most noticeable difference between the intrinsic currents of the coupled PD neuron (Fig. 9, right column) and those of its isolated S/N compartment (Fig. 8C) was that the leak current IL in the case of the coupled PD is completely hyperpolarizing because the S/N compartment oscillation was above its leak reversal potential. This difference, however, was not significant because, by decreasing the maximal conductance of the leak current by 31%, the membrane potential oscillation in the coupled PD neuron also hyperpolarized below its leak reversal potential (not shown). In both the isolated S/N compartment of the model PD and the coupled PD neurons, an increase of 24% in the maximal conductance of the leak current IL had the effect of increasing the oscillation period; the increase was 27% in the isolated S/N compartment of the PD neuron and 42% in the coupled PD neuron (not shown). The amplitude of the oscillation, however, was basically not affected by a 24% increase in the maximal conductance of IL in the case of the isolated S/N compartment of the PD neuron, whereas it did decrease in the case of the coupled PD neuron by 2 mV (not shown).
FIG. 9.
Currents in the S/N compartments of the AB–PD pacemaker model network in the presence of modulatory inputs. Boxes show enlargements of 600 ms of activity.
DISCUSSION
The common intuition on the role of gap junctions is that they synchronize the activity of similar neurons. Several modeling and analytical studies have addressed the role that electrical coupling plays in neuronal systems and these studies indicate a more complex role. For example, in networks of identical integrate-and-fire spiking neurons, different activity patterns of the network such as synchronous, asynchronous, and phase-locked modes depend on the spike shape, amplitude, and frequency as well as the strength of the coupling between the neurons (Chow and Kopell 2000). Electrical coupling can extend the parameter range over which initially uncoupled model neurons were able to burst (Komendantov et al. 2004; Sherman and Rinzel 1992). When heterogeneity is introduced in diffusely coupled bursting neurons synchronous behavior can be destabilized (De Vries et al. 1998). However, the right combination of heterogeneous conductances with appropriate coupling strengths in electrically coupled nonoscillator model neurons can produce synchronous oscillatory behavior (Manor et al. 1997).
Chains of strongly diffusively coupled oscillators, each with a distinct intrinsic frequency, can display very long transients before reaching a stationary periodic state in which the frequency is the mean of the individual oscillator frequencies (Medvedev et al. 2003; Wilson and Callaway 2000). Combinations of electrical coupling and chemical synapses could produce yet more complexity in the network output. In a network of electrically coupled neurons that reciprocally inhibit each other, the generation and stabilization of bursting behavior was attributed to the electrical coupling between them (Skinner et al. 1999).
In this study we set out to explore the consequences of electrical coupling between 2 intrinsically distinct neurons. In particular, we focused on electrical coupling between a bursting neuron to a larger, tonic spiking neuron inspired by the pacemaker network of the lobster pyloric central pattern generator. We developed a 2-compartment per neuron network of the pacemaker and used the model to illustrate a variety of neuron and network behaviors arising from electrically coupling very different oscillators.
The AB–PD model and the biological AB–PD pacemaker
We have built a model of the lobster pyloric pacemaker network, consisting of the strongly electrically coupled AB and PD neurons, in which the 2 neurons are modeled as separate cells, taking into account their distinct intrinsic dynamics. Our model captures the qualitative dynamic behavior of the actual network: 1) It has a wide frequency range; 2) the burst amplitude decreases with increasing frequency; 3) as the frequency increases, the number of spikes per burst decrease; 4) there is a transition to tonic spiking in which irregular small bursting and irregular spiking occurs; and 5) with sufficiently high depolarizing current the network produces tonic spiking. Although the evolution from bursting to tonic spiking is qualitatively similar to that of the biological network, our model shows higher sensitivity to hyperpolarizing than to depolarizing current injection compared with the biological neurons. This difference is probably attributable to the specific voltage dependency properties of the currents we used. Our model does not include low-threshold regenerative inward currents because no such current has yet been characterized in the biological AB and PD neurons. The calcium currents have half-maximum potential values at somewhat depolarized values, whereas the calcium-dependent potassium currents are activated at fairly hyperpolarized values. As more measurements of ionic currents from the biological AB and PD neurons become available, the model can be refined to reflect better the intrinsic properties of these pacemaker neurons.
Both neurons were modeled using the same intrinsic currents. The only major differences were the time constants for the inactivation of ICaT and the steady-state activation slope of the calcium-dependent potassium current IKCa (see Table 1). These differences acted to prevent the model PD neuron from bursting in isolation by having a slower inactivation of ICaT and a less-abrupt activation of IKCa. Whether the biological AB and PD neurons express all of the same currents is not known. It is quite possible, however, that these 2 neurons express different ratios of calcium channel types (Johnson et al. 2003) and our modeling results would predict this. In our model, it was necessary that the AB and PD neurons have different ICaT to ICaS conductance ratios, with more of the noninactivating ICaS in the PD neuron.
The AB–PD modeling strategy
In each model neuron, action-potential generation was segregated from other intrinsic currents. In the case of the intrinsically bursting AB neuron, the separation of currents allowed the model neuron to burst intrinsically for basically all axial coupling strengths. As the axial coupling strength between its 2 compartments was varied the oscillation frequency first increased and then decreased. This is in agreement with one of the 2 behaviors described in Kepler et al. (1990), in which the effect of electrically coupling a hyperpolarized, passive cell to an intrinsic, relaxation oscillator are described. The behavior of the model PD neuron was a bit more complicated but also more interesting: its compartments exhibited bursting behavior for both small and large axial conductances, but for an intermediate range of conductance values exhibited tonic spiking behavior or bistability between bursting and tonic spiking. Thus depending on the strength of the axial coupling, the intrinsic dynamics of one compartment dominated the behavior at the neuron level. Although the actual mathematical mechanism for these behavioral transitions still needs to be analyzed, the overall nonmonotonic behavior of the bursting frequency in these 2 compartments (first decreasing and then increasing as the axial coupling strength increased) is similar to some of those described in Kopell et al. (1998) for the effect of electrically coupling a bistable element to a relaxation oscillator.
At the network level, we have illustrated that both a one- and a 2-compartment intrinsic bursting neuron, when very strongly electrically coupled to a tonic spiking neuron, can drive the spiking neuron to burst synchronously with it. However, this was not necessarily the case when the coupling was small to moderate. Instead, the spiking neuron was able to dominate the network dynamics and prevent the oscillator from bursting when one-compartment model neurons were used. Segregating the currents responsible for action-potential generation from other intrinsic currents allowed the electrical coupling to provide a very robust mechanism for producing synchronous bursting oscillations: the range of coupling strengths for which synchronous bursting was possible widened considerably to include small to intermediate coupling strengths. This could potentially have significant consequences for electrically coupled networks of nonelectrotonically compact neurons in that the spatial structure and the location of the gap junctions may determine their ability to synchronize (Lewis and Rinzel 2004; Saraga and Skinner 2004).
Asymmetric perturbations in networks of electrically coupled neurons
The synaptic and modulatory inputs received by electrically coupled neurons are often asymmetrical and this asymmetry may have functional consequences for the network behavior (Blatow et al. 2003; Galarreta and Hestrin 1999; Gibson et al. 1999; Johnson et al. 1994; Landisman et al. 2002; Marder and Eisen 1984a). We showed that the period range of oscillations of 2 identical, electrically coupled bursting neurons receiving asymmetric inputs, if the coupling is weak to moderate, can be smaller than that of the isolated neurons. On the other hand, the dynamic range of inputs to an isolated, bursting neuron may be expanded when it is electrically coupled to a distinct neuron. Our results suggest that in the coupled network, the AB and PD neurons may play distinct roles in the regulation of longer cycle periods, whereas their role is similar for shorter cycle periods: the coupled network cannot produce bursting oscillations with periods as short as those of the isolated AB neuron. These results also suggest that the presence of the PD neuron may simultaneously buffer the AB neuron oscillation from hyperpolarizing inputs while making the AB–PD network more sensitive to depolarizing inputs.
An experimental example of asymmetric effects of synaptic inputs to a network occurs in the biological AB–PD pacemaker. High-frequency stimulation of the inferior ventricular nerve (ivn), which synaptically affects these electrically coupled neurons, results in an increase in the AB–PD network burst amplitude and frequency. Stimulation of ivn produces asymmetrical responses from each neuron in isolation: the burst frequency of the AB neuron decreases and the PD neuron undergoes a long, slow depolarization (Marder and Eisen 1984a; Miller and Selverston 1982). It is this long depolarization on the PD neuron that is thought to be responsible for the network response. The effect of ivn stimulation on the PD neuron, characterized in Sigvardt and Mulloney (1982), consists of a fast excitation, a slower inhibition followed by a long-lasting depolarization. The total synaptic current could be seen as an additional current contributing to the axial current from the A compartment into the S/N compartment of the PD. This contribution would amount to an effective change in the maximal conductance of the axial current, and we have seen that such a change, if sufficiently large in either direction, can turn the model tonic spiking PD neuron into a bursting neuron.
The examples presented throughout this work help illustrate that neuromodulation that acts at any of the different network levels, whether it is by modifying intrinsic properties, coupling conductances, and/or synaptic inputs, could change the effective compartmental structure of the network, and thus significantly modify the network behavior.
Footnotes
GRANTS
This work was supported by National Institute of Mental Health Grant MH-60605 to F. Nadim. C. Soto-Treviño was supported by National Science Foundation Grant IBN0090250.
References
- Abbott LF, Marder E, Hooper SL. Oscillating networks: control of burst duration by electrically coupled neurons. Neural Comput. 1991;3:487– 497. doi: 10.1162/neco.1991.3.4.487. [DOI] [PubMed] [Google Scholar]
- Ayali A, Harris-Warrick RM. Monoamine control of the pacemaker kernel and cycle frequency in the lobster pyloric network. J Neurosci. 1999;19:6712– 6722. doi: 10.1523/JNEUROSCI.19-15-06712.1999. [DOI] [PMC free article] [PubMed] [Google Scholar]
- Bal T, Nagy F, Moulins M. The pyloric central pattern generator in crustacea: a set of conditional neuronal oscillators. J Comp Physiol. 1988;163:715–727. [Google Scholar]
- Bennett MV. Gap junctions as electrical synapses. J Neurocytol. 1997;26:349 –366. doi: 10.1023/a:1018560803261. [DOI] [PubMed] [Google Scholar]
- Blatow M, Rozov A, Katona I, Hormuzdi SG, Meyer AH, Whittington MA, Caputi A, Monyer H. A novel network of multipolar bursting interneurons generates theta frequency oscillations in neocortex. Neuron. 2003;38:805– 817. doi: 10.1016/s0896-6273(03)00300-3. [DOI] [PubMed] [Google Scholar]
- Buchholtz F, Golowasch J, Epstein IR, Marder E. Mathematical model of an identified stomatogastric ganglion neuron. J Neurophysiol. 1992;67:332–340. doi: 10.1152/jn.1992.67.2.332. [DOI] [PubMed] [Google Scholar]
- Chow CC, Kopell N. Dynamics of spiking neurons with electrical coupling. Neural Comput. 2000;12:1643–1678. doi: 10.1162/089976600300015295. [DOI] [PubMed] [Google Scholar]
- Dermietzel R, Spray DC. Gap junctions in the brain: where, what type, how many and why? Trends Neurosci. 1993;16:186 –192. doi: 10.1016/0166-2236(93)90151-b. [DOI] [PubMed] [Google Scholar]
- De Vries G, Sherman A, Zhu HR. Diffusively coupled bursters: effects of cell heterogeneity. B Math Biol. 1998;60:1167–1200. doi: 10.1006/bulm.1998.0057. [DOI] [PubMed] [Google Scholar]
- Eisen JS, Marder E. A mechanism for production of phase shifts in a pattern generator. J Neurophysiol. 1984;51:1375–1393. doi: 10.1152/jn.1984.51.6.1375. [DOI] [PubMed] [Google Scholar]
- Flamm RE, Harris-Warrick RM. Aminergic modulation in lobster stomatogastric ganglion. II. Target neurons of dopamine, octopamine, and serotonin within the pyloric circuit. J Neurophysiol. 1986;55:866 – 881. doi: 10.1152/jn.1986.55.5.866. [DOI] [PubMed] [Google Scholar]
- Galarreta M, Hestrin S. A network of fast-spiking cells in the neocortex connected by electrical synapses. Nature. 1999;402:72–75. doi: 10.1038/47029. [DOI] [PubMed] [Google Scholar]
- Gibson JR, Beierlein M, Connors BW. Two networks of electrically coupled inhibitory neurons in neocortex. Nature. 1999;402:75–79. doi: 10.1038/47035. [DOI] [PubMed] [Google Scholar]
- Golowasch J, Buchholtz F, Epstein IR, Marder E. Contribution of individual ionic currents to activity of a model stomatogastric ganglion neuron. J Neurophysiol. 1992;67:341–349. doi: 10.1152/jn.1992.67.2.341. [DOI] [PubMed] [Google Scholar]
- Harris-Warrick RM.Dynamic Biological Networks: The Stomatogastric Nervous System. Cambridge, MA: MIT Press, 1992.
- Hooper SL. Phase maintenance in the pyloric pattern of the lobster (Panulirus interruptus) stomatogastric ganglion. J Comput Neurosci. 1997;4:191–205. doi: 10.1023/a:1008822218061. [DOI] [PubMed] [Google Scholar]
- Hooper SL, Marder E. Modulation of the lobster pyloric rhythm by the peptide proctolin. J Neurosci. 1987;7:2097–2112. doi: 10.1523/JNEUROSCI.07-07-02097.1987. [DOI] [PMC free article] [PubMed] [Google Scholar]
- Jefferys JG. Nonsynaptic modulation of neuronal activity in the brain: electric currents and extracellular ions. Physiol Rev. 1995;75:689 –723. doi: 10.1152/physrev.1995.75.4.689. [DOI] [PubMed] [Google Scholar]
- Johnson BR, Kloppenburg P, Harris-Warrick RM. Dopamine modulation of calcium currents in pyloric neurons of the lobster stomatogastric ganglion. J Neurophysiol. 2003;90:631– 643. doi: 10.1152/jn.00037.2003. [DOI] [PubMed] [Google Scholar]
- Johnson BR, Peck JH, Harris-Warrick RM. Differential modulation of chemical and electrical components of mixed synapses in the lobster stomatogastric ganglion. J Comp Physiol A Sens Neural Behav Physiol. 1994;175:233–249. doi: 10.1007/BF00215119. [DOI] [PubMed] [Google Scholar]
- Kepler TB, Marder E, Abbott LF. The effect of electrical coupling on the frequency of model neuronal oscillators. Science. 1990;248:83– 85. doi: 10.1126/science.2321028. [DOI] [PubMed] [Google Scholar]
- Komendantov AO, Komendantova OG, Johnson SW, Canavier CC. A modeling study suggests complementary roles for GABAA and NMDA receptors and the SK channel in regulating the firing pattern in midbrain dopamine neurons. J Neurophysiol. 2004;91:346 –357. doi: 10.1152/jn.00062.2003. [DOI] [PubMed] [Google Scholar]
- Kopell N, Abbott LF, Soto-Treviño C. On the behavior of a neural oscillator electrically coupled to a bistable element. Physica D. 1998;121:367–395. [Google Scholar]
- Landisman CE, Long MA, Beierlein M, Deans MR, Paul DL, Connors BW. Electrical synapses in the thalamic reticular nucleus. J Neurosci. 2002;22:1002–1009. doi: 10.1523/JNEUROSCI.22-03-01002.2002. [DOI] [PMC free article] [PubMed] [Google Scholar]
- Lewis TJ, Rinzel J. Dendritic effects in networks of electrically coupled fast-spiking interneurons. Neurocomputing. 2004;58–60:145–150. [Google Scholar]
- Manor Y, Rinzel J, Segev I, Yarom Y. Low-amplitude oscillations in the inferior olive: a model based on electrical coupling of neurons with heterogeneous channel densities. J Neurophysiol. 1997;77:2736 –2752. doi: 10.1152/jn.1997.77.5.2736. [DOI] [PubMed] [Google Scholar]
- Marder E, Eisen JS. Electrically coupled pacemaker neurons respond differently to same physiological inputs and neurotransmitters. J Neurophysiol. 1984a;51:1362–1374. doi: 10.1152/jn.1984.51.6.1362. [DOI] [PubMed] [Google Scholar]
- Marder E, Eisen JS. Transmitter identification of pyloric neurons: electrically coupled neurons use different transmitters. J Neurophysiol. 1984b;51:1345–1361. doi: 10.1152/jn.1984.51.6.1345. [DOI] [PubMed] [Google Scholar]
- Marder E, Hooper SL, Siwicki KK. Modulatory action and distribution of the neuropeptide proctolin in the crustacean stomatogastric nervous system. J Comp Neurol. 1986;243:454 – 467. doi: 10.1002/cne.902430403. [DOI] [PubMed] [Google Scholar]
- Medvedev GS, Kopell N. Synchronization and transient dynamics in the chains of electrically coupled Fitzhugh–Nagumo oscillators. Siam J Appl Math. 2001;61:1762–1801. [Google Scholar]
- Medvedev GS, Wilson CJ, Callaway JC, Kopell N. Dendritic synchrony and transient dynamics in a coupled oscillator model of the dopaminergic neuron. J Comput Neurosci. 2003;15:53– 69. doi: 10.1023/a:1024422802673. [DOI] [PubMed] [Google Scholar]
- Meunier C. The electrical coupling of two simple oscillators: load and acceleration effects. Biol Cybern. 1992;67:155–164. doi: 10.1007/BF00201022. [DOI] [PubMed] [Google Scholar]
- Miller JP, Selverston AI. Mechanisms underlying pattern generation in lobster stomatogastric ganglion as determined by selective inactivation of identified neurons. II. Oscillatory properties of pyloric neurons. J Neurophysiol. 1982;48:1378 –1391. doi: 10.1152/jn.1982.48.6.1378. [DOI] [PubMed] [Google Scholar]
- Perez Velazquez JL, Carlen PL. Gap junctions, synchrony and seizures. Trends Neurosci. 2000;23:68 –74. doi: 10.1016/s0166-2236(99)01497-6. [DOI] [PubMed] [Google Scholar]
- Raper JA. Nonimpulse-mediated synaptic transmission during the generation of a cyclic motor program. Science. 1979;205:304 –306. doi: 10.1126/science.221982. [DOI] [PubMed] [Google Scholar]
- Saraga F, Skinner FK. Location, location, location (and density) of gap junctions in multi-compartment models. Neurocomputing. 2004;58–60:713–719. [Google Scholar]
- Selverston AI, Miller JP. Mechanisms underlying pattern generation in lobster stomatogastric ganglion as determined by selective inactivation of identified neurons. I. Pyloric system. J Neurophysiol. 1980;44:1102–1121. doi: 10.1152/jn.1980.44.6.1102. [DOI] [PubMed] [Google Scholar]
- Selverston AI, Russell DF, Miller JP, King D. The stomatogastric nervous system: structure and function of a small neural network. Prog Neurobiol. 1976;7:215–290. doi: 10.1016/0301-0082(76)90008-3. [DOI] [PubMed] [Google Scholar]
- Sherman A, Rinzel J. Rhythmogenic effects of weak electrotonic coupling in neuronal models. Proc Natl Acad Sci USA. 1992;89:2471–2474. doi: 10.1073/pnas.89.6.2471. [DOI] [PMC free article] [PubMed] [Google Scholar]
- Shilnikov A, Cymbalyuk G. Transition between tonic spiking and bursting in a neuron model via the blue-sky catastrophe. Phys Rev Lett. 2005;94:048101. doi: 10.1103/PhysRevLett.94.048101. [DOI] [PubMed] [Google Scholar]
- Sigvardt KA, Mulloney B. Properties of synapses made by IVN command-interneurones in the stomatogastric ganglion of the spiny lobster Panulirus interruptus. J Exp Biol. 1982;97:153–168. doi: 10.1242/jeb.97.1.153. [DOI] [PubMed] [Google Scholar]
- Skinner FK, Zhang L, Velazquez JL, Carlen PL. Bursting in inhibitory interneuronal networks: a role for gap-junctional coupling. J Neurophysiol. 1999;81:1274 –1283. doi: 10.1152/jn.1999.81.3.1274. [DOI] [PubMed] [Google Scholar]
- Swensen AM, Marder E. Multiple peptides converge to activate the same voltage-dependent current in a central pattern-generating circuit. J Neurosci. 2000;20:6752– 6759. doi: 10.1523/JNEUROSCI.20-18-06752.2000. [DOI] [PMC free article] [PubMed] [Google Scholar]
- Turrigiano G, LeMasson G, Marder E. Selective regulation of current densities underlies spontaneous changes in the activity of cultured neurons. J Neurosci. 1995;15:3640 –3652. doi: 10.1523/JNEUROSCI.15-05-03640.1995. [DOI] [PMC free article] [PubMed] [Google Scholar]
- Wilson CJ, Callaway JC. Coupled oscillator model of the dopaminergic neuron of the substantia nigra. J Neurophysiol. 2000;83:3084 –3100. doi: 10.1152/jn.2000.83.5.3084. [DOI] [PubMed] [Google Scholar]