

Abstract
In developed countries, age-related macular degeneration is a common cause of blindness in the elderly. A common polymorphism, encoding the sequence variation Y402H in complement factor H (CFH), has been strongly associated with disease susceptibility. Here, we examined 84 polymorphisms in and around CFH in 726 affected individuals (including 544 unrelated individuals) and 268 unrelated controls. In this sample, 20 of these polymorphisms showed stronger association with disease susceptibility than the Y402H variant. Further, no single polymorphism could account for the contribution of the CFH locus to disease susceptibility. Instead, multiple polymorphisms defined a set of four common haplotypes (of which two were associated with disease susceptibility and two seemed to be protective) and multiple rare haplotypes (associated with increased susceptibility in aggregate). Our results suggest that there are multiple disease susceptibility alleles in the region and that noncoding CFH variants play a role in disease susceptibility.
Age-related macular degeneration (AMD; OMIM 603075) is a complex degenerative disorder that primarily affects the elderly. Disease susceptibility is influenced by multiple genetic1–5 and environmental factors6–9. Recently, targeted and genome-wide searches have identified alleles on chromosomes 1q and 10q that are strongly associated with disease susceptibility10–14. In each case, the association seems to be robust and has been replicated in multiple samples. We previously showed that the Y402H-encoding variant of CFH is strongly associated with AMD susceptibility in a sample of affected individuals and controls collected at the Kellogg Eye Center in Ann Arbor, Michigan15. Here, we examined the impact of 84 polymorphisms in a region of 123 kb overlapping CFH on disease susceptibility.
After quality assessment of genotype data (see Methods), we tested each SNP for association in 544 unrelated affected individuals and 268 unrelated controls (Fig. 1). As expected, we observed strong association between disease status and the Y402H-encoding variant previously associated with AMD in multiple studies (likelihood ratio test χ2 = 110.05, P <10−25). Unexpectedly, 20 other variants showed even stronger association. The strongly associated SNPs fell into two linkage disequilibrium (LD) groups (colored in purple and green in Fig. 1), such that, within each group, pairwise r2 > 0.80, and between groups, pairwise r2 < 0.50. The Y402H-encoding variant was included in one of the LD groups (the purple group in Fig. 1). The three SNPs showing strongest association are a synonymous SNP in exon 10, rs2274700 (LRT χ2 = 135.42, P < 10−30) and two intronic SNPs, rs1410996 (LRT χ2 = 132.70, P < 10−29) and rs7535263 (LRT χ2 = 130.43, P < 10−29). We observed similar results using a family-based association test16,17 that incorporated all 726 affected individuals genotyped.
Figure 1.
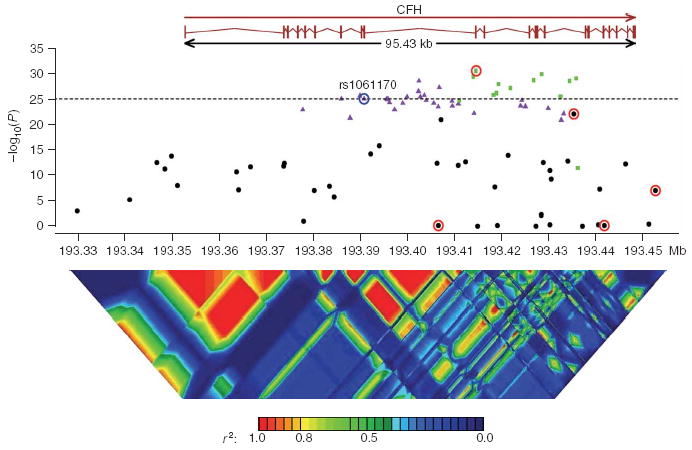
P values for single-SNP association, when comparing unrelated affected individuals (cases) and controls. The dotted horizontal line is −log10(P) of the original Y402H variant (circled in blue). Strongly associated SNPs fall into one of two LD groups (SNPs in one of these groups are colored in green; SNPs in the other group are colored in purple; SNPs outside either group are in black). SNPs selected from the stepwise haplotype association analysis are circled in red. Linkage disequilibrium across the CFH region29 is shown below, plotted as pairwise r2 values.
Table 1 summarizes results of family-based and case-control single-SNP association tests for rs1061170 (the Y402H coding polymorphism) and the 20 SNPs that showed even more significant association in our sample. Table 1 also includes four SNPs that showed weaker marginal association but that were included in our haplotype model detailed below. Supplementary Tables 1, 2 and 3 online provide genotype counts and detailed results for all 84 SNPs (including 2 d.f. association test results). The estimated sibling recurrence risk ratio (λsib) (ref. 18) for rs1061170 is smaller than in our earlier analysis15, which had not accounted for the increased contrast between affected individuals and controls as a result of the selection of families with multiple affected individuals. In the present analysis, we modeled phenotypes for all affected individuals within each family simultaneously16,17, and we expect our estimates of λsib, penetrances and allele frequencies to be more accurate. To help interpret the λsib estimates associated with each polymorphism, we also used previously genotyped microsatellite markers to calculate a MOD score (LOD score maximized over mode of inheritance19) at the location of the CFH locus. The estimated MOD score was 1.76 (3 d.f., P = 0.04) with an estimated disease allele frequency of 0.230 and penetrances of 0.044, 0.340 and 1.00 for low-risk allele homozygotes, heterozygotes and high-risk allele homozygotes, respectively. Notably, this disease model gave λsib ≈ 1.67, but the largest λsib accounted for by a single SNP was only 1.25 (for marker rs7535263; see last column of Table 1). The haplotype method20 also suggested the presence of multiple disease susceptibility alleles in the region, because haplotypes grouped according to either the allele encoding Y402H or the allele at rs2274700 (the marker showing strongest association) differed substantially between affected individuals and controls (Supplementary Fig. 1 online).
Table 1.
Effects of rs1061170 (Y402H) and 20 SNPs showing even more significant association with AMD and SNPs selected in the stepwise haplotype analysis
| Unrelated individuals only
|
Complete sample, including affected relative pairs
|
|||||||||||||||
|---|---|---|---|---|---|---|---|---|---|---|---|---|---|---|---|---|
| Allele frequency comparison
|
Penetrances
|
|||||||||||||||
| SNP | Risk allele | Position | LD group | Context | N | LRT | P | Affect. | Ctrl. | χ2 | P | Allele freq. | +/+ | +/− | −/− | λsib |
| rs2274700 | C | 193,414,604 | 2 | Exon 10 | 696 | 135.42 | <10−30 | 0.842 | 0.554 | 125.73 | <10−28 | 0.610 | 0.053 | 0.130 | 0.349 | 1.166 |
| rs1410996 | C | 193,428,590 | 2 | Intron 14 | 693 | 132.70 | <10−29 | 0.843 | 0.538 | 130.85 | <10−29 | 0.601 | 0.049 | 0.121 | 0.371 | 1.204 |
| rs7535263 | G | 193,414,003 | 2 | Intron 9 | 668 | 130.43 | <10−29 | 0.818 | 0.453 | 127.54 | <10−28 | 0.541 | 0.031 | 0.145 | 0.414 | 1.252 |
| rs10801559 | G | 193,435,861 | 2 | Intron 15 | 784 | 128.86 | <10−29 | 0.826 | 0.553 | 121.16 | <10−27 | 0.606 | 0.047 | 0.141 | 0.342 | 1.155 |
| rs3766405 | C | 193,426,818 | 2 | Intron 12 | 736 | 126.97 | <10−28 | 0.821 | 0.520 | 121.85 | <10−27 | 0.584 | 0.038 | 0.144 | 0.361 | 1.182 |
| rs10754199 | A | 193,402,496 | 1 | Intron 9 | 756 | 126.56 | <10−28 | 0.619 | 0.303 | 125.20 | <10−28 | 0.375 | 0.083 | 0.222 | 0.452 | 1.178 |
| rs1329428 | G | 193,434,467 | 2 | Intron 15 | 804 | 126.56 | <10−28 | 0.819 | 0.549 | 126.13 | <10−28 | 0.601 | 0.042 | 0.145 | 0.343 | 1.157 |
| rs10922104 | A | 193,419,387 | 2 | Intron11 | 808 | 123.66 | <10−28 | 0.820 | 0.554 | 122.53 | <10−27 | 0.606 | 0.043 | 0.144 | 0.339 | 1.153 |
| rs1887973 | C | 193,406,836 | 1 | Intron 9 | 730 | 120.46 | <10−27 | 0.635 | 0.333 | 127.74 | <10−28 | 0.387 | 0.079 | 0.214 | 0.460 | 1.192 |
| rs10922105 | A | 193,421,907 | 2 | Intron 11 | 774 | 120.09 | <10−27 | 0.840 | 0.576 | 136.64 | <10−30 | 0.623 | 0.014 | 0.148 | 0.331 | 1.160 |
| rs4658046 | C | 193,402,414 | 1 | Intron 9 | 763 | 117.11 | <10−26 | 0.619 | 0.318 | 118.21 | <10−26 | 0.384 | 0.083 | 0.221 | 0.435 | 1.166 |
| rs10465586 | A | 193,418,986 | 2 | Intron 11 | 789 | 115.52 | <10−26 | 0.815 | 0.556 | 108.81 | <10−24 | 0.604 | 0.047 | 0.150 | 0.331 | 1.137 |
| rs3753395 | A | 193,418,309 | 2 | Intron 11 | 755 | 113.65 | <10−25 | 0.822 | 0.559 | 108.29 | <10−24 | 0.612 | 0.046 | 0.144 | 0.333 | 1.143 |
| rs402056 | C | 193,403,643 | 1 | Intron 9 | 774 | 113.41 | <10−25 | 0.622 | 0.337 | 113.18 | <10−25 | 0.396 | 0.091 | 0.209 | 0.424 | 1.149 |
| rs7529589 | T | 193,389,936 | 1 | Intron 7 | 807 | 113.19 | <10−25 | 0.619 | 0.340 | 114.97 | <10−26 | 0.396 | 0.088 | 0.216 | 0.412 | 1.146 |
| rs7514261 | G | 193,432,571 | 2 | Intron 15 | 734 | 112.48 | <10−25 | 0.819 | 0.536 | 109.27 | <10−24 | 0.599 | 0.040 | 0.146 | 0.344 | 1.159 |
| rs10922102 | C | 193,399,944 | 1 | Intron 9 | 729 | 112.26 | <10−25 | 0.622 | 0.326 | 108.40 | <10−24 | 0.393 | 0.090 | 0.213 | 0.421 | 1.148 |
| rs10922103 | G | 193,402,775 | 1 | Intron 9 | 803 | 112.11 | <10−25 | 0.618 | 0.340 | 112.40 | <10−25 | 0.395 | 0.089 | 0.216 | 0.411 | 1.143 |
| rs800290 | G | 193,395,570 | 1 | Intron 9 | 800 | 110.26 | <10−25 | 0.615 | 0.339 | 111.55 | <10−25 | 0.395 | 0.090 | 0.215 | 0.411 | 1.142 |
| rs1061147 | A | 193,385,981 | 1 | Exon 7 | 802 | 110.24 | <10−25 | 0.616 | 0.340 | 113.60 | <10−25 | 0.394 | 0.088 | 0.218 | 0.410 | 1.144 |
| rs1061170 | C | 193,390,894 | 1 | Exon 9 | 801 | 110.05 | <10−25 | 0.616 | 0.340 | 99.49 | <10−22 | 0.429 | 0.093 | 0.211 | 0.360 | 1.106 |
| rs1048663 | G | 193,406,639 | Intron 9 | 798 | 0.23 | 0.63 | 0.843 | 0.834 | 1.52 | 0.22 | 0.823 | 0.205 | 0.187 | 0.205 | 1.001 | |
| rs412852 | C | 193,435,364 | Intron 15 | 794 | 96.62 | <10−22 | 0.644 | 0.384 | 92.62 | <10−21 | 0.448 | 0.096 | 0.196 | 0.369 | 1.111 | |
| rs11582939 | C | 193,441,814 | Intron 18 | 754 | 0.08 | 0.78 | 0.830 | 0.836 | 0.02 | 0.89 | 0.170 | 0.200 | 0.196 | 0.226 | 1.000 | |
| rs1280514 | A | 193,452,712 | 711 | 28.18 | <10−6 | 0.969 | 0.897 | 29.25 | <10−7 | 0.909 | 0.000 | 0.089 | 0.224 | 1.035 | ||
The rs number for each SNP is followed by its risk allele (defined as the allele with higher frequency in affected individuals than in controls) and position in the May 2004 genome assembly. Association analyses are summarized for a sample of unrelated individuals and, in addition, for our full sample including multiple affected relative pairs. N is the number of genotypes available among unrelated individuals; LRT is the standard likelihood ratio test statistic used to compare allele frequencies in cases and controls. Affect., affected individuals; ctrl., controls; When analyzing the full sample, we calculated a χ2 statistic corresponding to a parametric model of association using the LAMP16,17 program. The frequency of the risk allele in the population, penetrances for each genotype, and λsib (ref. 18) for each SNP as estimated by LAMP are tabulated. The associated markers fall in two LD groups. Markers in each group have r2 > 0.80 with each other and markers in different groups have r2 of ~0.40 with each other. The table includes association results for the 20 SNPs that show stronger association than rs1061170 (the Y402H variant) and four additional SNPs that show weaker marginal association but that were included in the haplotype model.
To further dissect the association between these polymorphisms and susceptibility to AMD, we examined whether a model with two or more SNPs resulted in significantly stronger association. To do this, we used a likelihood ratio test (LRT) to compare haplotype frequencies between affected individuals and controls. We started with the SNP showing the strongest association with disease and then iteratively expanded the model one SNP at a time. At each iteration, we selected the SNP that resulted in the largest increase in the LRT statistic. The SNP that showed the strongest LRT association with disease was rs2274700 (LRT χ2 = 135.42, Table 1). When evaluating all pairs of SNPs including rs2274700 and one other SNP, we observed very strong association for haplotypes defined by pairing rs2274700 and rs1280514 (LRT χ2 = 188.69). To evaluate the statistical significance of this finding, we permuted case and control labels among individuals with the same genotype (C/C, C/T, T/T or missing) for marker rs2274700. This permutation preserves the LD pattern in the original sample as well as the association between rs2274700 and disease. For each permutation, we selected the SNP pairing that produced the strongest association and recorded the increase in the LRT statistic. In 10,000 permutations of the data, we saw an average increase of 1.76 in the LRT χ2 statistic and never observed an increase in the LRT χ2 > 53.27, corresponding to the pairing of rs2274700 and rs1280514 in the original data.
We proceeded to refine our haplotype model in a similar manner. At each stage, we selected the SNP producing the largest increase in the LRT χ2 statistic and evaluated empirical significance by permuting case and control labels among individuals with the same genotype at previously selected markers. Table 2 shows that 4–5 SNPs are required to describe association between the CFH locus and AMD susceptibility.
Table 2.
Results of stepwise haplotype association analysis
| SNPs | ΔLRT | P | ||||
|---|---|---|---|---|---|---|
| rs2274700 | 135.42 | <0.0001 | ||||
| rs2274700 | rs1280514 | 53.27 | <0.0001 | |||
| rs2274700 | rs1280514 | rs412852 | 30.66 | <0.0001 | ||
| rs2274700 | rs1280514 | rs412852 | rs11582939 | 96.81 | <0.0001 | |
| rs2274700 | rs1280514 | rs412852 | rs11582939 | rs1048663 | 19.22 | 0.0104 |
Empirical P value was adjusted for multiple testing and was assessed using 10,000 permutations. A permutated sample was obtained by permuting disease affection status among affected individuals and controls while preserving evidence for association among SNPs selected in the previous step. Specifically, at each step, we grouped individuals according to genotype patterns at previously selected SNPs, and then permuted the disease affection status within each group of individuals with the same genotype pattern. Haplotype association was evaluated using a likelihood ratio test to compare haplotype frequencies between cases and controls. The likelihood ratio statistic was calculated with FUGUE-CC28. ΔLRT, difference in the likelihood ratio statistic between the current step and the previous step.
Table 3 provides details of haplotypes defined by the five selected SNPs and their frequencies in affected individuals and controls. We estimated haplotype effects using logistic regression to model individual affection status as a function of the expected dosage of each haplotype21. We identified two common disease susceptibility haplotypes, two common protective haplotypes and a set of rare haplotypes, which in the aggregate seem to be associated with increased disease susceptibility. The C allele of Y402H was present in ~94% of chromosomes that carry the most common risk haplotype and was absent from the common protective haplotypes. However, the allele was also absent from chromosomes carrying the second common risk haplotype (Table 3). On its own, neither Y402H nor any of the other 83 variants we examined could distinguish the common risk haplotypes from the common protective haplotypes. In addition, we did not identify any combination of alleles at two or more SNPs that was shared between the two common risk haplotypes but absent from the protective haplotypes (or vice versa). Thus, our results suggest that there might be multiple susceptibility alleles in the region. If there is a single (still to be identified) causal allele, it would most likely have to appear on multiple different haplotype backgrounds.
Table 3.
Association analysis of selected 5-SNP haplotypes
| Haplotype | Frequency | Conditional probability | Haplotype trend regression | ||||||
|---|---|---|---|---|---|---|---|---|---|
| rs1048663 | rs2274700 | rs412852 | rs11582939 | rs1280514 | Affected + controls (n = 812) | Affected (n = 544) | Controls (n = 268) | P(Y402H= Clhaplotype)a | χ12 (P ) |
| G | C | C | C | A | 0.5136 | 0.5797 | 0.3786 | 0.9386 | 86.71 (<0.0001) |
| G | T | T | C | A | 0.2386 | 0.1403 | 0.4391 | 0.0000 | 51.04 (<0.0001) |
| A | C | T | T | A | 0.0784 | 0.0856 | 0.0633 | 0.0000 | 21.46 (<0.0001) |
| A | C | T | T | G | 0.0564 | 0.0318 | 0.1062 | 0.0000 | 25.07 (<0.0001) |
| G | C | T | C | A | 0.0279 | 0.0393 | 0.0028 | ||
| G | C | C | T | A | 0.0212 | 0.0309 | 0.0016 | ||
| A | C | T | C | A | 0.0205 | 0.0298 | 0.0010 | 0.3964 | 17.09 (<0.0001) |
| G | T | C | C | A | 0.0178 | 0.0254 | 0.0009 | ||
Haplotype frequencies estimated using PHASE30. All haplotypes with frequency >1% in the combined case and control sample are shown. Haplotypes with a frequency <0.05 were pooled before haplotype trend regression. Putative risk haplotypes are marked in bold.
r2 between Y402H and each of the five haplotype groups (four common haplotypes and one pool of rare haplotypes) is ≈ 0.78, 0.41, 0.03, 0.08 and 0.00. D’ is ≈ 0.96, 1.00, 1.00, 1.00 and 0.02. When cases and controls were examined separately, the frequency of allele C at Y402H was 0.96 in affected individuals and 0.89 in controls (for carriers of haplotype 1), and 0.40 in affected individuals and 0.31 in controls (for carriers of one of the rare haplotypes).
Inspection of genotype frequencies in affected individuals and controls suggests that individuals carrying zero, one or two risk haplotypes are at progressively increased risk of developing disease. Table 4 presents the estimated probability of disease for each possible haplo-genotype combination, estimated using maximum likelihood and assuming disease prevalence of 20% and a multiplicative model for disease risk. Note that the estimated probabilities of developing disease for each genotype configuration will depend on the overall disease prevalence, which varies with age.
Table 4.
Estimated probability of disease for each possible haplo-genotype combination
| Haplotype | h1 | h2 | h3 | h4 | h5–h8 |
|---|---|---|---|---|---|
| h1 | 0.4475 (0.0183) | 0.1100 (0.0077) | 0.3778 (0.0339) | 0.0697 (0.0189) | 0.5887 (0.0151) |
| h2 | 0.0271 (0.0048) | 0.0929 (0.0102) | 0.0171 (0.0053) | 0.1448 (0.0132) | |
| h3 | 0.3190 (0.0586) | 0.0588 (0.0142) | 0.4970 (0.0507) | ||
| h4 | 0.0109 (0.0064) | 0.0917 (0.0268) | |||
| h5–h8 | 0.7745 (0.0261) |
Probabilities estimated using maximum likelihood and assuming a multiplicative model for disease risk. s.d. for each estimate (in parenthesis) estimated using the jackknife procedure. Population prevalence was fixed at 20%. h1–h8 represent the eight haplotypes listed in Table 3.
Notably, when we recoded imputed haplotypes into a biallelic system (with a high-risk allele and a low risk allele), we found no evidence for additional linked variants16,17 (LOD < 0.01). Further, using the haplotype method20, we found that haplotypes classified using the five selected markers were similar in affected individuals and controls (Supplementary Fig. 1). These two results suggest that, if susceptibility alleles are not included in the set of genotyped variants, they will either be in very strong LD with the selected SNPs or have relatively small effects.
One concern is that our model selection procedure might affect the resulting set of risk and protective haplotypes and, ultimately, our conclusions. Thus, we repeated our analysis using each of the ten SNPs showing the strongest evidence for association as the starting point for stepwise analysis. Depending on the choice of starting SNP, this resulted in a model with four or five SNPs (Supplementary Table 4 online). In each case, the selected SNPs were in strong LD with the originally selected SNPs. We also used an exhaustive search procedure to examine all possible combinations of up to five SNPs (Supplementary Table 5 online). The best four-SNP combination identified was the same as in the original stepwise analysis, and the best five-SNP combination differed by only one SNP (rs11582939 was replaced with rs2336221; r2 between the two is >0.99). Given substantial LD in the region, it is not surprising that different subsets of markers can be used to distinguish risk and non-risk haplotypes. Nevertheless, in each of our alternative analyses, the selected SNPs defined two common risk haplotypes, two common protective haplotypes and a series of rare haplotypes that were, in the aggregate, associated with disease.
Another concern is that vagaries of missing data patterns could strengthen or weaken the evidence of association for individual SNPs or haplotypes. To address this, we used PHASE22,23 to impute missing genotypes. We initially masked 3,372 (5%) of the available genotypes to check our ability to infer the genotypes correctly. We found only 33 mismatches between the original masked genotypes and inferred genotypes. Given the high quality of the inferred genotypes, we generated (i) a complete dataset by imputing the most likely genotype at each position using PHASE and (ii) ten additional datasets by sampling a plausible haplotype configuration for each individual, according to the posterior haplotype distribution estimated by PHASE. We then repeated single-marker and haplotype analyses in each ‘completed’ dataset and used stepwise logistic regression to identify a set of associated SNPs in the best imputed dataset. In each case, the results were consistent with our initial analyses: multiple SNPs showed substantially stronger association than did Y402H, and the markers selected in haplotype analyses defined two common susceptibility haplotypes, two common protective haplotypes and multiple rare haplotypes associated with disease susceptibility in the aggregate (Supplementary Table 4).
Taken together, our results show that (i) multiple variants show stronger association with AMD than the Y402H polymorphism, (ii) variants showing the strongest association appear to effect no change in the CFH protein, (iii) multiple haplotypes in the region seem to modulate risk of AMD and (iv) there are likely to be multiple disease-predisposing variants in the region.
One intriguing hypothesis is that the associated variants (or haplotypes) modulate risk of AMD not because they disrupt CFH protein function, but because they are important for regulating the expression of CFH, of other nearby complement genes or both (the region includes numerous CFH-like genes with similar sequences whose presence may account, in part, for the many SNPs in public databases for which we could not execute successful genotyping assays; see Methods). Using genotypes for the HapMap panel of individuals24 and gene expression data for 37 lymphoblastoid cell lines25, we evaluated the effect of the 84 SNPs examined here on the expression of transcripts in the CFH cluster in leukocytes. After Bonferroni adjustment for multiple testing, we found no evidence for association (P < 0.05). Thorough evaluation of the effects of these SNPs on gene expression would require a large sample and a more appropriate choice of tissue (for example, retina).
Our results show that dissection of complex disease susceptibility loci will be a challenging process and that identification of strongly associated alleles, even when they are protein coding, should not preclude further detailed genetic analysis. Here, we identified strong evidence for additional susceptibility alleles at the CFH locus, and our results suggest that, even if the Y402H variant plays a causal role in the etiology of AMD, it is unlikely to be the only major determinant of disease susceptibility in the region. It is even possible that Y402H is simply in LD with nearby alleles that show even stronger association. The strong LD in the region means that statistical methods will have limited resolution to distinguish between alternative sets of strongly associated SNPs. We propose that detailed sequence comparisons of the region encompassing CFH in affected and unaffected individuals, examination of individuals from populations that show less extensive LD and dissection of gene expression patterns in individuals carrying different CFH haplotypes will clarify the role of the CFH locus in susceptibility to AMD.
METHODS
Subjects
Families with AMD were primarily ascertained and recruited from the clinical practice at the Kellogg Eye Center, University of Michigan Hospitals. The patient population used for genotyping in this study is white and primarily of Western European ancestry, reflecting the genetic constitution of the Great Lakes region. Ophthalmic records for current and previous eye examinations, fundus photographs and fluorescein angiograms were obtained for all probands and family members. All records and ophthalmic documentation were scored for the presence of AMD clinical findings in each eye and were updated every 1–2 years. The recruitment and research protocols were reviewed and approved by the University of Michigan institutional review board, and informed consent was obtained from all study participants. Fundus findings in each eye were classified on the basis of a standardized set of diagnostic criteria established by the International Age-Related Maculopathy Epidemiological Study26. For the genetic studies reported here, macular findings were scored in each individual by use of a broad description of AMD. In total, our sample of 726 affected individuals includes 235 affected relative pairs in 93 families (153 sibling pairs, 4 half-sibling pairs, 45 cousin pairs, 4 parent-child pairs and 29 avuncular pairs). Focusing on a subset of the sample that included only unrelated individuals resulted in 544 affected individuals and 268 unrelated controls.
Genotyping and quality assessment
We attempted to design genotyping assays for all 244 SNPs in the region (dbSNP 124, February 2005). Primers were successfully designed for 193 of these SNPs and genotyping was carried out on the Sequenom platform by the Broad Institute/National Center for Research Resources Genotyping Center (Cambridge, Massachusetts). To facilitate quality assessment, we also genotyped the 90 CEU samples that are part of the HapMap24. Coding SNPs where the initial genotyping assay failed were attempted through sequencing at the University of Michigan DNA Sequencing Core. Among the 193 SNPs for which assays were attempted, a total of 84 SNPs passed Hardy-Weinberg equilibrium (HWE) tests27 (P > 0.001), had >75% of genotypes completed and showed a minor allele frequency of >0.05. The 84 successfully assayed SNPs had average minor allele frequencies (MAF) of 0.281 and genotyping completeness rates of 93.17%. The remaining SNPs were excluded from further consideration because they were rare (46 SNPs had MAF <0.05) or monomorphic (25 SNPs), had low genotyping success rates (23 SNPs) or failed HWE (15 SNPs). We excluded the 23 SNPs with low completeness rates because missingness patterns suggested a high proportion of missing heterozygotes, consistent with limitations of the assay platform. For 42 SNPs, we compared our genotype calls with those downloaded from the HapMap website and observed 15 discrepancies among 3,317 overlapping genotypes (genotyping error rate of ~0.22%).
Single-SNP association tests comparing unrelated affected individuals and controls
Allele frequencies in affected individuals and controls were compared using a standard likelihood ratio test statistic. Briefly, if the Oij denotes the observed counts for allele i (i = 1 or 2) in group j (j = affected individuals or controls), and Eij denotes the expected counts under the null hypothesis of no association, then the test statistic was defined as Significance was evaluated against a reference χ2 distribution with 1 degree of freedom. When we carried out a 2 d.f. association test (Supplementary Table 2), rankings for individual SNPs changed slightly but the top 10 SNPs remained the same in both the 1 d.f. and 2 d.f. analyses. When we compared the 1 d.f. and 2 d.f. models using logistic regression, we saw no significant improvement in model fit from the 2 d.f. models and thus the analysis presented in this manuscript focus on the 1 d.f. tests.
Single-SNP association tests incorporating related affected individuals and unrelated controls
To incorporate all available genotype data in our test of association and to estimate genetic model parameters, we fitted parametric models of association using the LAMP16,17 program. Briefly, the program estimates a disease allele frequency, a SNP allele frequency and three penetrances (constrained so that the disease prevalence = 20%) using all available data. Each SNP was analyzed together with two flanking microsatellite markers (GATA135F02 and GATA48B01, genotyped as part of our genome-wide linkage scan2) and independently of all other SNPs. Under the null hypothesis (linkage but no association), the SNP and disease alleles are assumed to be in linkage equilibrium (this corresponds to calculating a MOD score19). Under the alternative hypothesis, LD between the SNP and unobserved disease alleles is estimated using maximum likelihood and results in a one-parameter test (because three disease-SNP haplotype frequencies are estimated under the alternative but only two allele frequencies are estimated under the null). The fitted model allows for ascertainment. Our analyses assumed a fixed disease prevalence of 20%; different estimates would change parameter estimates, but do not seem to affect the overall ranking of SNPs (Supplementary Fig. 2).
Identification of strongly associated haplotypes
We used a stepwise procedure to identify the most strongly associated haplotypes. For each marker combination, we estimated haplotype frequencies in affected individuals, in controls and in the combined sample using maximum likelihood as implemented in FUGUE-CC28. The three-frequency estimates were used to calculate the likelihood of observed case genotypes (Lcases), of observed control genotypes (Lcontrols) and of the combined set of genotypes (Lcombined). A likelihood ratio statistic T = ln (LcasesLcontrols) − ln(Lcombined) was used evaluate differences between cases and controls and its significance was evaluated by permuting case and control labels. At each stage, the marker producing the greatest increase in the test statistic T was added to the model. As described in the text, we evaluated significance of the improvement in model fit produced by adding the Nth marker by focusing on permutations that did not alter genotypes for the previously selected N − 1 markers. This assessment of significance includes a built-in multiplicity adjustment, because at each stage we compare the maximum observed test statistic from the original data with the maximum statistics from the permuted datasets. The procedure is slightly conservative (that is, it slightly favors less complex models that include fewer SNPs), because the permutations become more and more constrained as additional SNPs are added into the model. However, given our large dataset and the presence of many common haplotypes, this concern is minor: even after selecting five SNPs, >10105 distinct permutations of the data are possible. We opted to use the permutation procedure described in the text because it (i) naturally accommodates missing data (with 84 SNPs, many individuals have at least one missing genotype), (ii) preserves patterns of LD in the original data, (iii) allowed us to condition out the effects of SNPs previously selected into the model and (iv) achieves a balance between a model that is too simple (for example, including only marginal effects) and one that is too complex (accounting for all genotype combinations). Individual haplotype effects were estimated using an approach analogous to one proposed previously by others21, but using logistic regression rather than linear regression to accommodate a discrete outcome.
Stepwise logistic regression
We carried out a stepwise-logistic regression using SAS version 9 (Cary, North Carolina). Genotypes at each marker were coded as 0, 1 or 2, corresponding to a 1-d.f. test. Owing to strong LD in the region, when building the logistic regression model, we did not use the Wald test, which is known to be unstable in the presence of collinearity. Rather, we compared the log likelihoods of the nested models using a likelihood ratio test. Similar to the stepwise haplotype analysis, at each stage, the marker producing the greatest increase in the LRT was added to the model (provided that adding the marker significantly improved the model, P < 0.05).
Electronic database information
LAMP software for estimating MOD scores and fitting parametric association models in samples including unrelated individuals and/or family data is available online at http://www.sph.umich.edu/csg/abecasis/LAMP/.
Supplementary Material
Acknowledgments
We acknowledge the participation of members of AMD-affected families and of numerous clinicians and clinical staff members, without whose generous assistance and dedication this work would not be possible. We also thank M. Boehnke and R. Spielman for comments on early versions of the manuscript, S. Gabriel and L. Ziagra at the Broad Institute/National Center for Research Resources Genotyping Center for generating the genotype data and for stimulating discussions, R. Lyons at the University of Michigan Sequencing facility for help with DNA sequencing and S. Ferrara for administrative support. This research was supported by grants from the US National Institutes of Health, The Foundation Fighting Blindness, the Elmer and Sylvia Sramek Foundation and Research to Prevent Blindness (RPB). A.S. is Harold F. Falls Collegiate Professor and a recipient of an RPB Senior Scientific Investigator award. G.R.A. is a Pew Scholar for the Biomedical Sciences. P.A.-S. was supported in part by a scholarship from TUBITAK.
Footnotes
Reprints and permissions information is available online at http://npg.nature.com/reprintsandpermissions/
Note: Supplementary information is available on the Nature Genetics website.
AUTHOR CONTRIBUTIONS M.L., Y.L. and L.L. carried out the statistical analyses. P.A.-S., M.O., K.E.H.-B., R.K.M.S.W. and S.Z. were responsible for execution of experiments and for sample preparation and collection. A.S. and G.R.A. conceived and directed the study.
References
- 1.Majewski J, et al. Age-related macular degeneration–a genome scan in extended families. Am J Hum Genet. 2003;73:540–550. doi: 10.1086/377701. [DOI] [PMC free article] [PubMed] [Google Scholar]
- 2.Abecasis GR, et al. Age-related macular degeneration: a high-resolution genome scan for susceptibility loci in a population enriched for late-stage disease. Am J Hum Genet. 2004;74:482–494. doi: 10.1086/382786. [DOI] [PMC free article] [PubMed] [Google Scholar]
- 3.Weeks DE, et al. Age-related maculopathy: an expanded genome-wide scan with evidence of susceptibility loci within the 1q31 and 17q25 regions. Am J Ophthalmol. 2001;132:682–692. doi: 10.1016/s0002-9394(01)01214-4. [DOI] [PubMed] [Google Scholar]
- 4.Seddon JM, Santangelo SL, Book K, Chong S, Cote J. A genomewide scan for age-related macular degeneration provides evidence for linkage to several chromosomal regions. Am J Hum Genet. 2003;73:780–790. doi: 10.1086/378505. [DOI] [PMC free article] [PubMed] [Google Scholar]
- 5.Fisher SA, et al. Meta-analysis of genome scans of age-related macular degeneration. Hum Mol Genet. 2005;14:2257–2264. doi: 10.1093/hmg/ddi230. [DOI] [PubMed] [Google Scholar]
- 6.Hirvela H, Luukinen H, Laara E, Sc L, Laatikainen L. Risk factors of age-related maculopathy in a population 70 years of age or older. Ophthalmology. 1996;103:871–877. doi: 10.1016/s0161-6420(96)30593-9. [DOI] [PubMed] [Google Scholar]
- 7.Smith W, et al. Risk factors for age-related macular degeneration: Pooled findings from three continents. Ophthalmology. 2001;108:697–704. doi: 10.1016/s0161-6420(00)00580-7. [DOI] [PubMed] [Google Scholar]
- 8.Klein R, Klein BE, Tomany SC, Moss SE. Ten-year incidence of age-related maculopathy and smoking and drinking: the Beaver Dam Eye Study. Am J Epidemiol. 2002;156:589–598. doi: 10.1093/aje/kwf092. [DOI] [PubMed] [Google Scholar]
- 9.Schmidt S, et al. Cigarette smoking strongly modifies the association of LOC387715 and age-related macular degeneration. Am J Hum Genet. 2006;78:852–864. doi: 10.1086/503822. [DOI] [PMC free article] [PubMed] [Google Scholar]
- 10.Klein RJ, et al. Complement factor H polymorphism in age-related macular degeneration. Science. 2005;308:385–389. doi: 10.1126/science.1109557. [DOI] [PMC free article] [PubMed] [Google Scholar]
- 11.Haines JL, et al. Complement factor H variant increases the risk of age-related macular degeneration. Science. 2005;308:419–421. doi: 10.1126/science.1110359. [DOI] [PubMed] [Google Scholar]
- 12.Edwards AO, et al. Complement factor H polymorphism and age-related macular degeneration. Science. 2005;308:421–424. doi: 10.1126/science.1110189. [DOI] [PubMed] [Google Scholar]
- 13.Jakobsdottir J, et al. Susceptibility genes for age-related maculopathy on chromosome 10q26. Am J Hum Genet. 2005;77:389–407. doi: 10.1086/444437. [DOI] [PMC free article] [PubMed] [Google Scholar]
- 14.Rivera A, et al. Hypothetical LOC387715 is a second major susceptibility gene for age-related macular degeneration, contributing independently of complement factor H to disease risk. Hum Mol Genet. 2005;14:3227–3236. doi: 10.1093/hmg/ddi353. [DOI] [PubMed] [Google Scholar]
- 15.Zareparsi S, et al. Strong association of the Y402H variant in complement factor H at 1q32 with susceptibility to age-related macular degeneration. Am J Hum Genet. 2005;77:149–153. doi: 10.1086/431426. [DOI] [PMC free article] [PubMed] [Google Scholar]
- 16.Li M, Boehnke M, Abecasis GR. Joint modeling of linkage and association: identifying SNPs responsible for a linkage signal. Am J Hum Genet. 2005;76:934–949. doi: 10.1086/430277. [DOI] [PMC free article] [PubMed] [Google Scholar]
- 17.Li M, Boehnke M, Abecasis GR. Efficient study designs for test of genetic association using sibship data and unrelated cases and controls. Am J Hum Genet. 2006;78:778–792. doi: 10.1086/503711. [DOI] [PMC free article] [PubMed] [Google Scholar]
- 18.Risch N. Linkage strategies for genetically complex traits. I Multilocus models. Am J Hum Genet. 1990;46:222–228. [PMC free article] [PubMed] [Google Scholar]
- 19.Hodge SE, Elston RC. Lods, wrods, and mods: the interpretation of lod scores calculated under different models. Genet Epidemiol. 1994;11:329–342. doi: 10.1002/gepi.1370110403. [DOI] [PubMed] [Google Scholar]
- 20.Valdes AM, Thomson G. Detecting disease-predisposing variants: the haplotype method. Am J Hum Genet. 1997;60:703–716. [PMC free article] [PubMed] [Google Scholar]
- 21.Zaykin DV, et al. Testing association of statistically inferred haplotypes with discrete and continuous traits in samples of unrelated individuals. Hum Hered. 2002;53:79–91. doi: 10.1159/000057986. [DOI] [PubMed] [Google Scholar]
- 22.Stephens M, Smith NJ, Donnelly P. A new statistical method for haplotype reconstruction from population data. Am J Hum Genet. 2001;68:978–989. doi: 10.1086/319501. [DOI] [PMC free article] [PubMed] [Google Scholar]
- 23.Li N, Stephens M. Modeling linkage disequilibrium and identifying recombination hotspots using single-nucleotide polymorphism data. Genetics. 2003;165:2213–2233. doi: 10.1093/genetics/165.4.2213. [DOI] [PMC free article] [PubMed] [Google Scholar]
- 24.The International HapMap Consortium. The International HapMap Project. Nature. 2005;437:1299–1320. [Google Scholar]
- 25.Monks SA, et al. Genetic inheritance of gene expression in human cell lines. Am J Hum Genet. 2004;75:1094–1105. doi: 10.1086/426461. [DOI] [PMC free article] [PubMed] [Google Scholar]
- 26.Bird AC, et al. An international classification and grading system for age-related maculopathy and age-related macular degeneration. The International ARM Epidemiological Study Group. Surv Ophthalmol. 1995;39:367–374. doi: 10.1016/s0039-6257(05)80092-x. [DOI] [PubMed] [Google Scholar]
- 27.Wigginton JE, Cutler DJ, Abecasis GR. A note on exact tests of Hardy-Weinberg equilibrium. Am J Hum Genet. 2005;76:887–883. doi: 10.1086/429864. [DOI] [PMC free article] [PubMed] [Google Scholar]
- 28.Abecasis GR, Martin R, Lewitzky S. Estimation of haplotype frequencies from diploid data. Am J Hum Genet. 2001;69:S198. [Google Scholar]
- 29.Abecasis GR, Cookson WOC. GOLD—graphical overview of linkage disequilibrium. Bioinformatics. 2000;16:182–183. doi: 10.1093/bioinformatics/16.2.182. [DOI] [PubMed] [Google Scholar]
- 30.Stephens M, Scheet P. Accounting for decay of linkage disequilibrium in haplotype inference and missing-data imputation. Am J Hum Genet. 2005;76:449–462. doi: 10.1086/428594. [DOI] [PMC free article] [PubMed] [Google Scholar]
Associated Data
This section collects any data citations, data availability statements, or supplementary materials included in this article.