

Abstract
OBJECTIVES
To examine the association between 2-year weight change and onset of lower body disability over time in older Mexican Americans.
DESIGN
Data were from the Hispanic Established Population for the Epidemiological Study of the Elderly (1993–2001). Weight change was examined by comparing baseline weight to weight at 2-year follow-up. Incidence of lower body disability was studied from the end of this period through an additional 5 years.
SETTING
Five southwestern states: Texas, New Mexico, Colorado, Arizona, and California.
PARTICIPANTS
One thousand seven hundred thirty-seven noninstitutionalized Mexican-American men and women aged 65 and older who reported no limitation in activities of daily living (ADLs) and were able to perform the walk test at 2-year follow-up.
MEASUREMENTS
In-home interviews assessed sociodemographic factors, self-reported physician diagnoses of medical conditions (arthritis, diabetes mellitus, heart attack, stroke, hip fracture, and cancer), self-reported ADLs, depressive symptoms, and number of hospitalizations. Cognitive function, handgrip muscle strength, and body mass index (BMI) were obtained. The outcomes were any limitation of lower body ADL (walking across a small room, bathing, transferring from a bed to a chair, and using the toilet) and limitation on the walk test over subsequent 5-year follow-up period. General Estimation Equation (GEE) was used to estimate lower body disability over time.
RESULTS
Weight change of 5% or more occurred in 42.3% of the participants; 21.7% lost weight, 20.6% gained weight, and 57.7% had stable weight. Using GEE analysis, with stable weight as the reference, weight loss of 5% or more was associated with greater risk of any lower body ADL limitation (odds ratio (OR) = 1.43, 95% confidence interval (CI) = 1.06–1.95) and walking limitation (OR = 1.35, 95% CI = 1.03–1.76) after controlling for sociodemographic variables and BMI at baseline. Weight gain of 5% or more was associated with greater risk of any lower body ADL limitation (OR = 1.39, 95% CI = 1.02–1.89), after controlling for sociodemographic variables and BMI at baseline. When medical conditions, handgrip muscle strength, high depressive symptomatology, cognitive function, and hospitalization were added to the equation, the relationship between 2-year weight change (>5% loss or >5% gain) and lower body disability decreased.
CONCLUSION
Health conditions and muscle strength partially mediate the association between weight loss or gain and future loss of ability to walk and independently perform ADLs.
Keywords: weight change, ADL disability, walking, Mexican Americans
High body mass index (BMI) has been shown to be associated with diseases such as diabetes mellitus, hypertension, heart disease, cancer, osteoarthritis, sleep apnea, and gallbladder disease.1,2 Similarly, high BMI has been positively associated with prevalent disability,3–5 new disability,6–9 short-term risk for developing problems in physical functioning,10 and mortality.11 The prevalence of obesity increases with age in men and women, with higher rates in women.12–14 Blacks and Hispanics have higher rates of obesity than do whites, especially women.12–14 After the age of 60, most men and women begin to lose weight.15–17 Although a vast literature exists on the adverse health effects of obesity,1–11 the relationship between weight change and subsequent disability remains unclear in older people, with some studies reporting adverse effects and others reporting salutary effects of weight change on the disablement process in older people.10,11
Observational studies suggest that weight change (gain, loss, and fluctuations) are predictors of health outcomes in older people.9,18–28 For example, weight gain has been associated with higher incidence of heart disease, stroke, diabetes mellitus, and mortality.18,19,23 Weight loss has been associated with disability and mortality9,19,20,22,25–30 The few studies examining disability outcomes have been limited to women and non-Hispanic whites and have employed self-report measures of disability.9,20,21,24
The few studies of older Mexican Americans have shown a high prevalence of obesity-related complications such as diabetes mellitus, arthritis, pain on weight bearing, and hypertension,31–35 but little is known about the effect of weight change on disability in this rapidly growing segment of older people in the United States. Data from the Hispanic Established Population for the Epidemiological Study of the Elderly (EPESE) were used to examine the relationship between 2-year weight change and incidence of lower body disability over a 5-year follow-up period in older Mexican-American men and women. It was hypothesized that weight change would be associated with greater risk of lower body disability in older Mexican Americans and that this association would be mediated through health conditions and muscle strength.
METHODS
Sample and Procedures
Data were from the Hispanic EPESE, a longitudinal study of Mexican Americans aged 65 and older. The Hispanic EPESE was modeled after a previous EPESE conducted in New Haven, Connecticut; East Boston, Massachusetts; rural Iowa; and North Carolina.36 Subjects were selected from five southwestern states (Texas, California, Arizona, Colorado, and New Mexico) using area probability sampling procedures. The sample and its characteristics have been described elsewhere.31,32 The sampling procedure assured a sample that is generalizable to approximately 500,000 older Mexican Americans living in the southwest.31,32 In-home interviews were conducted in Spanish or English depending on the respondent’s preference. The response rate was 83%, which was comparable with that of the other EPESE studies.31,32 At the time of the baseline assessment during 1993/94, 2,873 subjects (94.2%) were interviewed in person, and 177 (5.8%) were interviewed by proxy. The present study used baseline data (1993/94), and data obtained from 2-year (1995/96), 5-year (1998/99), and 7-year (2000/01) follow-up assessments.
Study Design
Weight change was examined by comparing baseline weight to weight at 2-year follow-up. Incidence of lower body disability was examined from the end of this period (1995/96) through an additional 5 years (2000/01). Of the 3,050 subjects interviewed at baseline, 2,037 had complete data on weight (baseline and 2-year follow-up), 94 had no weight data at baseline and at 2-year follow-up; 308 had missing data on weight at baseline or at the 2-year follow-up; 235 were confirmed dead through the National Death Index and reports from relatives at 2-year follow-up (1995/96); and 376 refused to be reinterviewed or were to lost follow-up by 1995/96. Subjects who died by the end of the 2-year follow-up and those with incomplete data on weight were significantly more likely to be older; to have ever had a heart attack, diabetes mellitus, stroke, hip fracture, cancer, and high depressive symptoms; and to be disabled at baseline than those with complete data on weight. Similarly, they were significantly more likely to have a lower BMI, lower body weight, lower handgrip muscle strength, and a lower cognitive function score at baseline than those included in the study.
Thus, the final sample included 1,737 subjects who reported no limitation in four activities of daily living (ADLs: walking across a small room, bathing, transferring from a bed to a chair, and using the toilet), were able to perform the walking test, and were reinterviewed during the follow-up period. At end of the 7-year follow-up (2000/01), 1,246 subjects were reinterviewed, 164 subjects refused to be re-interviewed or were lost to follow-up, and 327 subjects were confirmed dead through the National Death Index and reports from relatives.
Weight Assessment
Weight was measured using a calibrated Metro 9800 measuring scale (Creative Health Products, Plymouth, MI). Weight change was assessed by comparing baseline weight to weight at first follow-up (2-years).
Subjects were grouped in three categories. Weight stable was defined as weight within ± 5% of the baseline weight, weight loss as a decrease of 5% or more since baseline, and weight gain as an increase of 5% or more since baseline. Stable weight was used as the reference category.
Lower Body Disability
Respondents were asked whether they could perform four ADLs37 without help, with help, or were unable to do the activities. Lower body ADL limitation was dichotomized as no help needed versus needing help with or unable to perform one or more ADL activities.
Mobility was assessed using an 8-foot walk at a normal pace timed to the nearest second. Scores were divided into approximate quartiles. A time of 9.0 seconds or more received a score of 1, 6.0 to 8.0 seconds a score of 2, 4.0 to 5.0 seconds a score of 3, and 3.0 seconds or less a score of 4; higher scores indicate faster walking speed.38,39 Walking limitation was defined as being unable to walk or walking at a speed of 9.0 seconds or more.
Covariates
All covariates were obtained from the 2-year follow-up interview. Sociodemographic variables included age, sex, years of formal education, and marital status. The presence of medical conditions was assessed by asking whether a doctor had ever told respondents that they had diabetes mellitus, arthritis, heart attack, stroke, hip fracture, or cancer. Depressive symptomatology was measured using the Center for Epidemiologic Studies Depression Scale.40 Persons scoring 16 or higher were considered to experience high depressive symptomatology.41 Cognitive function was assessed using the Mini-Mental State Examination.42,43 Scores have a potential range of 0 to 30, with lower scores indicating poorer cognitive ability. BMI was computed by dividing measured weight in kilograms by height in meters squared (kg/m2); grip strength was measured in kilograms using a handheld dynamometer (Jaymar Hydraulic Dynamometer, Model #5030J1, J.A. Preston, Corp., Jackson, MS).44 Hospital utilization was assessed using the following question: “Did you experience an illness or injury that required staying overnight or longer in a hospital in the last year” (yes vs no).
Outcome
Development of lower body disability was defined as onset of any lower body ADL limitation (needing help with or unable to perform one or more of the four ADL activities) at the 5- or 7-year follow-up interview, and onset of walking limitation defined as being unable to perform the walking test or a walking time of 9.0 seconds or longer at the 5- or 7-year follow-up interview.
Analysis
Chi-square, analysis of variance and post hoc Tukey test were used to examine the distribution of covariates for subjects by 2-year weight change. General Estimation Equation (GEE)45,46 was used to test whether repeated measures on demographic variables, handgrip muscle strength, medical conditions, depressive symptoms, cognitive function, and hospitalization mediate the relationship between 2-year weight change (5% loss or 5% gain) and lower body disability across time. The GEE methodology provides consistent estimators of the regression coefficients and of their variances under weak assumptions about the actual correlations between a subject’s observations.45,46 This method relies on independence across subjects to consistently estimate the variance of the proposed estimators even when the assumed working correlation structure is incorrect.45,46 All the variables were analyzed as time-dependent covariates (potential to change as time progresses) except variables of sex, education, BMI at baseline, and 2-year weight change. Two regression models assessed these relationships. Model 1 included time, age, sex, years of formal education, marital status, BMI at baseline, and 2-year weight change (>5% loss, >5% gain, and ± 5% stable weight as a reference category). Model 2 included handgrip muscle strength, medical conditions, high depressive symptomatology, cognitive function, and hospitalization, along with the variables in Model 1. The analyses were performed with 1,756 subjects who reported no limitation in ADLs and were able to perform the walking test at the 2-year follow-up interview. Two-year weight change was also analyzed as a continuous variable to investigate whether there was a gradient of risk for disability. Interaction effects between 2-year weight change and all covariates were assessed. All analyses were performed using SAS for Windows, Version 9.1.3 (SAS Institute, Inc., Cary, NC).
RESULTS
Table 1 shows the characteristics of the sample by 2-year weight change in subjects who were not disabled at the 2-year follow-up. Of the 1,737 subjects, 377 (21.7%) lost 5% or more of their initial weight, 357 (20.6%) gained 5% or more of their initial weight, and 1,003 (57.7%) maintained a stable weight. Subjects who lost weight were older and had less education than subjects who maintained a stable weight or gained weight. Subjects who lost weight and those who maintained a stable weight had significantly higher body weight and higher BMI at baseline than those who gained weight. Subjects who gained weight had significantly higher body weight and higher BMI at 2-year follow-up than those who lost or maintained a stable weight. Subjects who lost weight were significantly more likely to report cancer and to have a lower cognitive function score than those who gained weight or maintained a stable weight. Subjects with stable weight were significantly more likely to report arthritis than those who lost or gained weight. There were no significant differences by sex, marital status, handgrip muscle strength, diabetes mellitus, heart attack, stroke, hip fracture, or high depressive symptomatology.
Table 1.
Descriptive Sample Characteristics by 2-Year Weight Change in Older Nondisabled Mexican Americans at 2-Year Follow-Up (N = 1,737)
| Explanatory variables | >5% loss | ± Stable | >5% gain |
|---|---|---|---|
| Total, n (%) | 377 (21.7) | 1,003 (57.7) | 357 (20.6) |
| Age, mean ± SD* | 75.1 ± 6.2 | 73.9 ± 5.5 | 73.1 ± 5.5 |
| Sex, n (%) | |||
| Male | 169 (44.8) | 425 (42.4) | 141 (39.5) |
| Female | 208 (55.2) | 578 (57.6) | 216 (60.5) |
| Married, n (%) | 202 (53.5) | 548 (54.6) | 203 (56.9) |
| Education, years, mean ± SD† | 4.5 ± 3.7 | 5.2 ± 4.1 | 5.0 ± 3.8 |
| Weight, pounds, at baseline, mean ± SD* | 161.3 ± 30.2 | 160.3 ± 30.4 | 151.2 ± 29.0 |
| Weight, pounds, at the 2-year follow-up, mean ± SD* | 143.2 ± 27.6 | 160.0 ± 30.5 | 168.6 ± 31.6 |
| 2-year weight change, mean ± SD* | − 11.1 ± 6.2 | − 0.2 ± 2.7 | 11.9 ± 9.8 |
| BMI at baseline, kg/m2, mean ± SD* | 28.1 ± 5.0 | 28.3 ± 4.9 | 26.9 ± 4.8 |
| BMI at 2-year follow-up, kg/m2, mean ± SD* | 25.2 ± 4.4 | 28.3 ± 4.9 | 30.0 ± 5.4 |
| Hand grip strength, kg, mean ± SD | 24.1 ± 8.2 | 25.0 ± 8.5 | 24.3 ± 8.5 |
| Medical conditions, n (%) | |||
| Arthritis† | 145 (38.5) | 458 (45.7) | 154 (43.1) |
| Diabetes mellitus | 96 (25.5) | 269 (26.8) | 92 (25.8) |
| Heart attack | 36 (9.6) | 78 (7.8) | 33 (9.2) |
| Stroke | 23 (6.1) | 60 (5.9) | 20 (5.6) |
| Hip fracture | 4 (1.1) | 7 (0.7) | 4 (1.1) |
| Cancer† | 31 (8.2) | 70 (7.0) | 14 (3.9) |
| Hospitalization, yes, n (%) | 54 (14.3) | 147 (14.7) | 59 (16.5) |
| Mini-Mental State Examination score, mean ± SD* | 23.5 ± 4.5 | 24.6 ± 4.2 | 24.0 ± 4.2 |
| Center for Epidemiologic Studies Depression Scale score, mean ± SD | 5.7 ± 7.0 | 6.0 ± 7.5 | 6.4 ± 7.7 |
Note: Chi-square, analysis of variance, and post hoc Tukey tests were used.
P<.001,
.01.
SD = standard deviation; BMI = body mass index.
Figure 1 presents the status of the sample at 5-year follow-up of subjects not disabled at baseline. Of the 377 subjects who lost 5% or more of their initial weight, 124 (32.9%) remained nondisabled, 89 (23.6%) became disabled based on one or two lower body disability measures, 94 (24.9%) died, and 70 (18.6%) were lost to follow-up or refused to be reinterviewed. Of the 1,003 subjects who maintained their initial weight, 427 (42.6%) remained nondisabled, 211 (21.0%) became disabled based on one or two lower body disability measures, 187 (18.7%) died, and 178 (17.7%) were lost to follow-up or refused to be reinterviewed. Of the 357 subjects who gained 5% or more of their initial weight, 156 (43.7%) remained nondisabled, 84 (23.5%) became disabled based on one or two lower body disability measures, 46 (12.9%) died, and 71 (19.9%) were lost to follow-up or refused to be reinterviewed.
Figure 1.
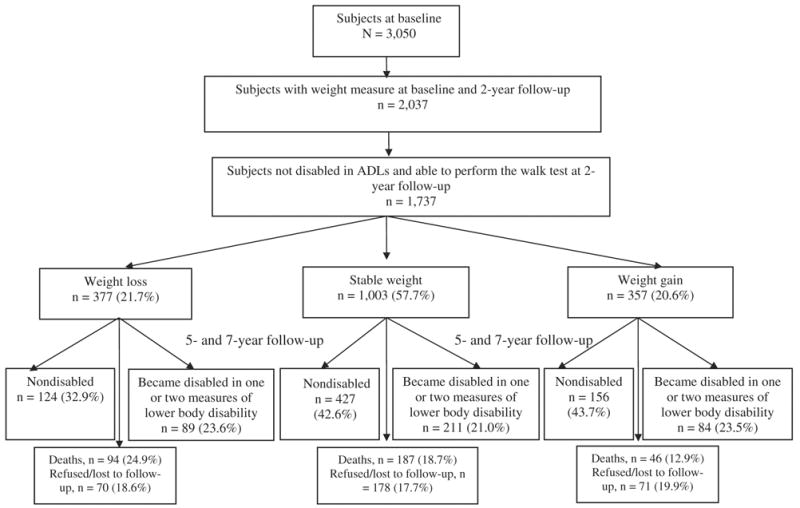
Status of the sample of nondisabled older Mexican Americans at end of follow-up.
Table 2 presents the GEE models for any lower body ADL limitation as a function of 2-year weight change in nondisabled older Mexican Americans at 2-year follow-up. In Model 1, the odds ratio (OR) of any lower body ADL limitation, using stable weight as the reference category and after controlling for time, age, sex, education, marital status, and BMI at baseline, was 1.43 (95% confidence interval (CI) = 1.06–1.95) for subjects who lost 5% or more of their initial weight and 1.39 (95% CI = 1.02–1.89) for subjects who gained 5% or more of their initial weight. In Model 2, after hand grip muscle strength, medical conditions, high depressive symptomatology, cognitive function, and history of hospitalization were added to the variables in Model 1, the OR of any lower body ADL limitation was 1.28 (95% CI = 0.86–1.84) for subjects who lost 5% or more of their initial weight and 1.33 (95% CI = 0.93–1.91) for subjects who gained 5% or more of their initial weight. Other factors, such as time, older age, arthritis, diabetes mellitus, hip fracture, history of hospitalization, and high depressive symptomatology, were associated with greater risk of incidence of any lower body ADL limitation over time. Being male and having high handgrip muscle strength and high cognitive function were factors associated with lower risk of becoming disabled over time. No significant interaction effects were found between 2-year weight change (5% loss or 5% gain) and time, age, sex, marital status, hand grip muscle strength, BMI at baseline, medical conditions, high depressive symptomatology, cognitive function, or history of hospitalization on 5-year incidence of any lower body ADL limitation. The OR of any lower body ADL limitation as a function of 2-year weight change as a continuous variable was 1.00 (95% CI = 0.99–1.02) in Model 1 and 1.01 (95% CI = 0.99–1.03) in Model 2.
Table 2.
General Estimation Equations for Any Lower Body ADL Limitation as a Function of 2-Year Weight Change in Nondisabled Subjects at 2-Year Follow-Up (N = 1,737)
| Model 1 | Model 2 | |
|---|---|---|
| Explanatory Variable | Odds Ratio (95% Confidence Interval) | |
| >5% weight loss | 1.43 (1.06–1.95) | 1.28 (0.86–1.84) |
| Stable weight ± 5% | 1.00 | 1.00 |
| >5% weight gain | 1.39 (1.02–1.89) | 1.33 (0.93–1.91) |
| Time, years | 1.21 (1.11–1.31) | 1.22 (1.08–1.38) |
| Age | 1.10 (1.07–1.12) | 1.04 (1.01–1.07) |
| Female | 1.41 (1.06–1.86) | 0.51 (0.34–0.78) |
| Married | 0.74 (0.58–0.95) | 0.84 (0.62–1.13) |
| Education, years | 0.98 (0.95–1.02) | 1.04 (0.99–1.08) |
| Body mass index, kg/m2, at baseline | 1.02 (0.99–1.05) | 1.03 (0.99–1.06) |
| Handgrip strength, kg | 0.90 (0.88–0.92) | |
| Medical conditions | ||
| Arthritis | 1.64 (1.24–2.18) | |
| Diabetes mellitus | 1.80 (1.32–2.46) | |
| Heart attack | 1.30 (0.77–2.22) | |
| Stroke | 1.67 (0.96–2.87) | |
| Hip fracture | 2.59 (1.21–5.55) | |
| Cancer | 1.34 (0.81–2.20) | |
| Hospitalization, yes | 2.37 (1.80–3.12) | |
| Mini-Mental State Examination score | 0.95 (0.92–0.98) | |
| Center for Epidemiologic Studies Depression Scale score | 1.03 (1.02–1.05) | |
Table 3 presents the GEE models for any walking limitation as a function of 2-year weight change in nondisabled older Mexican Americans at 2-year follow-up. In Model 1, the OR of any walking limitation, using stable weight as a reference category and after controlling for time, age, sex, years of formal education, marital status, and BMI at baseline, was 1.35 (95% CI = 1.03–1.76) for subjects who lost 5% or more of their initial weight and 1.23 (95% CI = 0.93–1.64) for subjects who gained 5% or more of their initial weight. In Model 2, the OR of any walking limitation, after controlling for variables in Model 1 plus handgrip muscle strength, medical conditions, high depressive symptomatology, cognitive function, and history of hospitalization, was 1.28 (95% CI = 0.93–1.76) for subjects who lost 5% or more of their initial weight and 1.24 (95% CI = 0.91–1.70) for subjects who gained 5% or more of their initial weight. Other factors, such as older age, high BMI at baseline, diabetes mellitus, hip fracture, high depressive symptomatology, and history of hospitalization, were associated with greater risk of walking limitation over time, whereas being male and having high handgrip muscle strength and high cognitive function were associated with lower risk of walking limitation over time. No significant interaction effects were found between 2-year weight change (5% loss or 5% gain) and time, age, sex, marital status, hand grip muscle strength, BMI at baseline, medical conditions, high depressive symptomatology, cognitive function, and history of hospitalization on 5-year incidence of walking limitation. The OR of any walking limitation as a function of 2-year weight change in percent as a continuous variable was 1.00 (95% CI = 0.98–1.01) in Model 1 and 1.00 (95% CI = 0.98–1.02) in Model 2.
Table 3.
General Estimation Equations for Walking Limitation as a Function of 2-Year Weight Change in Nondisabled Subjects at 2-Year Follow-Up (N = 1,737)
| Model 1 | Model 2 | |
|---|---|---|
| Explanatory Variable | Odds Ratio (95% Confidence Interval) | |
| >5% weight loss | 1.35 (1.03–1.76) | 1.28 (0.93–1.76) |
| Stable ± 5 % | 1.00 | 1.00 |
| >5% weight gain | 1.23 (0.93–1.64) | 1.24 (0.91–1.70) |
| Time, years | 1.07 (1.00–1.17) | 1.04 (0.93–1.16) |
| Age | 1.10 (1.07–1.12) | 1.05 (1.03–1.08) |
| Female | 1.28 (1.00–1.63) | 0.47 (0.34–0.65) |
| Married | 0.81 (0.65–1.03) | 0.93 (0.71–1.22) |
| Education, years | 0.98 (0.96–1.01) | 1.00 (0.97–1.04) |
| Body mass index, kg/m2, at baseline | 1.04 (1.01–1.06) | 1.04 (1.01–1.07) |
| Handgrip strength, kg | 0.91 (0.89–0.93) | |
| Medical conditions | ||
| Arthritis | 1.22 (0.95–1.57) | |
| Diabetes mellitus | 1.42 (1.10–1.84) | |
| Heart attack | 0.80 (0.49–1.29) | |
| Stroke | 1.19 (0.71–1.98) | |
| Hip fracture | 4.12 (2.09–8.12) | |
| Cancer | 1.08 (0.71–1.65) | |
| Hospitalization, yes | 1.90 (1.47–2.46) | |
| Mini-Mental State Examination score | 0.97 (0.95–0.99) | |
| Center for Epidemiologic Studies Depression Scale score | 1.03 (1.02–1.04) | |
DISCUSSION
This prospective cohort study showed that, in nondisabled older Mexican Americans, 2-year weight change of 5% or greater occurred in 42.3% of the participants; 21.7% lost weight, 20.6% gained weight, and 57.7% had stable weight. Weight loss of 5% or more was associated with several factors reflecting poorer health. Weight loss of 5% or more was associated with a greater risk of any lower body ADL limitation and walking limitation, after controlling for sociodemographic variables and BMI at baseline, but when medical conditions, handgrip muscle strength, high depressive symptomatology, cognitive function, and hospitalization were added to the equation, the relationship between weight loss and lower body ADL limitation and walking limitation decreased. Similarly, weight gain of 5% or more was associated with a greater risk of any lower body ADL limitation after controlling for sociodemographic variables and BMI at baseline, but when medical conditions, handgrip muscle strength, high depressive symptomatology, cognitive function, and hospitalization were added to the equation, the relationship between weight gain and lower body ADL limitation decreased.
One theoretical mechanisms that may explain these findings is through health conditions such as arthritis, diabetes mellitus, cardiovascular disease,1,2 and functional impairments.3–10 In other words, a nondisabled subject who lost or gained weight might be acquiring medical conditions and impairments well known to be associated with disability. It has been suggested that the association between weight loss and disability is due to an association between weight loss and decline of health status and increased comorbidities.9,21 It has also been suggested that inadequate intake of protein and energy, which in turn can lead to micronutrient deficiencies and loss of muscle mass, may explain the weight loss/disability association.29,47–50 In that scenario, the known association between loss of muscle mass, muscle strength, increased comorbidities, and incident disability9,21,47–50 may be the possible mediator for these findings. Next, weight loss, one of the manifestations of the syndrome of frailty, which also includes gait speed, may just be an earlier manifestation of the early stages of development of mobility disability, such that, with less physical activity and food intake, coupled with easy exhaustion, there is further decline in body mass and subsequent mobility disability with time.29 There were no data on food intake and physical activity in this study, factors that could potentially explain some of the findings.
These findings are consistent with some prior studies of increased incident disability with weight loss or weight gain in older people and different from others.9,20–22 For instance, one study found that women aged 60 and older who experienced weight loss of 5% or more had a greater risk of mobility disability than weight-stable women.9 Another also found that weight loss of 3% or more in women aged 75 and older was associated with greater risk of becoming dependent in ADLs than in women who maintained their weight.21 Another study found that weight loss of 20 pounds was associated with significant improvements in overweight women aged 65 and older but with worse physical function in women with a BMI of less than 25 kg/m2.20
In a community-based study of 763 Hispanic men and women aged 60 and older in Massachusetts, primarily of Puerto Rican and Dominican origin, weight loss and weight gain were associated with greater risk of self-reported limitations in ADLs, after adjustments were made for relevant confounders.22 Using data from the Health and Retirement Study, one study found that young old adults who gained more than 5% of their BMI were more likely to experience onset of lower body mobility impairment.24
This study has some limitations in addition to lack of data on physical activity, food status, and blood measures. First, it was not possible to differentiate intentional weight loss or weight gain from unintentional weight loss or weight gain. However, in older people, research has shown that unintentional and intentional weight loss are predictive of adverse health outcomes and greater risk of mortality.51 Second, the assessments of ADL and mobility tasks were obtained by self-report. Although several studies have demonstrated a high concordance between self-reported data and direct observations of ADL performance,52 possible bias inherent with self reports was compensated for by using a performance-based measure (the 8-foot walk test) as an additional measure of lower body function. Third, by including subjects in the sample who completed the survey in 1995/96, 1998/99, and 2000/01, a healthier group of older Mexican Americans was examined. This, theoretically, could underestimate the effect of weight change, particularly weight loss, on the onset of lower body disability because subjects who lose weight are frailer and, as a result, may experience the onset of disability before attritition. Finally, despite adjustments for baseline BMI, the results may be partially attributed to regression toward the mean.
This study has several strengths. First, it included a large community-based sample of older Mexican Americans, a rapidly growing segment of the older population in the United States. Second, it used objective assessments of anthropometric measures and the use of observed 8-foot walk test to assess lower body function. Third, the possible mediation effect of comorbidities and muscle strength between weight change and lower body disability was explored. Fourth, the GEEs, an analytic approach that allowed the use of all available data and evaluation of time-dependent effects, were used.
In conclusion, this study found that change in body weight (gain or loss) in initially nondisabled older Mexican Americans was significantly predictive of subsequent lower body disability over 5 years, independent of sociodemographic variables and BMI at baseline, and that health conditions and muscle strength partially mediated the association. A better understanding of the role of weight change in the disablement process in older people is an important step toward early identification of those older people at highest risk of disability and loss of independence. Weight loss may be an indirect marker of sarcopenia and a direct marker for incident of obesity and comorbidities in this population. Thus, potential modifiable risk factors for weight fluctuations should be identified and treated to decrease or slow the onset of disability, reduce medical care costs, and improve the health and quality of life of older Mexican Americans.
Acknowledgments
This study was supported by Grants AG10939 and AG17638 from the National Institute on Aging and in part by the University of Texas Medical Branch Center for Population Health and Health Disparities (5P50CA105631). Dr. Raji’s work is supported by the Bureau of Health Professions’ Geriatric Academic Career Award 1 K01 HP 00034–01.
Financial Disclosure: None.
Author Contributions: Soham Al Snih, MD: content, concept and design, acquisition of data, analysis and interpretation of the data, drafting of the manuscript, statistical expertise, supervision. Mukaila A. Raji, MD: content, concept and design, analysis and interpretation of the data, supervision. Kyriakos S. Markides, PhD, and Kenneth J. Ottenbacher, PhD: content, concept and design, acquisition of data, analysis and interpretation of the data, obtaining funding, supervision. James S. Goodwin, MD: content, concept and design, analysis and interpretation of the data, obtaining funding, supervision.
Sponsor’s Role: Had no role in the design, methods, subject recruitment, data collections, analysis, or preparation of paper.
Footnotes
Preliminary results of the study were presented as a poster at the 2004 annual meeting of the American Geriatrics Society in Las Vegas.
References
- 1.Bray GA. Medical consequences of obesity. J Clin Endocrinol Metab. 2004;89:2583–2589. doi: 10.1210/jc.2004-0535. [DOI] [PubMed] [Google Scholar]
- 2.Cossrow N, Falkner B. Race/ethnicity issues in obesity and obesity-related comorbidities. J Clin Endocrinol Metab. 2004;89:2590–2594. doi: 10.1210/jc.2004-0339. [DOI] [PubMed] [Google Scholar]
- 3.Okoro CA, Hootman JM, Strine TW, et al. Disability, arthritis, and body weight among adults 45 years and older. Obes Res. 2004;12:854–861. doi: 10.1038/oby.2004.103. [DOI] [PubMed] [Google Scholar]
- 4.Marcus DA. Obesity and the impact of chronic pain. Clin J Pain. 2004;20:186–191. doi: 10.1097/00002508-200405000-00009. [DOI] [PubMed] [Google Scholar]
- 5.Weil E, Wachterman M, McCarthy EP, et al. Obesity among adults with disabling conditions. JAMA. 2002;11:1265–1268. doi: 10.1001/jama.288.10.1265. [DOI] [PubMed] [Google Scholar]
- 6.Galanos AN, Pieper CF, Cornoni-Huntley JC, et al. Nutrition and function: Is there a relationship between body mass index and the functional capabilities of community-dwelling elderly? J Am Geriatr Soc. 1994;42:368–373. doi: 10.1111/j.1532-5415.1994.tb07483.x. [DOI] [PubMed] [Google Scholar]
- 7.Jensen GL, Friedmann JM. Obesity is associated with functional decline in community-dwelling rural older persons. J Am Geriatr Soc. 2002;50:918–923. doi: 10.1046/j.1532-5415.2002.50220.x. [DOI] [PubMed] [Google Scholar]
- 8.Ferraro KF, Su YP, Gretebeck RJ, et al. Body mass index and disability in adulthood: A 20-year panel study. Am J Public Health. 2002;92:834–840. doi: 10.2105/ajph.92.5.834. [DOI] [PMC free article] [PubMed] [Google Scholar]
- 9.Launer LJ, Harris T, Rumpel C, et al. Body mass index, weight change, and risk of mobility disability in middle-aged and older women: The epidemiologic follow-up study of NHANES I. JAMA. 1994;271:1093–1098. [PubMed] [Google Scholar]
- 10.Sternfeld B, Ngo L, Satariano WA, et al. Associations of body composition with physical performance and self-reported functional limitation in elderly men and women. Am J Epidmiol. 2002;156:110–121. doi: 10.1093/aje/kwf023. [DOI] [PubMed] [Google Scholar]
- 11.Stevens J, Cai J, Pamuk ER, et al. The effect of age on the association between body mass index and mortality. N Engl J Med. 1998;338:1–7. doi: 10.1056/NEJM199801013380101. [DOI] [PubMed] [Google Scholar]
- 12.Stein CJ, Colditz GA. The epidemic of obesity. J Clin Endocrinol Metab. 2004;89:2522–2525. doi: 10.1210/jc.2004-0288. [DOI] [PubMed] [Google Scholar]
- 13.Flegal KM, Carroll MD, Ogden CL, et al. Prevalence and trends in obesity among U.S. adults, 1999–2000. JAMA. 2002;288:1723–1727. doi: 10.1001/jama.288.14.1723. [DOI] [PubMed] [Google Scholar]
- 14.Mokdad AH, Serdula MK, Dietz WH, et al. The spread of the obesity epidemic in the United States, 1991–1998. JAMA. 1999;282:1519–1522. doi: 10.1001/jama.282.16.1519. [DOI] [PubMed] [Google Scholar]
- 15.Williamson DF, Kahn HS, Remington PL, et al. The 10-year incidence of overweight and major weight gain in U.S. adults. Arch Intern Med. 1990;150:665–672. [PubMed] [Google Scholar]
- 16.Williamson DF. National Institutes of health technology assessment conference: Descriptive epidemiology of body weight and weight changes in U.S. adults. Ann Intern Med. 1993;119:646–649. doi: 10.7326/0003-4819-119-7_part_2-199310011-00004. [DOI] [PubMed] [Google Scholar]
- 17.Seidell JC, Visscher TL. Body weight and weight change and their health implications for the elderly. Eur J Clin Nutr. 2000;54:S33–S39. doi: 10.1038/sj.ejcn.1601023. [DOI] [PubMed] [Google Scholar]
- 18.French SA, Folsom AR, Jeffery RW, et al. Weight variability and incident disease in older women. The Iowa Women’s Health Study. Intl J Obesity. 1997;21:217–223. doi: 10.1038/sj.ijo.0800390. [DOI] [PubMed] [Google Scholar]
- 19.Woo J, Ho SC, Sham A. Longitudinal changes in body mass index and body composition over 3 years and relationship to health outcomes in Hong Kong Chinese age 70 and older. J Am Geriatr Soc. 2001;49:737–746. doi: 10.1046/j.1532-5415.2001.49150.x. [DOI] [PubMed] [Google Scholar]
- 20.Fine JT, Coldtiz GA, Coakley EH, et al. A prospective study of weight change and health-related quality of life in women. JAMA. 1999;282:2136–2142. doi: 10.1001/jama.282.22.2136. [DOI] [PubMed] [Google Scholar]
- 21.Tully CL, Snowdon DA. Weight change and physical function among older women: Finding from the Nun Study. J Am Geriatr Soc. 1995;43:1394–1397. doi: 10.1111/j.1532-5415.1995.tb06620.x. [DOI] [PubMed] [Google Scholar]
- 22.Chen H, Bermúdez OI, Tucher KL. Waist circumference and weight change are associated with disability among elderly Hispanics. J Gerontol A Biol Sci Med Sci. 2002;57A:M19–M25. doi: 10.1093/gerona/57.1.m19. [DOI] [PubMed] [Google Scholar]
- 23.Keller HH. Weight gain impacts morbidity and mortality in institutionalized older persons. J Am Geriatr Soc. 1995;43:165–169. doi: 10.1111/j.1532-5415.1995.tb06383.x. [DOI] [PubMed] [Google Scholar]
- 24.Jenkins KR. Weight and physical functioning among old adults. J Aging Health. 2004;16:248–266. doi: 10.1177/0898264303262626. [DOI] [PubMed] [Google Scholar]
- 25.Newman AB, Yanez D, Harris T, et al. Weight change in old age and its association with mortality. J Am Geriatr Soc. 2001;49:1309–1318. doi: 10.1046/j.1532-5415.2001.49258.x. [DOI] [PubMed] [Google Scholar]
- 26.Samaras TT, Storms LH, Elrick H. Longevity, mortality, and body weight. Ageing Res Rev. 2002;1:673–691. doi: 10.1016/s1568-1637(02)00029-6. [DOI] [PubMed] [Google Scholar]
- 27.Mikkelsen KL, Heitmann BL, Keiding N, et al. Independent effects of stable and changing body weight on total mortality. Epidemiology. 1999;10:671–678. [PubMed] [Google Scholar]
- 28.Reynolds MW, Fredman L, Langenberg P, et al. Weight, weight change, and mortality in a random sample of older community-dwelling women. J Am Geriatr Soc. 1999;47:1409–1414. doi: 10.1111/j.1532-5415.1999.tb01558.x. [DOI] [PubMed] [Google Scholar]
- 29.Fried LP, Tangen CM, Waltson J, et al. Frailty in older adults: Evidence for a phenotype. J Gerontol A Biol Sci Med Sci. 2001;56A:M146–M156. doi: 10.1093/gerona/56.3.m146. [DOI] [PubMed] [Google Scholar]
- 30.Morley JE, Perry HM, III, Miller DK. Something about frailty. J Gerontol A Biol Sci Med Sci. 2002;57A:M698–M704. doi: 10.1093/gerona/57.11.m698. [DOI] [PubMed] [Google Scholar]
- 31.Markides KS, Stroup-Benham CA, Goodwin JS, et al. The effect of medical conditions on the functional limitations of Mexican-American elderly. Ann Epidemiol. 1996;6:386–391. doi: 10.1016/s1047-2797(96)00061-0. [DOI] [PubMed] [Google Scholar]
- 32.Markides KS, Stroup-Benham CA, Black S, et al. The Health Mexican American Elderly: Selected findings from the Hispanic EPESE. In: Wykle ML, Ford AB, editors. Serving Minority Elders in the 21st Century. New York: Springer Co., Inc; 1999. pp. 72–90. [Google Scholar]
- 33.Ostir GV, Markides KS, Freeman DH, et al. Obesity and health conditions in elderly Mexican Americans. The Hispanic EPESE Ethnicity Dis. 2000;10:31–38. [PubMed] [Google Scholar]
- 34.Al Snih S, Markides K, Ray L, et al. Prevalence of arthritis in older Mexican Americans. Arthritis Care Res. 2000;13:409–416. doi: 10.1002/1529-0131(200012)13:6<409::aid-art12>3.0.co;2-x. [DOI] [PubMed] [Google Scholar]
- 35.Al Snih S, Markides KS, Ray LA, et al. Impact of pain on weight-bearing on disability among older Mexican Americans. J Gerontol A Biol Sci Med Sci. 2001;56A:M400–M404. doi: 10.1093/gerona/56.7.m400. [DOI] [PubMed] [Google Scholar]
- 36.Cornoni-Huntley J, Brock DB, Ostfeld AM, et al., editors. Established Populations for Epidemiologic Studies of the Elderly, Resource Data Book (NIH Publication no. 86–2443) Bethesda, MD: National Institutes of Health; 1986. [Google Scholar]
- 37.Branch LG, Katz S, Kniepmann K. A prospective study of functional status among community elders. Am J Public Health. 1984;74:266–268. doi: 10.2105/ajph.74.3.266. [DOI] [PMC free article] [PubMed] [Google Scholar]
- 38.Guralnik JM, Ferrucci L, Simonsick EM, et al. Lower-extremity function in persons over the age of 70 years as a predictor of subsequent disability. N Engl J Med. 1995;332:556–561. doi: 10.1056/NEJM199503023320902. [DOI] [PMC free article] [PubMed] [Google Scholar]
- 39.Ostir GV, Markides KS, Black SA, et al. Lower body functioning as a predictor of subsequent disability among older Mexican Americans. J Gerontol A Biol Sci Med Sci. 1998;53A:M1–M5. doi: 10.1093/gerona/53a.6.m491. [DOI] [PubMed] [Google Scholar]
- 40.Radloff LS. The CED-S Scale. A self-report depression scale for research in the general population. J Appl Psychol Meas. 1977;1:385–401. [Google Scholar]
- 41.Boyd JH, Weissman M, Thompson W, et al. Screening for depression in a community sample. Arch Gen Psychiatry. 1982;39:1195–1200. doi: 10.1001/archpsyc.1982.04290100059010. [DOI] [PubMed] [Google Scholar]
- 42.Folstein MF, Folstein SE, McHugh PR. ‘Mini-mental state’. A practical method for grading the cognitive state of patients for the clinician. J Psychiatr Res. 1975;12:189–198. doi: 10.1016/0022-3956(75)90026-6. [DOI] [PubMed] [Google Scholar]
- 43.Bird HR, Canino G, Rubio-Stipec M, et al. Use of the Mini-Mental State Examination in a probability sample of a Hispanic population. J Nerv Ment Dis. 1987;175:731–737. doi: 10.1097/00005053-198712000-00005. [DOI] [PubMed] [Google Scholar]
- 44.Al Snih S, Markides KS, Ray LA, et al. Hand grip strength and mortality in older Mexican Americans. J Am Geriatr Soc. 2002;50:1250–1256. doi: 10.1046/j.1532-5415.2002.50312.x. [DOI] [PubMed] [Google Scholar]
- 45.Zeger SL, Liang KY. Longitudinal data analysis for discrete and continuous outcomes. Biometrics. 1968;73:13–22. [PubMed] [Google Scholar]
- 46.Liang KY, Zeger SL. Longitudinal data analysis using generalized linear models. Biometrika. 1986;73:13–22. [Google Scholar]
- 47.Kallman DA, Plato CC, Tobin JD. The role of muscle strength loss in the age-related decline in grip strength cross-sectional and longitudinal perspectives. J Gerontol. 1990;45:M82–M89. doi: 10.1093/geronj/45.3.m82. [DOI] [PubMed] [Google Scholar]
- 48.Rantanen T, Guralnik JM, Foley D, et al. Midlife hand grip strength as a predictor of old age disability. JAMA. 1999;281:558–560. doi: 10.1001/jama.281.6.558. [DOI] [PubMed] [Google Scholar]
- 49.Giampaoli S, Ferrucci L, Cecchi F, et al. Hand-grip strength predicts incident disability in non-disabled older women. Age Ageing. 1999;28:283–288. doi: 10.1093/ageing/28.3.283. [DOI] [PubMed] [Google Scholar]
- 50.Al Snih S, Markides KS, Ottenbacher KJ, et al. Hand grip strength and incident ADL disability in elderly Mexican Americans over seven year period. Aging Clin Exp Res. 2004;16:481–486. doi: 10.1007/BF03327406. [DOI] [PubMed] [Google Scholar]
- 51.Reife CM. Involuntary weight loss. Med Clin North Am. 1995;79:299–313. doi: 10.1016/s0025-7125(16)30069-4. [DOI] [PubMed] [Google Scholar]
- 52.Reuben DB, Siu AL, Kimpau S. The predictive validity of self-reported and performance-based measures of function and health. J Gerontol. 1992;47:M106–M110. doi: 10.1093/geronj/47.4.m106. [DOI] [PubMed] [Google Scholar]