

Summary
Age-related hearing loss (AHL) typically starts from high frequency regions of the cochlea and over time invades lower frequency regions. During this progressive hearing loss, sound-evoked activity in spiral ganglion cells is reduced. DBA mice have an early onset of AHL. In this study, we examined synaptic transmission at the endbulb of Held synapse between auditory nerve fibers and bushy cells in the anterior ventral cochlear nucleus (AVCN). Synaptic transmission in hearing-impaired high frequency areas of the AVCN was altered in old DBA mice. The spontaneous mEPSC frequency was greatly reduced (∼60%), and mEPSCs were significantly slower (∼115%) and smaller (∼70%) in high frequency regions of old (average age 45d) DBA mice compared to tonotopically matched regions of young (average age 22d) DBA mice. Moreover, synaptic release probability was about 30% higher in high frequency regions of young DBA than that in old DBA mice. Auditory nerve-evoked EPSCs showed less rectification in old DBA mice, suggesting recruitment of GluR2 subunits into the AMPA receptor complex. No similar age-related changes in synaptic release or EPSCs were found in age matched, normal hearing young and old CBA mice. Taken together, our results suggest that auditory nerve activity plays a critical role in maintaining normal synaptic function at the endbulb of Held synapse after the onset of hearing. Auditory nerve activity regulates both presynaptic (release probability) and postsynaptic (receptor composition and kinetics) function at the endbulb synapse after the onset of hearing.
Keywords: Auditory, Deafness, Synaptic transmission, EPSC, Endbulb of Held, AMPA receptors
Introduction
The AVCN principal neurons, the stellate and bushy cells, receive obligatory synaptic input from the central projections of spiral ganglion cells. There is a well-organized tonotopic innervation pattern in the AVCN such that high frequency auditory nerve fibers project to the dorsal region whereas low frequency fibers innervate the ventral regions of the AVCN (Berglund and Brown 1994; Rose et al. 1960; Rouiller and Ryugo 1984). To faithfully convey fine acoustic temporal features, a specialized synapse with multiple release sites, called the endbulb of Held, connects the auditory nerve fibers to the bushy cells. AVCN bushy neurons also have a prominent low threshold K+ conductance that is partially activated at rest, endowing the cells with a low input resistance and short membrane time constant (Manis and Marx 1991; Oertel 1983; Rothman and Manis 2003). AMPA receptor mediated synaptic currents in AVCN neurons are large and among the briefest in the nervous system (Brenowitz and Trussell 2001; Gardner et al. 2001, 1999; Isaacson and Walmsley 1996; Raman and Trussell 1992). The postsynaptic receptors lack GluR2 subunits, and consist primarily of flop subunit splice variants (Brenowitz and Trussell 2001; Gardner et al. 2001, 1999; Lawrence and Trussell 2000; Parks 2000). These features are in part responsible for the rapid desensitization of the receptors in auditory neurons (Geiger et al. 1995), thereby achieving exquisite temporal coding by minimizing postsynaptic temporal summation.
Since the principal neurons of the AVCN receive direct afferent innervation from the cochlea and provide essential timing information to other auditory centers for both sound localization and pitch detection, the effect of age-related hearing loss on synaptic transmission in these cells could have a profound impact on the residual auditory function (Syka 2002). A number of morphological, biochemical and physiological changes occur in cochlear nucleus (CN) neurons following hearing loss produced by cochlear ablation. These effects include cell shrinkage (Pasic and Rubel 1989; Willott et al. 1987), abnormal expression of transcription factors and synaptic proteins (Illing et al. 1997; Luo et al. 1999; Sie and Rubel 1992; Suneja et al. 1998), altered neuronal excitability (Francis and Manis 2000; Lu et al. 2004), and, depending on ages, cell death (Mostafapour et al. 2000; Tierney et al. 1997; Zirpel et al. 2000). The shape of the endbulbs is also modified by deafness in cats (Ryugo et al. 1998) and mice (Limb and Ryugo 2000). Recent studies in young (P7-10) congenitally deaf mice have shown that the auditory nerve evoked excitatory postsynaptic current (EPSC) amplitude is larger and transmitter release probability is higher than comparable normal hearing animals (Oleskevich and Walmsley 2002; Oleskevich et al. 2004). Many other functional changes in both excitatory and inhibitory synaptic transmission have been shown along the central auditory brainstem pathways in both congenitally deaf and cochlear ablated animals (Kotak and Sanes 1997; Leao et al. 2004; Oleskevich et al. 2004; Vale and Sanes 2002).
To investigate the consequences of peripheral hearing loss (AHL) on synaptic transmission in the first central auditory relay nucleus AVCN, we chose to use the inbred DBA strain of mouse. DBA mice possess multiple major recessive genes on chromosome 10 that are responsible for AHL (Johnson et al. 1997; Noben-Trauth et al. 2003). At the onset of hearing, which occurs between 2 and 3 weeks of age, DBA mice have normal hearing thresholds (Willott and Erway 1998; Zheng et al. 1999). By 5 weeks of age however, hearing thresholds are elevated by ∼30 dB for frequencies above 8 kHz, while remaining relatively normal for low frequencies (Zheng et al. 1999). Consequently, CN neurons in animals with ongoing AHL will experience a gradient of sensory drive, in which a severe loss of sound-evoked auditory input occurs initially in the high frequency regions while the low frequency areas continue to experience relatively normal levels of afferent activity. AVCN principal neurons thus offer a unique opportunity to study the consequences of peripheral deprivation on the postsynaptic targets. To address whether the high frequency hearing loss is associated with changes in synaptic transmission at the central endbulb of Held synapse, we systematically studied bushy neurons in the AVCN from the hearing impaired high frequency region of ″old″ DBA mice, and compared them to frequency matched counterparts in young DBA mice. We also studied high frequency bushy cells from young and ″old″ CBA mice, which exhibit normal hearing thresholds throughout this age range.
Material and Methods
Animals
DBA/2J and CBA/Caj mice (The Jackson Lab, Bar Harbor, ME) aged between 17 days to 65 days were used. The frequency map of the mouse cochlear nucleus was based on in vivo experiments that examined auditory nerve fiber projections to the CN (Berglund and Brown 1994; Ehret 1983; Mueller et al. 2004). The high frequency (HF) region was defined as the dorsal third of AVCN, along the auditory nerve fiber trajectory from the eighth nerve root. The dorsal boundary of the high frequency region was the border between the granule cell region and AVCN. The low frequency (LF) region was the rostro-ventral third of AVCN, as defined along the trajectory of the auditory nerve fiber fascicles in AVCN (Figure 1A). Based on the cochlear frequency map and its projection to the AVCN, the high frequency region includes the representation of frequencies of 25 kHz and above, whereas the low frequency area corresponds to frequencies below 7 kHz. This clearly separates the sampled cell groups according to the regions of the cochlea that are affected during the early-onset high frequency hearing loss in DBA/2J mice. Figure 1B indicates the animal ages and frequency groups used in this study.
Fig. 1.
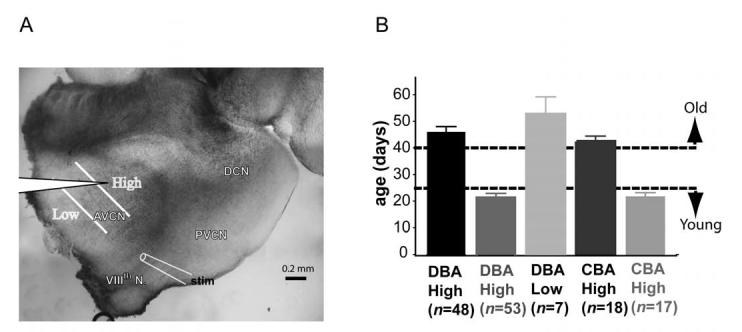
Illustration of frequency regions where electrophysiology recordings were made. A) A 200-250 μm thick parasagittal slice of brainstem containing cochlear nucleus was cut. The AVCN was divided along the isofrequency line into three equal zones representing high, medium and low frequency regions. There was no overlap between the high and low frequency areas. The placement of the bipolar stimulating for electrode auditory nerve fiber stimulation was indicated. B) Experimental animal ages and tonotopic regions where cells were recorded. Animals younger than 25 days were considered to be young, whereas animals older than 40 days were considered old.
Prior to brain slice preparation, each mouse was scored for the presence or absence of the Preyer’s reflex to verify the hearing status (Jero et al. 2001). All animal protocols were approved by the Institutional Animal Care and Use Committee at the University of North Carolina at Chapel Hill.
Slice preparation
Slices of cochlear nucleus were prepared as previously described (Manis, 1989; Manis, 1990). Briefly, mice were anesthetized with sodium pentobarbital (50mg/kg, i.p.) or ketamine (100 mg/kg)/xylazine (10mg/kg, i.p.), and then decapitated. The brainstem including the cochlear nucleus was immediately dissected out and immersed in prewarmed (34°C) artificial cerebrospinal fluid (ACSF) containing (in mM) 122 NaCl, 3 KCl, 1.25 KH2PO4, 20 glucose, 25 NaHCO3, 2 Na-pyruvate, 3 myo-inositol, 0.4 ascorbic acid, 0.1 CaCl2, 3.7 MgSO4, and bubbled with 95% O2 and 5% CO2 to a pH of 7.4. Brainstems were trimmed and mounted on a cutting block and 200-250 μm parasagittal sections of the cochlear nucleus were sliced on a vibratome. After incubation for at least 30 min at 34°C, each slice was secured in the recording chamber and superfused with recording ACSF (same as dissection ACSF except 2 mM CaCl2, 2 mM MgSO4) at a rate of 3-5 ml/min.
Electrophysiological recordings
AVCN neurons were visualized with a water-immersion objective (40x) using Nomarski differential interference contrast optics on a Zeiss FS Axioskop (Zeiss, Oberbochen, Germany). To enhance image contrast in slices from older animals, the field diaphragm was closed nearly all the way, no infrared filter was used, and the condenser was aligned slightly eccentrically (Gardner et al. 2001; Kachar 1985). Patch electrode pipettes (3-8 MΩ) were pulled from borosilicate glass (KG-33, Garner Glass. Claremont, CA) with a Sutter P2000 puller (Sutter Instruments, San Francisco, CA), coated with Sylgard 184 (Dow Corning, Midland, MI) before use. The standard electrode solution contained (in mM): 110 K+-gluconate, 4 NaCl, 20 KCl, 10 HEPES, 0.2 EGTA, 4 Mg2+-ATP, 10 creatine phosphate, and 0.3 GTP. The pH was adjusted to 7.2 with KOH, and the final osmolarity was ∼295 mOsm. For evoked EPSC recordings, a Cs+-based electrode solution containing 2-5 mM QX314 (Tocris Cookson, Bristol, UK) was used to minimize contamination from potassium and sodium conductances. The solution contained (in mM) 125 CsMeSO3, 15 CsCl, 5 EGTA, 10 HEPES, 4 MgATP, 10 creatine phosphate, 0.3 GTP, and was adjusted to pH 7.2 with CsOH. Fifty μM of N-(4-hydroxyphenylpropanoyl)-spermine trihydrocholoride (NHPP-spermine) (Tocris Cookson) was added to the electrode solution when studying EPSC rectification. For most recordings, the fluorescent dye Alexa Flor488 (Molecular Probes, Eugene, OR) was added to aid cell visualization and identification. For recordings made with potassium gluconate electrodes, the membrane potential of each cell was adjusted by -12 mV to account for the liquid junction potential of the gluconate solution. Recordings using cesium solutions were not corrected. Recordings pertaining to spontaneous mEPSC data were performed at 34°C using an Axopatch 200B (Axon Instruments, Foster City, CA) under the control of in-house software written in Matlab (The Mathworks, Natick, MA). Whole-cell access resistance was less than 15 MΩ and compensated to greater than 70% online with a 20 μs lag time. Spontaneous synaptic responses were low-pass filtered at 5 kHz and sampled at 10 kHz. Some experiments were also repeated with 10 kHz low pass filter and 50 kHz sampling rate.
For evoked EPSCs, recordings were made at room temperature (∼23 °C) to reduce the peak evoked EPSC amplitude and slow the time course for better voltage clamp control. A concentric bipolar stimulating electrode was placed on the auditory nerve root (Figure 1A). A stimulus-response function was collected to determine the EPSC threshold. The stimulus strength was then adjusted to be 1.5 to 2X the current required to elicit reliable EPSCs. Only cells with large all-or-none EPSCs to graded stimulation intensities were selected for analysis, because these responses are typical of bushy cells in AVCN (Isaacson and Walmsley 1995). When cells showed more than one EPSC level, the stimulus was adjusted to reliably produce EPSCs at the first (lowest) amplitude, while not triggering larger EPSCs.
Stationary mean-variance analysis was used to estimate the initial release probability (Pr) of the synapse (Oleskevich et al. 2000; Reid and Clements 1999). Pr was manipulated by varying the external calcium concentration (1-3 mM), while adjusting extracellular magnesium concentration to maintain a constant total divalent cation concentration in the ACSF. The mean EPSC amplitude and the variance were obtained over a stable epoch of 60-80 trials (<20% drift). A parabola was fit against the mean-variance data by minimizing least mean square error and forcing the function through the origin. The equation for the parabola is:
where y is EPSC variance and x is EPSC mean amplitude. Release probability can then be calculated as:
where x corresponds to the mean amplitude of the EPSC at the standard calcium concentration (2mM). A lower limit of the number of release sites can be estimated as:
Data analysis
Each cell recorded in current clamp was characterized by its responses to current pulses. The input resistance of the cell was measured as the maximum slope of the currentvoltage relationship in the range 0-40 mV negative to the resting membrane potential (RMP). The shape of the action potential was quantified by measuring spike height, spike width at half height, and the maximum rising and falling rates (Francis and Manis 2000). Action potential current threshold was measured as the smallest current step that elicited an action potential.
mEPSCs were analyzed in two steps. First, large events were identified using simple amplitude detection with the threshold set to 4xSD of the background noise level. A template mEPSC was created using the rising and decay τ of the averaged mEPSC acquired in the first analysis run. In the second step, this template was used to detect mEPSCs with a scaled-template method (Clements and Bekkers 1997) implemented in Matlab, with the detection criterion set at 3-4 times the standard deviation of the recording noise. mEPSC amplitude, 20-80% rise time, decay τ, and inter-event interval were measured.
Statistical significance (p<0.05) was determined using parametric unpaired student′s t test using Prism GraphPad software (San Diego, CA).
Results
A total of 104 DBA mice and 43 CBA mice were used in this series of experiments. In order to minimize contributions of developmental maturation, no animals younger than 17 days old were used. The hearing loss in old DBA mice was tested behaviorally with Preyer’s reflex before brainstem slice preparation. Old DBA mice uniformly lacked a Preyer’s reflex whereas young DBA mice and CBA mice had a normal Preyer’s reflex. We later confirmed (in a separate study; Wang and Manis, submitted, 2005) with auditory brainstem evoked responses that click thresholds were elevated by about 20 dB in old DBA mice.
The majority of VCN neurons recorded belonged to two classes, type I and type II as previously described by Oertel (Oertel 1983). Type II neurons have been previously identified as spherical or globular bushy cells (Brawer et al. 1974; Oertel 1983; Osen 1969; Wu and Oertel 1984). In this study, we focused on type II cells. As reported previously, the electrical properties of the type II cells appeared to be little affected by the status of the auditory periphery (Francis and Manis 2000; Lu et al. 2004). The resting membrane potential, input resistance, action potential (AP) height, AP width (at half height) and AP afterhyperpolarization (AHP) were not statistically different between cells in high frequency regions of normal hearing young and impaired hearing old DBA mice. However, the amount of current necessary to evoke an action potential was found to be significantly elevated in the old DBA mice (Table 1).
Spontaneous mEPSC event frequency is reduced in older hearing-impaired DBA mice. Spontaneous mEPSCs were recorded for at least 40 seconds while holding the cell membrane at -60mV. Figure 2A shows representative traces from bushy cells in high frequency regions of old and young DBA mice, as well as young CBA mice. Spontaneous mEPSC event frequency from high frequency regions in young DBA mice was 124% higher than that in old DBA (young DBA: 11.50±2.27 Hz, n=12; old DBA: 5.13±1.34 Hz, n=13; p=0.022) (Figure 2B). Spontaneous mEPSC event frequency was 14.52 ± 4.90 Hz (n=3) for low frequency cells in old DBA mice. The event frequencies were not statistically different between the young, HF cells and the old LF cells in DBA mice. In addition, mEPSC event frequency was not different between young and old CBA HF bushy cells (6.43±1.54 Hz n=6; 6.93±2.49 Hz n=8; p=0.88), although event frequencies were lower in CBA mice than in young DBA mice. Pair-wise comparisons between the normal hearing young DBA HF and young CBA HF or between young DBA HF and old CBA HF also did not reveal differences (young DBA HF vs. old CBA HF p=0.16; young DBA HF vs. young CBA HF p=0.20) (Figure 2B). Thus, the regions of the AVCN subject to hearing loss selectively exhibit a lower spontaneous mEPSC frequency, whereas this is not seen in age-matched CBA mice or in the low frequency regions of old DBA mice.
Fig. 2.
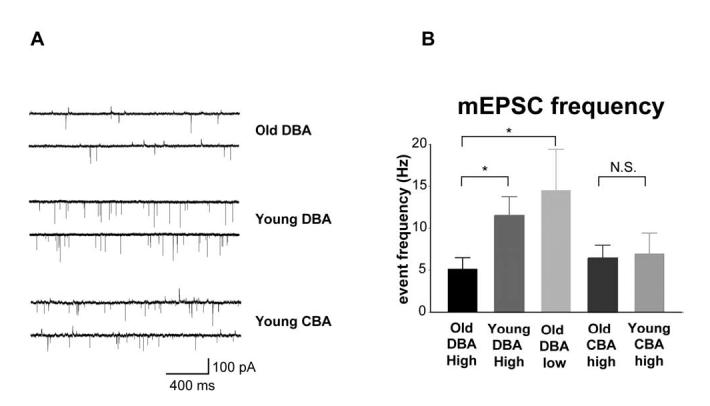
Spontaneous mEPSC event frequency was reduced in hearing-impaired old DBA mice. A) Representative mEPSC traces from high frequency bushy cells. Cells were held near their resting membrane potential at -60mV. No glycine receptor antagonist was included in the bathing solution. B) Spontaneous mEPSC event frequency from different age and frequency groups. mEPSC event frequencies from high frequency regions were lower in old DBA mice than that in young DBA mice, whereas the event frequency for normal hearing low frequency old DBA mice was similar to that of young DBA mice. mEPSC event frequency was not significantly different between old and young CBA high frequency bushy cells.
Release probability is lower in high frequency bushy cells of hearing-impaired DBA. Lower spontaneous EPSC event frequency in the hearing-impaired animals may be due to lower synaptic release probability at the endbulb of Held or due to a reduction in the number of active release sites. To test the hypothesis that release probability changed, we measured evoked EPSC from auditory nerve stimulation using a paired-pulse protocol. As typical of many synapses (reviewed by (Thomson 2000)), endbulb synapses exhibit an inverse linear relationship between the initial release probability and the paired-pulse ratio (Oleskevich et al. 2000; Oleskevich and Walmsley 2002). High release probability tends to result in paired-pulse depression whereas low release probability tends to produce paired-pulse facilitation. At 23°C, paired-pulse depression was observed in HF bushy cells from young DBA mice, whereas paired-pulse facilitation was seen in HF bushy cells from old DBA mice (Figure 3A). In the HF bushy cells of young DBA mice, the P2/P1 ratio was 0.87 ± 0.06 (n=19) whereas in the HF bushy cells of old DBA mice the ratio was 1.09 ± 0.06 (n=9, p=0.04, Figure 3B). In Figure 3C, paired-pulse ratios from all individual cells were plotted against the spontaneous mEPSC event frequency. Cells with strong paired-pulse depression had higher mEPSC event frequency (p=0.039, event frequency was 5.95±0.71 for young, and 4.06±0.50 for old DBA at 23°C). The evoked EPSC amplitude in old and young DBA mice was not significantly different (2.66 ± 0.52 nA, n=8; 4.03 ± 0.61 nA, n=18; p=0.10) although there was a tendency for old animals to have smaller EPSC amplitudes (Figure 3D).
Fig. 3.

Release probability at endbulb synapses was lower in hearing-impaired DBA mice. A) Sample paired-pulse responses from HF bushy cells in young and old DBA mice. A paired-pulse protocol was used to measure the initial release probability at the endbulb synapse. B) The P2/P1 ratios were significantly different between young and old DBA mice. C) Paired-pulse ratios from all individual cells were plotted against the spontaneous mEPSC event frequency. Cells with strong paired-pulse depression tended to have higher mEPSC event frequency. D) The evoked EPSC amplitude in old and young DBA mice showed no statistical difference although there was a tendency for old animals to have smaller EPSC amplitude.
To further asses release probability (Pr), we used stationary EPSC mean-variance analysis (see Methods), and manipulated the release probability by varying external Ca2+ concentration (Figure 4). These experiments also demonstrated a difference in release probability of HF bushy cells between young and old DBA mice. The estimated release probability at physiological Ca2+ concentration (2 mM) was 0.65±0.03 (n=9) for young DBA mice, whereas it was 0.47±0.08 (n=5) for old DBA mice (p=0.039). While the mean-variance technique does not permit a direct measure of the number of release sites, a lower limit can be estimated (Oleskevich et al. 2000). The minimum number of release sites onto HF bushy cells was not significantly different between young (Nrel. sites=59±17, n=9) and old DBA mice (Nrel. sites =86±28, n=5; p=0.39). The difference in release probability (∼30%) could readily account for the ∼30% reduction of evoked EPSCs we observed in older DBA mice (Figure 3C).
Fig. 4.

Mean-variance analysis of release probability in high-frequency cells of DBA mice. A) Evoked EPSCs recorded from a high frequency bushy cell in a young DBA mouse. Stable EPSCs were measured at varying extracellular calcium concentrations (top panel) and plotted against variance (bottom panel). A parabola was fitted (see Methods) to estimate release probability (Pr). The arrow indicates the Pr estimate in physiological calcium (2 mM). B) EPSCs recorded from an old DBA mouse. Inset shows summary data for Pr at 2 mM [Ca] from high frequency bushy cells in young and old DBA mice.
Spontaneous mEPSCs have a slower decay time constant in high frequency bushy cells of hearing-impaired DBA mice. In AVCN, mEPSCs in mature mice are mediated predominately by AMPA receptors (Bellingham et al. 1998; Isaacson and Walmsley 1996), which mostly contain GluR3 and GluR4 subunits (reviewed by Parks, 2000). Consistent with previous reports (Brenowitz and Trussell 2001; Gardner et al. 1999), mEPSCs recorded in DBA and CBA mice were characteristically brief. Figure 5 illustrates the distribution of mEPSCs and decay time constants from a HF bushy cell in a young DBA mouse. Figure 5A shows the normalized average of all the mEPSCs (∼500 events) from this cell. The mEPSC amplitudes (124.4±51.8 pA; CV=0.42) showed a Gaussian distribution (Figure 5C). Although there was a broad range of mEPSC amplitude, the majority of mEPSCs had similar decay time constant (0.15±0.04 ms, CV=0.27; Figure 5B). The intervals between mEPSCs were Poisson-distributed with a CV=1.05 (Figure 5D).
Fig. 5.

Properties of spontaneous miniature EPSCs. A) The normalized average of all the mEPSCs (∼500 events) recorded from a high frequency bushy cell in a young DBA mouse for 40 seconds. B) The amplitudes of all individual events were plotted against their respective decay time constants. Although there was a broad range of mEPSC amplitude size, for a given cell, the majority of mini EPSCs had similar decay time constant. C) The distribution pattern of all mEPSC amplitudes. D) mEPSC event intervals showed a Poisson distribution with a CV=1.05.
The mEPSC decay time constant was 115% slower in cells from the HF region of old DBA mice than that in tonotopically matched young DBA mice (Figure 6A, B). Decay time constants were 0.13 ± 0.02 ms (n=12) for young and 0.28 ± 0.06 ms (n=13) (p=0.039) for old DBA bushy cells in the HF region (Figure 6B). Because the decay time constants were so fast, we repeated this experiment in a separate group of cells, using a faster analog-to-digital conversion rate (20 μsec per point), and obtained very similar results (0.12 ± 0.01 ms, n=8 young DBA cells vs. 0.24 ± 0.04 ms, n=9, old DBA cells, p=0.033). Decay time constants for all the cells that were not affected by hearing loss were similar to those seen in HF bushy cells of young DBA mice; the decay time constants were 0.16 ± 0.06 ms (n=3, old DBA LF), 0.19 ± 0.02 ms (n=8, young CBA HF), and 0.15 ± 0.02 ms (n=6, old CBA HF). In spite of significant difference in mEPSC decay time constants of HF bushy cells between young and old DBA mice, there was no difference in the decay time constants of the evoked EPSC at 23°C (0.51 ± 0.04, n=18, young vs. 0.54 ± 0.06, n=8, old). Presumably, the effects of asynchronous release at the endbulb terminal (Isaacson and Walmsley, 1995; Oleskevich and Walmsley 2002) obscured any difference in the decay rate. Spontaneous mEPSC amplitude was about 30% smaller in old, hearing-impaired DBA mice than that in young DBA mice (80.9 ± 10.8 pA vs. 113.8 ± 8.9 pA; p=0.029 Figure 6C). In contrast, mEPSC amplitudes were not significantly different between the LF cells of old DBA and HF cells of young DBA mice (102.0 ± 15.3 pA vs. 113.8 ± 8.9 pA, p=0.555). When comparing amplitudes of HF cells in old and young CBA mice, the opposite relationship appeared, although it was not significant (119.7 ± 19.7 pA, n=6 young CBA cells vs. 83.1 ± 7.7 pA, n=8 old CBA cells; p=0.13).
Fig. 6.
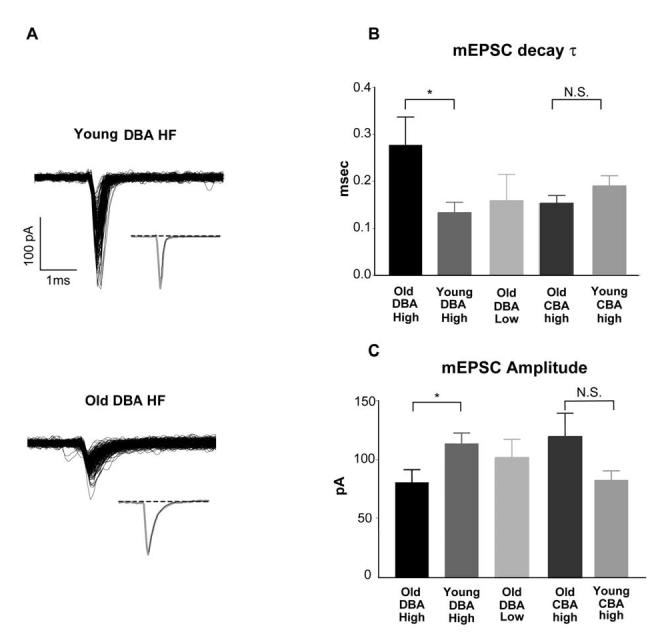
Spontaneous mEPSCs had slower decay time constant in hearing-impaired DBA bushy cells. A) Sample mEPSCs recorded from 2 bushy cells in HF regions from a young and an old DBA mouse. All detected mEPSCs were aligned to their onset. Insets: normalized average of the mEPSCs superimposed with the first order exponential decay (dark trace). B) Decay time constants for young and old bushy cells in high frequency regions of DBA mice were significantly different. Decay time constants for all cells from normal hearing regions of the AVCN were comparable between old DBA and young CBA HF as well as old CBA HF cells. C) Spontaneous mEPSC amplitude was significantly different between hearing-impaired old DBA mice and young DBA mice. There was no statistical difference between the normal hearing low frequency old DBA and the high frequency young DBA cells, nor between the old CBA HF and the young CBA HF cells.
mEPSCs in cells not affected by hearing loss tended to be larger and more frequent with a wide range of variability (Figure 7A). The amplitude and event frequency for the two normal hearing groups (young DBA HF, old DBA LF) were significantly different from those of impaired hearing old DBA high frequency group. Larger mEPSCs tended to have faster decay time constant (Pearson’s correlation coefficient r2=0.72; Figure 7B). A similar systematic relationship between the mEPSC amplitude and decay time constant was also observed at the endbulb synapse in avian nucleus magnocellularis during development (Brenowitz and Trussell 2001). mEPSCs with a slow decay τ did not have a slow rise time (Figure 7C). A linear regression to the data in Figure 7C yielded a slope of 0.05 (r2=0.03). There were no apparent differences between either the amplitude-decay time constant nor the rise-decay time constant relationships between the different groups.
Fig. 7.
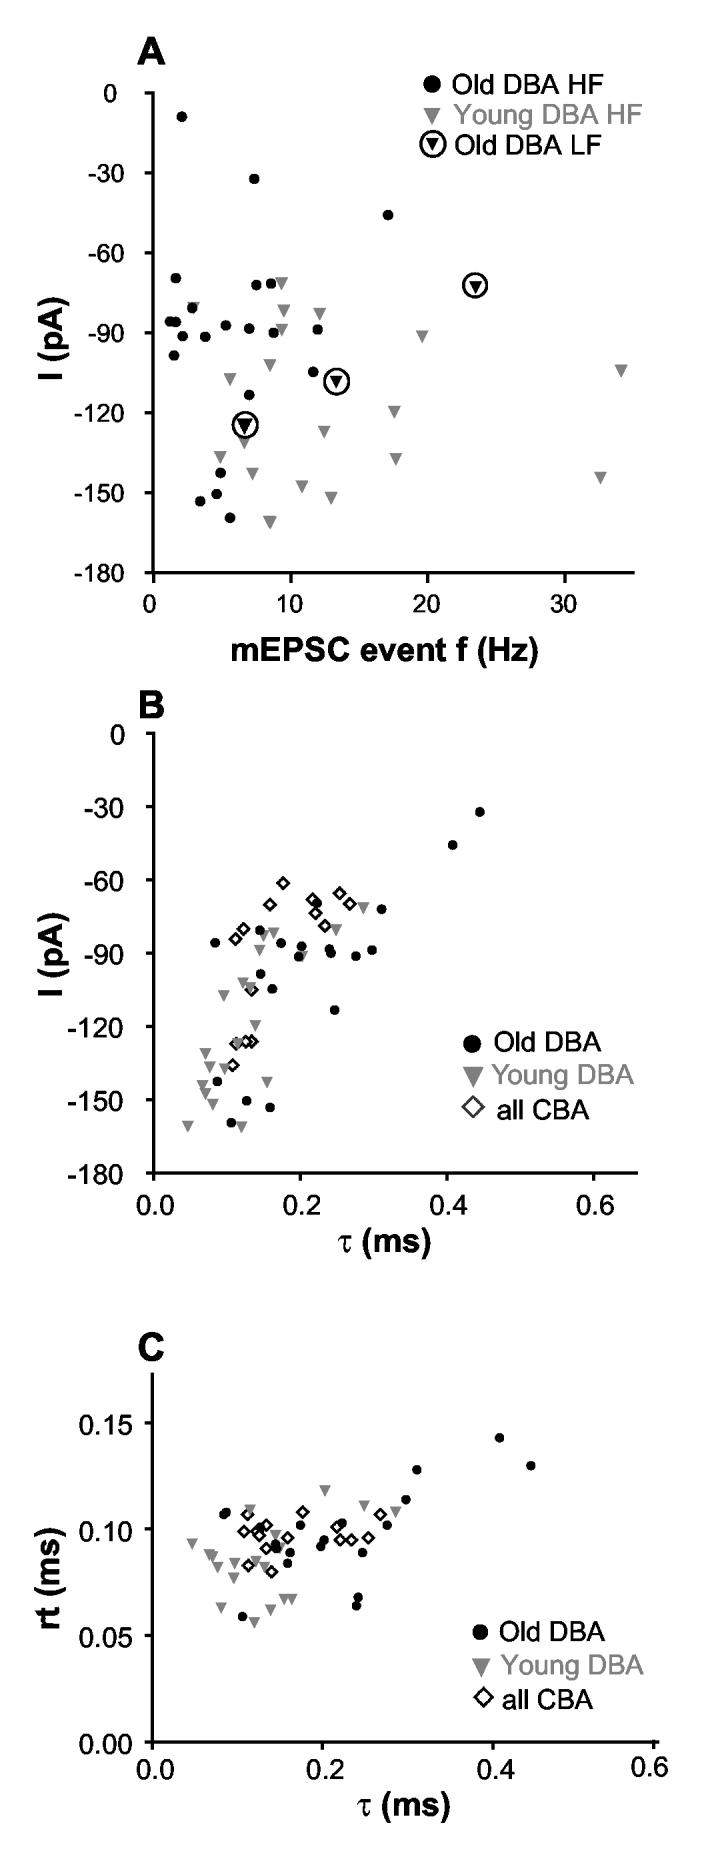
mEPSCs from cells not affected by hearing loss tended to be larger, more frequent, and had faster decay constant. A) mEPSC amplitude was plotted against event frequency for all individual bushy cells recorded from DBA mice. B) Larger mEPSCs tended to have faster decay time course (r2=0.72). mEPSC amplitude and decay time constant were plotted from bushy cells in the high frequency region of DBA and CBA of all ages. There were no apparent differences for amplitude/τ relationship between the groups. C) mEPSCs with a slow decay τ did not have a slow rising time. The rising and decay time constants of mEPSCs of all individual cells are plotted.
Synaptically activated AMPA currents show different rectification in high frequency bushy cells of young and old DBA mice. The increase in mEPSC decay time constant in the HF cells of old DBA mice suggested that there may be a change in postsynaptic receptor subunit assembly, since the kinetics of the AMPA receptor-mediated EPSC depends on the subunit composition (Geiger et al. 1995; Seeburg 1996). Four AMPA receptor subunits (GluR1-GluR4) have been identified (Boulter et al. 1990; Hollmann et al. 1994; Keinanen et al. 1990), and they can form homomeric or heteromeric receptor complexes. GluR2 plays a critical role in determining AMPA receptor properties. Receptors with GluR2 show slower decay kinetics and are impermeable to Ca2+ (Geiger et al. 1995; Jonas and Burnashev 1995; Seeburg 1996). AMPA receptors lacking the GluR2 subunits show greater Ca2+ permeability and an inward rectification in I-V relationship at positive voltages due to a voltage-dependent block by intracellular polyamines (Bowie and Mayer 1995; Kamboj et al. 1995; Washburn and Dingledine 1996). To test whether changes in AMPA receptor composition accompany hearing loss, we recorded auditory nerve evoked EPSCs at various holding voltages with recording electrodes containing 50 μM NHPP-spermine, a polyamine that enhances rectification when applied intracellularly (Washburn and Dingledine 1996). The rectification index was computed by taking the ratio of the synaptic conductance at +40 mV and -60 mV (similar results were obtained when the IV relationship was fitted with the Woodhull equation (Woodhull 1973), which models the voltage dependent block of the receptors by a charged compound). Representative evoked EPSC current-voltage plots of individual bushy cells are shown in Figure 8A. High frequency cells from young DBA mice showed more rectification than those from old DBA mice (Figure 8B). Overall, the rectification index in young DBA HF bushy cells was 0.30±0.07 (n=5) whereas the rectification index in HF cells from old DBA mice was 0.57±0.03 (n=8, p=0.001). To determine whether this shift reflected continued development, we also measured rectification in HF bushy cells from age-matched groups of CBA mice. No age-dependent change in EPSC rectification was observed in CBA mice (0.43 ± 0.04, n=11; 0.34 ± 0.06, n=7 for old and young CBA respectively, p =0.22). These changes in the polyamine dependent rectification of the EPSCs are consistent with a change in subunit composition of the receptor.
Fig. 8.

AMPA receptor mediated currents had less rectification in high frequency cells of impaired hearing old DBA mice. A) EPSC current-voltage relationships from representative individual bushy cells from old and young DBA mice are plotted. B) Comparison of the rectification index in both DBA and CBA mice. The rectification index was computed by taking the ratio of conductance of the cell at +40 mV and -60 mV; smaller numbers indicate greater rectification. Evoked EPSCs at various holding voltages were recorded with electrodes containing 50μM NHPP-spermine. In high frequency cells of old DBA mice, EPSC rectification was significantly weaker than that in young animals. No difference was observed between age-matched groups in CBA mice, nor between young DBA and CBA mice of either age group.
Discussion
We have shown that there are changes in synaptic transmission between the remaining auditory nerve fibers and their postsynaptic targets in the hearing-impaired high frequency region of the AVCN in 6-week and older DBA mice. The principal changes in synaptic transmission in the HF regions include a reduction of mEPSC frequency, a slowing of mEPSC decay time course, an increase in paired pulse potentiation and a corresponding decrease in the measured release probability, and a decrease in the voltage-dependent rectification of the EPSC. These results suggest that the deafness in these mice results in a cluster of changes in synaptic function that involve both presynaptic and postsynaptic mechanisms.
It is difficult to identify the proximal cause of the changes that we see, since the exact cause of the early onset of hearing loss in DBA mice is not clear. A mutation of an important protein in the stereocilia of hair cells, cadherin-23, has been implicated in hearing loss in DBA mice (Di Palma et al. 2001; Noben-Trauth et al. 2003), and is consistent with the ultrastructurally documented stereociliary disarray reported in this strain (Hultcrantz and Spangberg 1997). The disruption of the hair cell stereocilia has also been shown to result in a significant reduction of spontaneous activity in the auditory nerve fibers (Liberman and Dodds 1984). However, the hearing loss in DBA mice does not lead to immediate death of spiral ganglion cells (Willott and Erway 1998). Moreover, stimulation of the eighth nerve stump in brain slices of DBA mice (this study) produces EPSCs in high frequency regions of the AVCN that are comparable to those previously reported in normal hearing animals (Isaacson and Walmsley 1996; Oertel 1983). Thus, auditory nerve fibers appear to be intact in our DBA mice and synaptic transmission remains functional. However, the hearing loss is accompanied by a reduction in soundevoked activity, and the structural changes in the stereocilia bundle seem likely to result in a decrease or total loss of spontaneous activity in the auditory nerve. Data from a recent study of single auditory nerve fiber recordings in another AHL strain of mice, C57, suggests a decreased maximal spontaneous rate among fibers from the high frequency hearing-impaired region (Taberner and Liberman 2005); MC Liberman, personal communication). While we suggest that the changes we see result from a decrease in spike frequency over time at the endbulb synapses, it is unclear whether there is a complete or only a partial loss of activity.
The changes in synaptic transmission at the endbulbs are largely confined to those synapses from the HF regions of the old DBA AVCN, suggesting that the synaptic plasticity is caused by the hearing loss. Alternatively, although hearing threshold becomes adult-like around P20 (Ehret 1976; Mikaelian et al. 1965), the changes could also reflect continued postnatal development in DBA mice, since endbulbs show continued morphological maturation up to 60 days of age in C57 mice (Limb and Ryugo 2000). Studies in rat AVCN (Bellingham et al. 1998), chick nucleus magnocellularis (Brenowitz and Trussell 2001), and mouse MNTB (Joshi and Wang 2002) have all shown that miniature and evoked EPSCs become progressively larger and faster at the endbulb/calyx of Held synapses during the early stages of postnatal development. In contrast, the physiological changes seen in the old DBA mice are in the opposite direction of those reported during normal development. We observed smaller, slower and less frequent mEPSCs in the hearing loss affected HF bushy cells of old DBA mice (Figures 2, 6 and 7). It is interesting to note that despite the changes observed in the mEPSC, we did not observe significant difference in evoked EPSC time course and amplitude. Asynchronous release at the endbulb terminal (Isaacson and Walmsley, 1995; Oleskevich and Walmsley 2002) contributes to the time course of the EPSC, and may obscure subtle changes that depend on receptor kinetics. In addition, compensatory mechanisms that change the number of functional release sites may regulate the EPSC amplitude (see below).
Two other lines of evidence also suggest that the hearing loss itself, rather than continued development, maybe responsible for altering synaptic transmission at these synapses. First, the differences in mEPSC frequency, amplitude, and decay τ were seen only between HF regions of old DBA and young DBA mice, but not between HF cells from age-matched groups in CBA mice. Second, there was no difference in mEPSC frequency and kinetics between cells in the LF regions of old DBA mice and the HF regions of young DBA mice. Both of these observations suggest that, after P20, maturation of mechanisms affecting mEPSCs does not occur in regions of the AVCN that retain normal hearing.
Two of the striking effects we observed in synapses from regions of the AVCN with hearing loss were decreased spontaneous mEPSC frequency and release probability for evoked EPSCs. Since there clearly exists an association between endbulb morphology and the auditory nerve activity (Ryugo et al. 1996), a reduction in mEPSC frequency could result from fewer active release sites, perhaps as a consequence of reduced endbulb complexity, or from lower vesicle release probability. Our mean-variance analysis data showed that the overall number of functional release sites on bushy cells did not change significantly at this stage of hearing loss in DBA mice, although interestingly the estimate of the number of sites in older animals was greater than that in younger animals. The number of release sites estimated in our study is somewhat smaller than that reported in ″normal hearing″ P11-P16 CBA mice (Nrel. sites = 91), as well as congenital deaf dn/dn mice (Nrel. sites = 97) (Oleskevich and Walmsley 2002), in part because we did not correct for the asynchronous release. In contrast, the vesicle release probability appears reduced at affected synapses. Both paired-pulse and variance-mean analyses demonstrated that the release probability is significantly lower in HF endbulb synapses of hearing-impaired mice (Figure 4). Although we can not unequivocally rule out a contribution of continued development, this decreased release probability is in striking contrast to an 2-fold increase in release probability at the same synapse in congenitally deaf dn/dn mice (Oleskevich and Walmsley 2002). Since the dn/dn mice never attain hearing status, the increased release probability in those mice may reflect the consequences of abnormal development, as opposed the onset of deafness that occurs after a period of normal development.
The changes in mEPSC time course and voltage-dependent rectification of the EPSC in the HF regions of old DBA, but not in CBA mice, suggest a concurrent change in postsynaptic AMPA receptor subunit composition with hearing loss in DBA mice. AVCN principal neurons express different levels of glutamate receptor variants (Hunter et al. 1993; Parks 2000; Wang et al. 1998). During development, AMPA receptors in AVCN neurons gradually transit to flop isoforms, and lose GluR2 (Gardner et al. 2001, 1999; Isaacson and Walmsley 1996; Lawrence and Trussell 2000). Activity plays a critical role in specifying and determining the composition of AMPA receptors. In rat cerebellar stellate cells, evoked and spontaneous synaptic activity can recruit GluR2 subunits to the receptor complex, altering both voltage-dependent rectification and Ca2+ permeability (Gardner et al. 2005; Liu and Cull-Candy 2002; Liu and Cull-Candy 2000). In addition, GluR2 expression can be regulated by trophic factors such as BDNF (Narisawa-Saito et al. 2002) which may promote the N-ethylmaleimide-sensitive factordependent translocation of GluR2-containing receptors to the cell surface (Nishimune et al. 1998; Song et al. 1998). Alternatively, activity-dependent trafficking and recycling of other GluR subunits can affect the amount of GluR2 in the receptor complex (Ju et al. 2004; Zhu et al. 2000). Thus, there is an ample precedent for the idea that prolonged decreases in synaptic activity associated with hearing loss in AVCN bushy cells could alter the receptor subunit composition. The changes we observed in evoked EPSC rectification (Figure 8) and mEPSC kinetics are consistent with the notion that GluR2 subunits are being reintroduced into the receptor complex, either through up regulation GluR2 subunits, or indirectly as a result of down regulation of other subunits.
In conclusion, we have shown functional changes in both presynaptic release of transmitter and in postsynaptic responses at the endbulb synapse in DBA mice with hearing loss. While the immediate cause of these changes is not known, the case can be made that driven activity is decreased, and it seems likely that spontaneous activity is also reduced, in the high frequency hearing-impaired auditory nerve fibers of DBA mice. Such changes are similar to those expected in cases of acquired deafness in humans. The hearing loss in our study produces a different pattern of changes in the function of endbulb synapses from those reported previously for congenital hearing loss. These results also indicate that activity-dependent changes in the central auditory pathway accompany peripheral hearing loss, and highlight the importance of early intervention with cochlear implants (Sharma et al. 2002; Zwolan et al. 2004).
| DBA mean±s.e. | CBA mean±s.e. | ||||
|---|---|---|---|---|---|
| HF Old (n=21) | HF Young (n=14) | LF Old (n=7) | HF Old (n=8) | HF Young (n=10) | |
| RMP (mV) | -60.9±1.4 | -61.5±1.1 | -60.4±2.7 | -60.5±1.0 | -62.0±0.8 |
| Rin(MΩ) | 121.0±13.2 | 140.7±18.9 | 126.6±30.2 | 77.6±11.1 | 100.5±10.0 |
| Membrane Time Constant (msec) | 1.05±0.09 | 1.01±0.11 | 0.70±0.12 | 1.02±0.34 | 0.96±0.08 |
| AP Threshold I (pA) | 313.1±30.1 | 189.8±28.0* | 270.6±48.8 | 302.0±50.2 | 263.4±38.6 |
| AP Height (mV) | 36.8±3.6 | 40.1±2.8 | 41.0±4.7 | 40.4±3.5 | 39.6±3.2 |
| AHP (mV) | 9.2±1.0 | 7.5±1.7 | 7.6±1.4 | 10.0±1.7 | 8.7±1.5 |
| Max rising rate of spike (mV/ms) | 74.9±8.8 | 88.3±6.7 | 87.7±10.7 | 83.1±9.6 | 77.0±9.2 |
| Max falling rate of spike (mV/ms) | 73.9±19.2 | 60.7±9.2 | 59.7±10.5 | 75.7±18.3 | 70.6±18.6 |
p<0.01. Except the current required to reach spike threshold, no pair-wise significant difference was observed for all parameters measured within DBA or CBA mice. With the exception of Rin between young DBA and old CBA mice, none of the parameters measured were significantly different between DBA and CBA mice.
Acknowledgments
We thank Dante Bortone for technical assistance and Drs. Doug Fitzpatrick and Jaime Mancilla for helpful comments on the manuscript. We also thank Dr. M. C. Liberman for providing us unpublished data of single auditory fiber spontaneous rates from C57 mice. This work was supported by NIDCD grants R01-DC04551 to PBM and F32-DC004909 to YW.
References
- Bellingham MC, Lim R, Walmsley B. Developmental changes in EPSC quantal size and quantal content at a central glutamatergic synapse in rat. J Physiol. 1998;511:861–869. doi: 10.1111/j.1469-7793.1998.861bg.x. [DOI] [PMC free article] [PubMed] [Google Scholar]
- Berglund AM, Brown MC. Central trajectories of type II spiral ganglion cells from various cochlear regions in mice. Hear Res. 1994;75:121–130. doi: 10.1016/0378-5955(94)90063-9. [DOI] [PubMed] [Google Scholar]
- Boulter J, Hollmann M, O’Shea-Greenfield A, Hartley M, Deneris E, Maron C, Heinemann S. Molecular cloning and functional expression of glutamate receptor subunit genes. Science. 1990;249:1033–1037. doi: 10.1126/science.2168579. [DOI] [PubMed] [Google Scholar]
- Bowie D, Mayer ML. Inward rectification of both AMPA and kainate subtype glutamate receptors generated by polyamine-mediated ion channel block. Neuron. 1995;15:453–462. doi: 10.1016/0896-6273(95)90049-7. [DOI] [PubMed] [Google Scholar]
- Brawer JR, Morest DK, Kane EC. The neuronal architecture of the cochlear nucleus of the cat. J Comp Neurol. 1974;155:251–300. doi: 10.1002/cne.901550302. [DOI] [PubMed] [Google Scholar]
- Brenowitz S, Trussell LO. Maturation of synaptic transmission at end-bulb synapses of the cochlear nucleus. J Neurosci. 2001;21:9487–9498. doi: 10.1523/JNEUROSCI.21-23-09487.2001. [DOI] [PMC free article] [PubMed] [Google Scholar]
- Clements JD, Bekkers JM. Detection of spontaneous synaptic events with an optimally scaled template. Biophys J. 1997;73:220–229. doi: 10.1016/S0006-3495(97)78062-7. [DOI] [PMC free article] [PubMed] [Google Scholar]
- Di Palma F, Holme RH, Bryda EC, Belyantseva IA, Pellegrino R, Kachar B, Steel KP, Noben-Trauth K. Mutations in Cdh23, encoding a new type of cadherin, cause stereocilia disorganization in waltzer, the mouse model for Usher syndrome type 1D. Nat Genet. 2001;27:103–107. doi: 10.1038/83660. [DOI] [PubMed] [Google Scholar]
- Ehret G. Development of absolute auditory thresholds in the house mouse (Mus musculus) J Am Audiol Soc. 1976;1:179–184. [PubMed] [Google Scholar]
- Ehret G. Psychoacoustics. In: Willot JF, Springfield IL, editors. The auditory psychobiology fo the mouse. Charles C Thomas. 1983. [Google Scholar]
- Francis HW, Manis PB. Effects of deafferentation on the electrophysiology of ventral cochlear nucleus neurons. Hear Res. 2000;149:91–105. doi: 10.1016/s0378-5955(00)00165-9. [DOI] [PubMed] [Google Scholar]
- Gardner SM, Takamiya K, Xia J, Suh JG, Johnson R, Yu S, Huganir RL. Calcium-Permeable AMPA Receptor Plasticity Is Mediated by Subunit-Specific Interactions with PICK1 and NSF. Neuron. 2005;45:903–915. doi: 10.1016/j.neuron.2005.02.026. [DOI] [PubMed] [Google Scholar]
- Gardner SM, Trussell LO, Oertel D. Correlation of AMPA receptor subunit composition with synaptic input in the mammalian cochlear nuclei. J Neurosci. 2001;21:7428–7437. doi: 10.1523/JNEUROSCI.21-18-07428.2001. [DOI] [PMC free article] [PubMed] [Google Scholar]
- Gardner SM, Trussell LO, Oertel D. Time course and permeation of synaptic AMPA receptors in cochlear nuclear neurons correlate with input. J Neurosci. 1999;19:8721–8729. doi: 10.1523/JNEUROSCI.19-20-08721.1999. [DOI] [PMC free article] [PubMed] [Google Scholar]
- Geiger JR, Melcher T, Koh DS, Sakmann B, Seeburg PH, Jonas P, Monyer H. Relative abundance of subunit mRNAs determines gating and Ca2+ permeability of AMPA receptors in principal neurons and interneurons in rat CNS. Neuron. 1995;15:193–204. doi: 10.1016/0896-6273(95)90076-4. [DOI] [PubMed] [Google Scholar]
- Hollmann M, Boulter J, Maron C, Heinemann S. Molecular biology of glutamate receptors. Potentiation of N-methyl-D-aspartate receptor splice variants by zinc. Ren Physiol Biochem. 1994;17:182–183. [PubMed] [Google Scholar]
- Hultcrantz M, Spangberg ML. Pathology of the cochlea following a spontaneous mutation in DBA/2 mice. Acta Otolaryngol. 1997;117:689–695. doi: 10.3109/00016489709113461. [DOI] [PubMed] [Google Scholar]
- Hunter C, Petralia RS, Vu T, Wenthold RJ. Expression of AMPA-selective glutamate receptor subunits in morphologically defined neurons of the mammalian cochlear nucleus. J Neurosci. 1993;13:1932–1946. doi: 10.1523/JNEUROSCI.13-05-01932.1993. [DOI] [PMC free article] [PubMed] [Google Scholar]
- Illing RB, Horvath M, Laszig R. Plasticity of the auditory brainstem: effects of cochlear ablation on GAP-43 immunoreactivity in the rat. J Comp Neurol. 1997;382:116–138. doi: 10.1002/(sici)1096-9861(19970526)382:1<116::aid-cne8>3.0.co;2-4. [DOI] [PubMed] [Google Scholar]
- Isaacson JS, Walmsley B. Amplitude and time course of spontaneous and evoked excitatory postsynaptic currents in bushy cells of the anteroventral cochlear nucleus. J Neurophysiol. 1996;76:1566–1571. doi: 10.1152/jn.1996.76.3.1566. [DOI] [PubMed] [Google Scholar]
- Isaacson JS, Walmsley B. Counting quanta: direct measurements of transmitter release at a central synapse. Neuron. 1995;15:875–884. doi: 10.1016/0896-6273(95)90178-7. [DOI] [PubMed] [Google Scholar]
- Jero J, Coling DE, Lalwani AK. The use of Preyer’s reflex in evaluation of hearing in mice. Acta Otolaryngol. 2001;121:585–589. [PubMed] [Google Scholar]
- Johnson KR, Erway LC, Cook SA, Willott JF, Zheng QY. A major gene affecting age-related hearing loss in C57BL/6J mice. Hear Res. 1997;114:83–92. doi: 10.1016/s0378-5955(97)00155-x. [DOI] [PubMed] [Google Scholar]
- Jonas P, Burnashev N. Molecular mechanisms controlling calcium entry through AMPA-type glutamate receptor channels. Neuron. 1995;15:987–990. doi: 10.1016/0896-6273(95)90087-x. [DOI] [PubMed] [Google Scholar]
- Joshi I, Wang LY. Developmental profiles of glutamate receptors and synaptic transmission at a single synapse in the mouse auditory brainstem. J Physiol. 2002;540:861–873. doi: 10.1113/jphysiol.2001.013506. [DOI] [PMC free article] [PubMed] [Google Scholar]
- Ju W, Morishita W, Tsui J, Gaietta G, Deerinck TJ, Adams SR, Garner CC, Tsien RY, Ellisman MH, Malenka RC. Activity-dependent regulation of dendritic synthesis and trafficking of AMPA receptors. Nat Neurosci. 2004;7:244–253. doi: 10.1038/nn1189. [DOI] [PubMed] [Google Scholar]
- Kachar B. Asymmetric illumination contrast: a method of image formation for video light microscopy. Science. 1985;227:766–768. doi: 10.1126/science.3969565. [DOI] [PubMed] [Google Scholar]
- Kamboj SK, Swanson GT, Cull-Candy SG. Intracellular spermine confers rectification on rat calcium-permeable AMPA and kainate receptors. J Physiol. 1995;486:297–303. doi: 10.1113/jphysiol.1995.sp020812. [DOI] [PMC free article] [PubMed] [Google Scholar]
- Keinanen K, Wisden W, Sommer B, Werner P, Herb A, Verdoorn TA, Sakmann B, Seeburg PH. A family of AMPA-selective glutamate receptors. Science. 1990;249:556–560. doi: 10.1126/science.2166337. [DOI] [PubMed] [Google Scholar]
- Kotak VC, Sanes DH. Deafferentation weakens excitatory synapses in the developing central auditory system. Eur J Neurosci. 1997;9:2340–2347. doi: 10.1111/j.1460-9568.1997.tb01651.x. [DOI] [PubMed] [Google Scholar]
- Lawrence JJ, Trussell LO. Long-term specification of AMPA receptor properties after synapse formation. J Neurosci. 2000;20:4864–4870. doi: 10.1523/JNEUROSCI.20-13-04864.2000. [DOI] [PMC free article] [PubMed] [Google Scholar]
- Leao RN, Oleskevich S, Sun H, Bautista M, Fyffe RE, Walmsley B. Differences in glycinergic mIPSCs in the auditory brain stem of normal and congenitally deaf neonatal mice. J Neurophysiol. 2004;91:1006–1012. doi: 10.1152/jn.00771.2003. [DOI] [PubMed] [Google Scholar]
- Liberman MC, Dodds LW. Single-neuron labeling and chronic cochlear pathology. II. Stereocilia damage and alterations of spontaneous discharge rates. Hear Res. 1984;16:43–53. doi: 10.1016/0378-5955(84)90024-8. [DOI] [PubMed] [Google Scholar]
- Limb CJ, Ryugo DK. Development of primary axosomatic endings in the anteroventral cochlear nucleus of mice. J Assoc Res Otolaryngol. 2000;1:103–119. doi: 10.1007/s101620010032. [DOI] [PMC free article] [PubMed] [Google Scholar]
- Liu SJ, Cull-Candy SG. Activity-dependent change in AMPA receptor properties in cerebellar stellate cells. J Neurosci. 2002;22:3881–3889. doi: 10.1523/JNEUROSCI.22-10-03881.2002. [DOI] [PMC free article] [PubMed] [Google Scholar]
- Liu SQ, Cull-Candy SG. Synaptic activity at calcium-permeable AMPA receptors induces a switch in receptor subtype. Nature. 2000;405:454–458. doi: 10.1038/35013064. [DOI] [PubMed] [Google Scholar]
- Lu Y, Monsivais P, Tempel BL, Rubel EW. Activity-dependent regulation of the potassium channel subunits Kv1.1 and Kv3.1. J Comp Neurol. 2004;470:93–106. doi: 10.1002/cne.11037. [DOI] [PubMed] [Google Scholar]
- Luo L, Ryan AF, Saint Marie RL. Cochlear ablation alters acoustically induced cfos mRNA expression in the adult rat auditory brainstem. J Comp Neurol. 1999;404:271–283. doi: 10.1002/(sici)1096-9861(19990208)404:2<271::aid-cne10>3.0.co;2-4. [DOI] [PubMed] [Google Scholar]
- Manis PB, Marx SO. Outward currents in isolated ventral cochlear nucleus neurons. J Neurosci. 1991;11:2865–2880. doi: 10.1523/JNEUROSCI.11-09-02865.1991. [DOI] [PMC free article] [PubMed] [Google Scholar]
- Mikaelian D, Alford BR, Ruben RJ. Cochlear Potentials and 8 Nerve Action Potentials in Normal and Genetically Deaf Mice. Ann Otol Rhinol Laryngol. 1965;74:146–157. doi: 10.1177/000348946507400113. [DOI] [PubMed] [Google Scholar]
- Mostafapour SP, Cochran SL, Del Puerto NM, Rubel EW. Patterns of cell death in mouse anteroventral cochlear nucleus neurons after unilateral cochlea removal. J Comp Neurol. 2000;426:561–571. doi: 10.1002/1096-9861(20001030)426:4<561::aid-cne5>3.0.co;2-g. [DOI] [PubMed] [Google Scholar]
- Mueller M, von Huenerbein K, Hoidis S, Smolders JW. A Physiological placefrequency map of the cochlear in the mice. ARO. 2004 [Google Scholar]
- Narisawa-Saito M, Iwakura Y, Kawamura M, Araki K, Kozaki S, Takei N, Nawa H. Brain-derived neurotrophic factor regulates surface expression of alpha-amino-3-hydroxy-5-methyl-4-isoxazoleproprionic acid receptors by enhancing the N-ethylmaleimide-sensitive factor/GluR2 interaction in developing neocortical neurons. J Biol Chem. 2002;277:40901–40910. doi: 10.1074/jbc.M202158200. [DOI] [PubMed] [Google Scholar]
- Nishimune A, Isaac JT, Molnar E, Noel J, Nash SR, Tagaya M, Collingridge GL, Nakanishi S, Henley JM. NSF binding to GluR2 regulates synaptic transmission. Neuron. 1998;21:87–97. doi: 10.1016/s0896-6273(00)80517-6. [DOI] [PubMed] [Google Scholar]
- Noben-Trauth K, Zheng QY, Johnson KR. Association of cadherin 23 with polygenic inheritance and genetic modification of sensorineural hearing loss. Nat Genet. 2003;35:21–23. doi: 10.1038/ng1226. [DOI] [PMC free article] [PubMed] [Google Scholar]
- Oertel D. Synaptic responses and electrical properties of cells in brain slices of the mouse anteroventral cochlear nucleus. J Neurosci. 1983;3:2043–2053. doi: 10.1523/JNEUROSCI.03-10-02043.1983. [DOI] [PMC free article] [PubMed] [Google Scholar]
- Oleskevich S, Clements J, Walmsley B. Release probability modulates short-term plasticity at a rat giant terminal. J Physiol. 2000;524 Pt2:513–523. doi: 10.1111/j.1469-7793.2000.00513.x. [DOI] [PMC free article] [PubMed] [Google Scholar]
- Oleskevich S, Walmsley B. Synaptic transmission in the auditory brainstem of normal and congenitally deaf mice. J Physiol. 2002;540:447–455. doi: 10.1113/jphysiol.2001.013821. [DOI] [PMC free article] [PubMed] [Google Scholar]
- Oleskevich S, Youssoufian M, Walmsley B. Presynaptic plasticity at two giant auditory synapses in normal and deaf mice. J Physiol. 2004;560:709–719. doi: 10.1113/jphysiol.2004.066662. [DOI] [PMC free article] [PubMed] [Google Scholar]
- Osen KK. Cytoarchitecture of the cochlear nuclei in the cat. J Comp Neurol. 1969;136:453–484. doi: 10.1002/cne.901360407. [DOI] [PubMed] [Google Scholar]
- Parks TN. The AMPA receptors of auditory neurons. Hear Res. 2000;147:77–91. doi: 10.1016/s0378-5955(00)00122-2. [DOI] [PubMed] [Google Scholar]
- Pasic TR, Rubel EW. Rapid changes in cochlear nucleus cell size following blockade of auditory nerve electrical activity in gerbils. J Comp Neurol. 1989;283:474–480. doi: 10.1002/cne.902830403. [DOI] [PubMed] [Google Scholar]
- Raman IM, Trussell LO. The kinetics of the response to glutamate and kainate in neurons of the avian cochlear nucleus. Neuron. 1992;9:173–186. doi: 10.1016/0896-6273(92)90232-3. [DOI] [PubMed] [Google Scholar]
- Reid CA, Clements JD. Postsynaptic expression of long-term potentiation in the rat dentate gyrus demonstrated by variance-mean analysis. (Pt 1) J Physiol. 1999;518:121–130. doi: 10.1111/j.1469-7793.1999.0121r.x. [DOI] [PMC free article] [PubMed] [Google Scholar]
- Rose J, Galambos R, Hughes J. Organization of frequency sensitive neurons in the cochlear nuclear complex of the cat. In: Rasmussen G, Windle W, editors. Neural Mechanisms of the Auditory and Vestibular Systems. Thomas Springfield; 1960. pp. 116–136. [Google Scholar]
- Rothman JS, Manis PB. Kinetic analyses of three distinct potassium conductances in ventral cochlear nucleus neurons. J Neurophysiol. 2003;89:3083–3096. doi: 10.1152/jn.00126.2002. [DOI] [PubMed] [Google Scholar]
- Rouiller EM, Ryugo DK. Intracellular marking of physiologically characterized cells in the ventral cochlear nucleus of the cat. J Comp Neurol. 1984;225:167–186. doi: 10.1002/cne.902250203. [DOI] [PubMed] [Google Scholar]
- Ryugo DK, Rosenbaum BT, Kim PJ, Niparko JK, Saada AA. Single unit recordings in the auditory nerve of congenitally deaf white cats: morphological correlates in the cochlea and cochlear nucleus. J Comp Neurol. 1998;397:532–548. doi: 10.1002/(sici)1096-9861(19980810)397:4<532::aid-cne6>3.0.co;2-2. [DOI] [PubMed] [Google Scholar]
- Ryugo DK, Wu MM, Pongstaporn T. Activity-related features of synapse morphology: a study of endbulbs of held. J Comp Neurol. 1996;365:141–158. doi: 10.1002/(SICI)1096-9861(19960129)365:1<141::AID-CNE11>3.0.CO;2-T. [DOI] [PubMed] [Google Scholar]
- Seeburg PH. The role of RNA editing in controlling glutamate receptor channel properties. J Neurochem. 1996;66:1–5. doi: 10.1046/j.1471-4159.1996.66010001.x. [DOI] [PubMed] [Google Scholar]
- Sharma A, Dorman M, Spahr A, Todd NW. Early cochlear implantation in children allows normal development of central auditory pathways. Ann Otol Rhinol Laryngol Suppl. 2002;189:38–41. doi: 10.1177/00034894021110s508. [DOI] [PubMed] [Google Scholar]
- Sie KC, Rubel EW. Rapid changes in protein synthesis and cell size in the cochlear nucleus following eighth nerve activity blockade or cochlea ablation. J Comp Neurol. 1992;320:501–508. doi: 10.1002/cne.903200407. [DOI] [PubMed] [Google Scholar]
- Song I, Kamboj S, Xia J, Dong H, Liao D, Huganir RL. Interaction of the N-ethylmaleimide-sensitive factor with AMPA receptors. Neuron. 1998;21:393–400. doi: 10.1016/s0896-6273(00)80548-6. [DOI] [PubMed] [Google Scholar]
- Suneja SK, Potashner SJ, Benson CG. Plastic changes in glycine and GABA release and uptake in adult brain stem auditory nuclei after unilateral middle ear ossicle removal and cochlear ablation. Exp Neurol. 1998;151:273–288. doi: 10.1006/exnr.1998.6812. [DOI] [PubMed] [Google Scholar]
- Syka J. Plastic changes in the central auditory system after hearing loss, restoration of function, and during learning. Physiol Rev. 2002;82:601–636. doi: 10.1152/physrev.00002.2002. [DOI] [PubMed] [Google Scholar]
- Taberner AM, Liberman MC. Response properties of single auditory nerve fibers in the mouse. J Neurophysiol. 2005;93:557–569. doi: 10.1152/jn.00574.2004. [DOI] [PubMed] [Google Scholar]
- Thomson A. Facilitation, augmentation and potentiation at central synapses. Trends Neurosci. 2000;23:305–312. doi: 10.1016/s0166-2236(00)01580-0. [DOI] [PubMed] [Google Scholar]
- Tierney TS, Russell FA, Moore DR. Susceptibility of developing cochlear nucleus neurons to deafferentation-induced death abruptly ends just before the onset of hearing. J Comp Neurol. 1997;378:295–306. doi: 10.1002/(sici)1096-9861(19970210)378:2<295::aid-cne11>3.0.co;2-r. [DOI] [PubMed] [Google Scholar]
- Vale C, Sanes DH. The effect of bilateral deafness on excitatory and inhibitory synaptic strength in the inferior colliculus. Eur J Neurosci. 2002;16:2394–2404. doi: 10.1046/j.1460-9568.2002.02302.x. [DOI] [PubMed] [Google Scholar]
- Wang YX, Wenthold RJ, Ottersen OP, Petralia RS. Endbulb synapses in the anteroventral cochlear nucleus express a specific subset of AMPA-type glutamate receptor subunits. J Neurosci. 1998;18:1148–1160. doi: 10.1523/JNEUROSCI.18-03-01148.1998. [DOI] [PMC free article] [PubMed] [Google Scholar]
- Washburn MS, Dingledine R. Block of alpha-amino-3-hydroxy-5-methyl-4-isoxazolepropionic acid (AMPA) receptors by polyamines and polyamine toxins. J Pharmacol Exp Ther. 1996;278:669–678. [PubMed] [Google Scholar]
- Willott JF, Erway LC. Genetics of age-related hearing loss in mice. IV. Cochlear pathology and hearing loss in 25 BXD recombinant inbred mouse strains. Hear Res. 1998;119:27–36. doi: 10.1016/s0378-5955(98)00029-x. [DOI] [PubMed] [Google Scholar]
- Willott JF, Jackson LM, Hunter KP. Morphometric study of the anteroventral cochlear nucleus of two mouse models of presbycusis. J Comp Neurol. 1987;260:472–480. doi: 10.1002/cne.902600312. [DOI] [PubMed] [Google Scholar]
- Woodhull AM. Ionic blockage of sodium channels in nerve. J Gen Physiol. 1973;61:687–708. doi: 10.1085/jgp.61.6.687. [DOI] [PMC free article] [PubMed] [Google Scholar]
- Wu SH, Oertel D. Intracellular injection with horseradish peroxidase of physiologically characterized stellate and bushy cells in slices of mouse anteroventral cochlear nucleus. J Neurosci. 1984;4:1577–1588. doi: 10.1523/JNEUROSCI.04-06-01577.1984. [DOI] [PMC free article] [PubMed] [Google Scholar]
- Zheng QY, Johnson KR, Erway LC. Assessment of hearing in 80 inbred strains of mice by ABR threshold analyses. Hear Res. 1999;130:94–107. doi: 10.1016/s0378-5955(99)00003-9. [DOI] [PMC free article] [PubMed] [Google Scholar]
- Zhu JJ, Esteban JA, Hayashi Y, Malinow R. Postnatal synaptic potentiation: delivery of GluR4-containing AMPA receptors by spontaneous activity. Nat Neurosci. 2000;3:1098–1106. doi: 10.1038/80614. [DOI] [PubMed] [Google Scholar]
- Zirpel L, Janowiak MA, Veltri CA, Parks TN. AMPA receptor-mediated, calcium-dependent CREB phosphorylation in a subpopulation of auditory neurons surviving activity deprivation. J Neurosci. 2000;20:6267–6275. doi: 10.1523/JNEUROSCI.20-16-06267.2000. [DOI] [PMC free article] [PubMed] [Google Scholar]
- Zwolan TA, Ashbaugh CM, Alarfaj A, Kileny PR, Arts HA, El-Kashlan HK, Telian SA. Pediatric cochlear implant patient performance as a function of age at implantation. Otol Neurotol. 2004;25:112–120. doi: 10.1097/00129492-200403000-00006. [DOI] [PubMed] [Google Scholar]