

SUMMARY
The SCAN domain mediates interactions between members of a mammalian subfamily of zinc-finger transcription factors and is found in more than 60 C2H2 zinc finger genes in the human genome, including the tumor suppressor gene Myeloid Zinc Finger 1 (MZF1). GST pulldowns showed that the MZF1 SCAN domain self-associates, and a Kd of 600 nM was measured by intrinsic tryptophan fluorescence polarization. The MZF1 structure determined by NMR spectroscopy revealed a domain-swapped dimer. Each monomer consists of 5 alpha helices in two subdomains connected by the α2-α3 loop. Residues from helix 3 of each monomer compose the core of the dimer interface, while the α1-α2 loop and helix 2 pack against helices 3 and 5 from the opposing monomer. Comprehensive sequence analysis is coupled with the first high-resolution structure of a SCAN dimer to provide an initial view of the recognition elements that govern dimerization for this large family of transcription factors.
Keywords: NMR, fluorescence polarization, SCAN domain, Homodimer, Transcription factor
INTRODUCTION
The SCAN domain, also known as the leucine rich region (LeR) 1, was first identified and described based on the founding members of the family (SRE-ZBP, Ctfin51, AW-1 (ZNF174), and Number 18) 2. The SCAN domain is a highly conserved motif of 84 residues that does not have transcriptional activation or repression capabilities 1; 3; 4, but instead functions as a protein interaction motif mediating self-association or selective association with other proteins containing a SCAN domain 3; 4; 5; 6.
SCAN domain-containing zinc finger proteins (SCAN-ZFPs) represent a novel family of transcription factors, as recently reviewed by Collins and Sander 7, whose primary role is to bind specific DNA segments via zinc finger domains and interact with other cellular factors to control the expression of target genes. We previously determined that the SCAN-ZFP family consists of more than 60 members 8, accounting for nearly 10% of the C2H2 zinc finger genes. Interestingly, the SCAN domain is found only in vertebrates, and SCAN domains in lower vertebrates (e.g., fish and frog) are not associated with C2H2 zinc finger domains 8. Thus, the SCAN domain, in combination with C2H2 zinc finger motifs, appears to define a mammalian-specific gene family that may contribute to the diversity and complexity seen in higher vertebrates.
The SCAN domain was initially predicted to fold into 3-5 α-helices 6; 9, and CD spectra of the isolated ZNF174 SCAN domain verified that the protein has substantial α-helical content 3; 6. Subsequent studies confirmed by size exclusion chromatography and equilibrium sedimentation analysis that the ZNF174 SCAN domain does indeed form a stable dimer in solution 6. Wagner and colleagues recently solved the three-dimensional structure of the ZNF174 SCAN domain at low resolution, using a protein construct that was intentionally mutated to improve protein expression and spectral quality 10. Using NMR spectroscopy they demonstrated that the ZNF174 SCAN domain exists as a domain-swapped homolog of the C-terminal domain of HIV-1 capsid protein (CA-CTD), a structural component essential to the viral life cycle.
MZF1, originally identified as myeloid zinc finger gene 1 and also known as ZNF42 11; 12, is a SCAN-ZFP transcription factor required for blood cell development. The disruption of MZF1 expression results in a block of granulopoiesis, and the level of MZF1 expression increases in human promyelocytic leukemia HL-60 cells induced to differentiate in vitro with retinoic acid and granulocyte-macrophage colony-stimulating factor 11; 13, suggesting a role for MZF1 in granulocyte differentiation. Furthermore, MZF1 may act as a tumor suppressor in myeloid progenitors during blood cell development, since inactivation of the murine MZF1 gene results in a striking increase in hematopoietic progenitors, with the eventual development of lethal myeloid neoplasias 14.
We previously demonstrated that the SCAN domain of MZF1 is a protein interaction motif that self-associates and also interacts with the SCAN-related protein, RAZ1, also known as SCAND1 or SDP1 4. While the initial structural studies of ZNF174 may provide unexpected insights into retroviral particle assembly, we still lack an understanding of how SCAN homo- and heterodimers assemble and alter transcriptional activity in cancer and other disease states. Binding studies using SCAN domain chimeras suggest that the first helix and the loop connecting helices 1 and 2 are responsible for mediating selective heterodimer formation 9. However, individual residues within this region that encode SCAN domain binding specificity remain unknown.
To begin identifying the sequence elements responsible for selective association of SCAN-ZFP transcription factors, we determined the Kd for the MZF1 SCAN homodimer by fluorescence polarization and solved its structure by NMR spectroscopy, the first high-resolution structure of a SCAN domain. Furthermore, we performed the first structure-based sequence analysis of the entire human SCAN domain family, and defined the patterns of amino acid conservation at dimer interfaces corresponding to the domain-swapped MZF1 structure and the head-to-head dimer observed in the crystal structure of HIV CA-CTD 15. The results leave open the possibility that SCAN domains assemble using two alternative dimer topologies.
RESULTS AND DISCUSSION
MZF1 SCAN domain boundary optimization
Characterization of the SCAN-ZFP family proteins identified several conserved modular motifs external to the SCAN domain 8. MZF1, along with 33 other members of the family, includes a novel N-terminal region that is 13 residues in length and shares no homology to any established protein interaction modules, but contains a potential small ubiquitin-related modifier (SUMO) φKxE consensus sequence 16. To determine if the novel N-terminal region participates in SCAN dimerization, we generated two constructs that contained the novel N-terminal region plus the SCAN domain (residues 1-128) or the SCAN domain alone (residues 37-128). The C-terminally truncated MZF1 constructs were screened by 2D 15N-1H HSQC NMR and the spectra are shown in Figure 1. An evaluation of the number of signals, chemical shift dispersion and uniformity of peak intensities suggested that a folded domain of approximately 90 residues was present in both constructs, consistent with a folded SCAN domain. Further inspection of the MZF1(1-128) spectrum identified ∼30 additional sharp resonances clustered around the random coil chemical shift value of ∼8.2 ppm. The presence of these resonances only in the longer construct suggests that the novel N-terminal region is unstructured and unlikely to participate in SCAN dimerization. The MZF1(37-128) construct was used in subsequent studies and will be referred to as MZF1 SCAN domain.
Figure 1.

HSQC screening of MZF1.
Comparison of 2D 1H-15N HSQC spectra of (a) MZF1(1-128) and (b) MZF1 (37-128) demonstrates that removal of the amino-terminal 36 residues does not disrupt the SCAN domain structure.
The MZF1 SCAN domain is a homodimer
Previous work with an isolated ZNF174 SCAN domain showed that it exists as a homodimer in solution 6; 10. To determine whether the MZF1 SCAN domain construct was competent to form homodimers we developed a glutathione-S-transferase (GST) pull-down assay. A GST MZF1 SCAN domain fusion was incubated in the presence or absence of a His-tagged MZF1 SCAN domain and analyzed for homodimer formation (Figure 2A). His-tagged MZF1 binds specifically to the GST-MZF1 fusion and not the negative control GST, demonstrating that the MZF1 SCAN domain self-interacts. We also measured a self-diffusion constant (Ds) value of 1.1 × 10⁻⁶ cm2sec-1 for the MZF1 SCAN domain (data not shown) using PFG diffusion NMR methods 17. From empirical comparisons with other proteins of various MW, we expected monomeric (10.5 kDa) and dimeric (21 kDa) SCAN domain species to have D values of ∼1.8 and ∼1.1 × 10⁻⁶ s cm2sec-1, respectively. These data confirm that the MZF1 SCAN domain forms homodimers consistent with previous observation for the ZNF174 SCAN domain 6.
Figure 2.
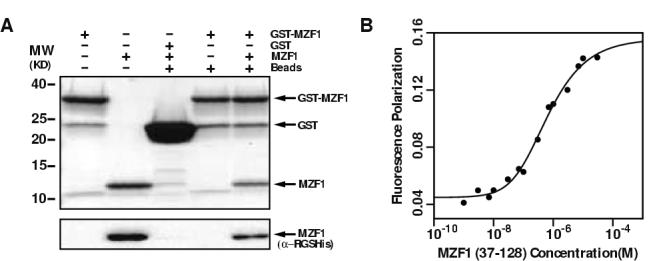
Residues 37-128 of MZF1 contain a SCAN domain that self-associates.
(a) GST-MZF1(37-128) binds MZF1(37-128). Sample composition is indicated above each lane. Proteins were detected by Coomassie stain (upper panel), and the MZF1 SCAN domain was detected by Western blot with a monoclonal antibody specific for the α-RGSHis epitope. Control lanes show that His-MZF1 does not bind non-specifically to GST or glutathione-agarose beads. (b) Tryptophan fluorescence polarization values for MZF1 SCAN domain are plotted as a function of protein concentration. Nonlinear fitting (solid line) yielded an equilibrium dissociation constant for the MZF1 scan homodimer of 600 ± 100 nM and FP values of 0.045 and 0.159 for pure monomer and dimer, respectively.
To quantify the equilibrium dissociation constant (Kd) for the MZF1 SCAN domain dimer, we monitored fluorescence polarization (FP) of the single tryptophan residue present in the domain. FP values were recorded at protein concentrations ranging from 0.01 to 70 μM and analyzed by nonlinear fitting to a monomer-dimer model 18. Under the solution conditions used for structure determination, a Kd value of 600 ± 100 nM was obtained (Figure 2B). The sub-micromolar Kd determined for the MZF1 SCAN domain showed that the homodimer is the primary species present in the samples used for structure determination since the protein concentration was three orders of magnitude higher.
The MZF1 SCAN domain forms a domain-swapped homodimer
We determined the structure of the MZF1 SCAN homodimer by NMR spectroscopy. The resolution of dimeric interfaces by NMR requires specialized NMR techniques to distinguish intermonomer from intramonomer contacts 19. To elucidate the topology of the MZF1 SCAN dimer interface, we prepared a differentially labeled sample by mixing unlabeled protein with uniformly 15N/13C labeled protein. The 3D F1-13C-filtered, F3-13C-edited NOESY spectrum (Figure 3A) contains only NOEs arising between a proton directly bound to a 13C nucleus and a proton bound to any NMR inactive nucleus, while suppressing all other crosspeaks by isotope filtering 20. This experiment therefore identifies intermolecular contacts that are crucial to defining the SCAN dimer interface (Figure 3B and 3C). A total of 136 intermonomer NOEs detected in the isotope-filtered NOESY spectrum were sufficient to unequivocally define the domain-swapped topology of the MZF1 SCAN homodimer (Figure 3D). Additional NOE assignments obtained during the course of iterative refinement yielded a total of 433 unique intermolecular distance constraints in the final structure.
Figure 3.

The MZF1 SCAN dimer interface.
(a) Strips extracted from a 3D F3-13C-edited NOESY spectrum (left strip) containing both intra- and intermolecular NOEs while strips from the 3D F1-13C-filtered, F3-13C-edited NOESY spectrum (right strip) show only the intermolecular NOEs. Strip pairs are shown for residues L62, L68, L87 and A116. Leucine 68 does not participate in the dimer interface and therefore does not have NOEs in the 3D F1-13C-filtered, F3-13C-edited NOESY spectrum. Box coloring corresponds to the NOEs displayed in panels (c) and (d). (b) Intermolecular contacts at the dimer interface involving residues Q59, L62, V88, P112, E113 and A116. NOE coloring corresponds to the boxed peaks in panel (a). (c) Intermolecular contacts involving residues L73 and L87. NOE coloring corresponds to the boxed peaks in panel (a). (d) Cross-eyed stereo view of the MZF1 SCAN homodimer. Monomers A and B are shown in green and orange, respectively.
Refinement statistics for the final ensemble of 20 conformers (Figure 4A) are reported in Table 1. Each MZF1 monomer forms an extended domain composed of five α-helices arranged with helices 1 and 2 in one subdomain and helices 3, 4 and 5 forming a second subdomain. Two monomers associate in a domain-swapped topology such that each α1-2 subdomain packs against helices 3-5 of the other monomer (Figure 3D), creating an extensive ∼1,700 Å2 dimer interface. Backbone RMSD values of ∼ 0.55 Å and 0.62 Å were determined for the individual monomers and the dimer, respectively, using a residue range of 40-122 (Figure 4B). The close agreement of the backbone RMSD values between the monomers and the dimer indicates that the dimer interface is highly determined allowing for the proper orientation of the two halves. Low backbone RMSD values observed over the length of the SCAN domain are consistent with the uniformly high heteronuclear 15N-1H nuclear Overhauser effect (NOE) values measured for the majority of the residues (Figure 4C), suggesting that the dimer is a relatively rigid structure.
Figure 4.

NMR structure of the MZF1 SCAN domain homodimer.
(a) Ensemble of the final 20 structures (Cα trace) viewed from the side (top) and along the C2 axis of symmetry (bottom). Helices from monomers A and B are colored gray and black, respectively. (b) Global backbone atomic RMS deviations for the individual monomers of the MZF1 SCAN domain homodimer plotted as a function of residue number. Values were calculated with the ensemble superimposed using residues 40-122 of each monomer. Lines are colored as in (a). (c) 15N-1H heteronuclear NOE values plotted as a function of residue number. Heteronuclear values were not determined for W72, I100 and R103 because of peak overlap.
Table I.
Statistics for the 20 MZF1 (37-128) conformers
| Experimental constraints (total used for each monomer) | ||
| Distance constraintsa | ||
| Long | 370 | |
| Long (intermolecular) b | 433 | |
| Medium [1<(i-j)≤5] | 512 | |
| Sequential [(i-j)=1] | 408 | |
| Intraresidue [i=j] | 412 | |
| Total | 2135 | |
| Dihedral angle constraints (φ and Ψ) | 132 | |
| Average atomic R.M.S.D. to the mean structure (Å) | ||
| Dimer (residues 40-122) | ||
| Backbone ( Cα, C′, N) | 0.62 ± 0.16 | |
| Heavy atoms | 0.95 ± 0.11 | |
| Monomer I (residues 40-122) | ||
| Backbone ( Cα, C′, N) | 0.55 ± 0.13 | |
| Heavy atoms | 0.92 ± 0.09 | |
| Monomer II (residues 40-122) | ||
| Backbone ( Cα, C′, N) | 0.56 ± 0.16 | |
| Heavy atoms | 0.92 ± 0.12 | |
| Deviations from idealized covalent geometry | ||
| Bond lengths | RMSD (Å) | 0.014 |
| Torsion angle violations | RMSD (°) | 1.2 |
| WHATCHECK quality indicators | ||
| Z-score | -1.13 ± 0.16 | |
| RMS Z-score | ||
| Bond lengths | 0.67 ± 0.02 | |
| Bond angles | 0.71 ± 0.02 | |
| Bumps | 0 ± 0 | |
| Constraint violations | ||
| NOE distance | Number > 0.5 Å | 0 ± 0 |
| NOE distance | RMSD (Å) | 0.019 ± 0.001 |
| Torsion angle violations | Number > 5 ° | 0 ± 0 |
| Torsion angle violations | RMSD (°) | 0.464 ± 0.072 |
| Ramachandran statistics (% of all residues) | ||
| Most favored | 93.5± 1.5 | |
| Additionally allowed | 6.1 ± 1.5 | |
| Generously allowed | 0.4 ± 0.4 | |
| Disallowed | 0.2 ± 0.4 | |
All distance constraints are intramolecular unless otherwise noted.
A total of 136 of the long range intermolecular distance constraints were derived from the 3D F1-13C-filtered, F3-13C-edited NOESY spectrum. The remaining intermolecular distance constraints were derived from the 15N-edited and 13C-edited NOESY spectra.
Comparison of the MZF1 and ZNF174 homodimers
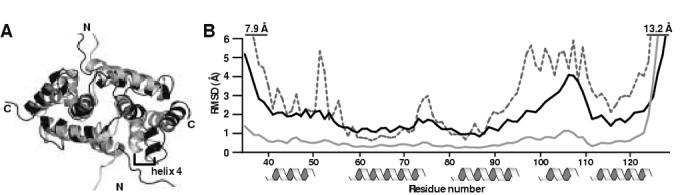
MZF1 adopts the same domain swapped dimer topology observed for ZNF174 10. To evaluate structural differences between the two SCAN domains, we aligned the representative conformers from the MZF1 and the ZNF174 ensembles (PDB entries 2FI2 and 17YQ, respectively) using the FATCAT server (http://fatcat.burnham.org/) 21. Overall, the structures are similar with the largest deviation occurring in helix4, which appears to be shifted away from the core of the dimer interface in ZNF174 when compared with MZF1 (Figure 5A). To quantify the structural differences, average Cα-Cα RMSD values were calculated by comparing the representative conformer of MZF1 with all members of the ZNF174 ensemble (Figure 5B, dashed line). Inspection of the Cα-Cα RMSD values indicated three regions of structural divergence including the α1-α2 loop, the α2-α3 loop and helices 4 and 5. However, the overall backbone r.m.s.d. for the ZNF174 ensemble (1.82 Å, when calculated for residues 46-126 of both monomers) is substantially higher than that of the MZF1 structure (0.62 Å), and the local coordinate precision for ZNF174 (Figure 5B, black line) is in most places comparable to apparent structural differences. Consequently, it is difficult to assess whether differences in the packing of helices 4 and 5 are significant or result from the low density of NOE restraints in that region of the ZNF174 structure.
Figure 5.
Comparison of MZF1 and ZNF174.
(a) Ribbon view of the superimposed representative conformers for MZF1 (PDB entry 2fi2) and ZNF174 (PDB entry 1y7q) aligned using the FATCAT server 21. MZF1 is shown in gray and ZNF174 is shown in black. (b) Global backbone atomic RMS deviations for MZF1 (solid gray line) and ZNF174 (solid black line) plotted as a function of residue number. Average Cα-Cα RMSD values were calculated for the representative conformer of MZF1 superimposed on the ZNF174 ensemble and plotted as a function of residue number (dashed line). Numbering corresponds to the MZF1 SCAN domain.
Amino acid conservation at the SCAN dimer interface
The assembly of SCAN domain mediated homo- and heterodimers has been studied by several groups and is reported to be selective, i.e. not all SCAN domains heterodimerize with one another 3; 5; 9. The low precision of the ZNF174 ensemble precluded a comparative structural analysis to identify elements that contribute to SCAN binding specificity, so we aligned all 63 human SCAN domain sequences and computed the sequence variability at each position (Figure 6). The SCAN domain extends from Gly 39 to Arg 124 of the MZF1 sequence and the sequence variability is plotted as a function of the consensus sequence.
Figure 6.

Analysis of SCAN domain residue conservation.
(a) The consensus sequence and sequence variability was determined for each position and is shown above the alignment. Boundaries for helices 1-5 are denoted with helical icons and the gray bars represent residues contributing more than 5 Å2 to the dimer interface. Numbering corresponds to the MZF1 SCAN domain. (b) The 63 SCAN domain protein sequences were obtained from the NCBI database and aligned by Clustal W sequence alignment using MacVector 7.2, with an open gap penalty setting of 100.0. The Official Symbol and GeneID (in parantheses) assigned at NCBI are listed to the left of each corresponding amino acid sequence. The most common residues sharing >51% identity have been boxed and shaded in grey. Similar residues at these positions were shaded as well.
We examined the sequence variability for residues contributing more than 5 Å2 to the dimer interface, denoted with gray bars in Figure 6A. Typically, these residues displayed a high degree of conservation. For example, helix 3, which forms the core of the dimer interface, has the lowest sequence variability of the five helices. A correlation of interface contribution (Å2) with sequence variability showed that the majority of residues contributing to the dimer interface show sequence variability scores below 30. Mapping the sequence variability to the dimer interface revealed a highly conserved core with variable residues at the margins of the dimer interface. The α1-α2 loop, helix 2 and helix 5 also contribute the domain-swapped dimer interface with helix 5 showing the highest level of sequence variability. In contrast, helices 1 and 4 do not participate in the dimer interface. The highly invariant binding surface of the MZF1 dimer seems incompatible with selective SCAN heterodimerization. Consequently, we wondered if the SCAN homodimer structure is an accurate model for SCAN heterodimerization.
Alternative SCAN domain dimer models
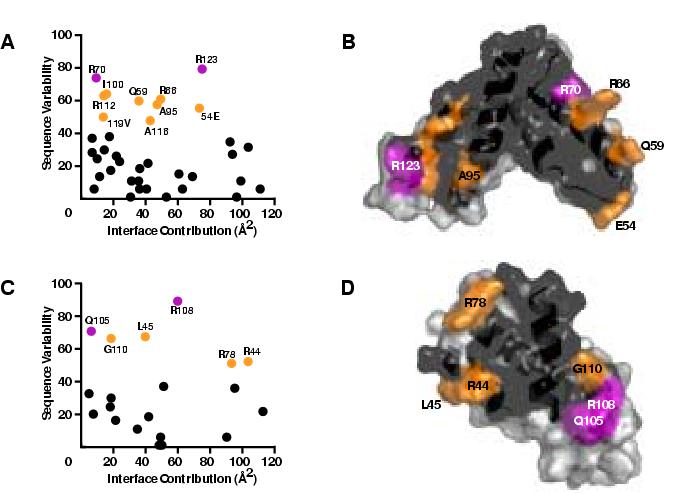
SCAN domain interactions have been detected in mammalian and yeast two-hybrid screens as well as pull-down assays, but the structural basis for binding specificity remains largely unexplored 3; 5; 9. Nam et al. 9 used chimeras in which helix 1 and the α1-α2 loop were swapped between three different SCAN domains and shown to modulate binding preferences, suggesting that these regions could confer heterodimer selectivity. While sequence diversity is high in helix 1 and the α1-α2 loop (Figure 6A), they contribute relatively little to the dimer interfaces observed for MZF1 and ZNF174. This prompted us to consider an alternative SCAN dimer interface by constructing a model of the MZF1 SCAN homodimer analogous to that observed for CA-CTD. In this head-to-head dimer (Figure 7A) helices 1, 3 and 4 from each monomer pack against one another to form a less extensive interface (∼975 Å2) that is ∼700 Å2 smaller than in the domain-swapped dimer (Figure 7B). Analysis of residues contributing >5 Å2 to each of the two dimer interfaces types shows a highly conserved central region dominated by helix 3 and variable residues at the periphery (Figure 8). Residues within these two interfaces with high sequence variability partition into two distinct subsets that map to helices 2 and 5 in the domain-swapped interface (Figure 8 A and B) and helices 1 and 4 in the head-to-head interface (Figure 8 C and D). Analysis of these dimer interfaces using the Protein Interfaces, Surfaces and Assemblies sever (http://www.ebi.ac.uk/msd-srv/prot_int/pistart.html) 22 indicated that the head-to-head dimer had a more favorable solvation energy (-85.7 kcal M-1) than the domain-swapped dimer (-84.1 kcal M-1). These results suggest that the margin of stability favoring the domain-swapped MZF1 dimer may be relatively small, and that other SCAN homo- and heterodimers might adopt either dimer topology.
Figure 7.
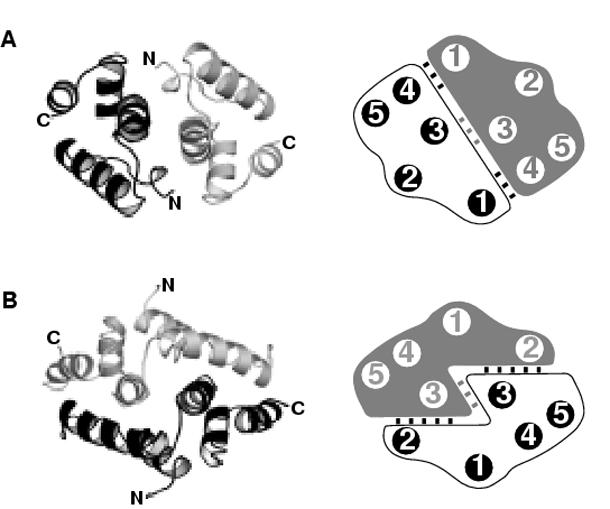
Topology of the SCAN dimer interfaces.
Representative structures and schematic representations of the alternative (a) and domain-swapped (b) dimer interfaces showing the helical interactions. (a) The alternative dimer interface is represented by the HIV capsid C-terminal domain (PDB entry 1a43). One half to the dimer is colored in gray and the opposing monomer is colored in black. (b) The domain-swapped interface is represented by the MZF1 SCAN domain (PDB entry 2fi2).
Figure 8.
Computational analysis of the two potential SCAN dimer interfaces.
Scatter plots of sequence variability vs. interface contribution for the (a) domain-swapped and (c) alternative dimers. Residues colored in purple, orange and black correspond to sequence variability scores >70, 40-70, and <40, respectively. Surface views of the (b) domain-swapped and (d) alternative dimers with interface residues colored as in (a) and (c). Non-interface residues are shown in light gray.
SCAN homodimers may exhibit a domain-swapped topology mainly to compensate for an unfolded monomeric state 6. A recent study by Ding et al. analyzed several experimentally determined domain-swapped dimers and concluded that in some instances domain swapping is a natural thermodynamic consequence that promotes folding in proteins that are marginally stable in their monomeric forms 23. The adoption of a domain-swapped dimer topology maximizes the buried hydrophobic surface area and provides the additional thermodynamic drive to allow unstable monomers to achieve a stable fold. Thermal denaturation studies of ZNF174 showed that the SCAN domain exhibits two-state folding behavior in which folded dimer appears to be in equilibrium with unfolded monomer 6. Likewise, the FP value of ∼0.04 measured for the SCAN monomer (Figure 2B) suggests that MZF1 is unfolded at low concentration, consistent with the two-state model shown for ZNF174.
Interconversion between the two dimer types would require the flexibility of a hinge in the α2-α3 loop. To assess whether a non-domain-swapped dimer topology might be compatible with the SCAN domain, we submitted the MZF1 and ZNF174 structures (PDB entries 2fi2 and 1y7q) to the hinge region prediction server (http:/dokhlab.unc.edu/tools/h-predictor) 23. For both structures, the server predicted a hinge region between helices 2 and 3, consistent with the domain swapped topology of the SCAN domain. Taken together, the experimental data implicating helix 1 in selective SCAN recognition and the possibility that the observed homodimer topology may simply be required for thermodynamic stability lead us to question whether the domain-swapped interface is representative of all SCAN dimers.
Functional implications of SCAN dimerization
SCAN domains do not participate directly in transcriptional activation or repression, but instead mediate the formation of homo- and heterodimers with other SCAN proteins. With the potential to form a large number of unique SCAN dimers, the SCAN-ZFP family likely serves as a powerful combinatorial network for regulation of gene expression. The selectivity shown for SCAN-mediated heterodimer formation suggests that broad functional diversity can be achieved from a relatively small number of proteins 24, even though not all of the possible pairwise combinations may form. This type of diversity has been reported for the basic regionleucine zipper (bZIP) proteins, which bind to DNA as homo- and heterodimers to regulate gene transcription 25. For example, the Jun-Fos heterodimer binds to AP1 target DNA sites with 30-fold greater affinity than the Jun homodimer 26. It is possible that the SCAN-ZFP family, which is comparable in size to the human bZIP family (63 vs. 65 members, respectively), generates unique SCAN heterodimers with an extensive range of transcriptional control. However, the conserved nature of the SCAN dimer interface suggests that the selectivity of SCAN-SCAN interactions is controlled by subtle structural variations and relative affinities, rather than a complete absence of binding for certain combinations. Consistent with this notion, we detected binding for all pairs of proteins in preliminary GST pulldown experiments using four different SCAN domains (unpublished results). Along with further structural studies, precise measurements of heterodimer affinities as described here for the MZF1 homodimer will be needed to define the basis for selectivity in the SCAN domain family.
We anticipate that other cellular mechanisms, such as post-translational modification, expression levels, and the recruitment of coregulatory protein complexes will also modulate the activity of SCAN-ZFP transcription factors. MZF1 transcriptional activity is regulated by several mechanisms, but it unclear how SCAN dimerization modulates these functions. For example, an ATP-dependent chromatin-remodeling complex containing mDomino has been shown to interact with the murine homolog of MZF1 (mMZF-2) to regulate its activity in myeloid cells 27. In addition, it is proposed that the N-terminal region of mMZF-2 negatively regulates its transcriptional activity until an upstream signal releases inhibition 28. Since MAPK-mediated phosphorylation of the transactivation domain negatively regulates mMZF-2 activity, it suggests that mechanisms of phosphorylation and dephosphorylation may regulate MZF1 activity 29. We previously demonstrated that the SCAN domain of MZF1 interacts with another SCAN member, RAZ1 30. Interestingly, RAZ1 has been shown to function as a co-activator and regulates cell fate when bound to other transcription factors, such as the SCAN-ZFP member ZNF202 and the nuclear receptor PPARγ5; 31; 32; 33; 34. By a similar mechanism, recruitment of RAZ1 through the MZF1 SCAN domain may play a direct role in regulating MZF1 transcriptional activity during blood cell development.
In summary, we have determined the structure of the SCAN domain homodimer from zinc-finger transcription factor MZF1, a tumor suppressor protein with a role in blood cell development. Using a novel FP binding assay, we showed that the isolated MZF1 SCAN dimer dissociates with a Kd of 600 nM. Our results unequivocally confirm the domain-swapped topology observed for another SCAN homodimer, ZNF174. In addition, we provide the first comprehensive analysis of amino acid conservation and predicted dimer interface contribution for all SCAN domains in the human genome. Future studies will define the folding topology and specificity determinants for SCAN heterodimers, crucial steps toward understanding the role of MZF1 in hematopoiesis and defining the factors that regulate this large family of transcription factors.
EXPERIMENTAL PROCEDURES
Cloning
DNA fragments corresponding to MZF1 residues 1-128 or 37-128 were amplified by PCR from a cDNA coding for full-length MZF1. DNA primers encoded 5’ Bam HI and 3’ Hind III restriction sites to facilitate ligation into pQE30GB1 35. The resulting plasmids were named pGB1-MZF1(1-128) and pGB1-MZF1(37-128). The DNA fragment coding for MZF1 residues 37-128 was also cloned into pQE308HT 35 and into a modified pGEX-2T vector as described for pQE30GB1. Modification to pGEX-2T included the conversion of the thrombin protease site to a tobacco etch virus protease site and the addition of Hind III to the multiple cloning site.
Protein expression and purification
MZF1 expression plasmids were individually transformed into E. coli strain SG13009[pRPEP4] (Qiagen) or BL21(DE3). Cells were grown at 37 °C in Luria-Bertani broth containing 150 μg/mL ampicillin and 50 μg/mL kanamycin until reaching a cell density of A600 = 0.7. Protein expression was then induced by the addition of isopropyl-β-D-thiogalactopyranoside (IPTG) to a final concentration of 1 mM. Following induction, cells were grown for another 5 hours, harvested by centrifugation and stored at -80 °C until processed further. Isotopically-labeled proteins for NMR were produced using M9 medium containing 15N-ammonium chloride and/or 13C-glucose as the sole nitrogen and carbon sources, respectively 36.
Cells harvested from a 1-L culture were lysed using a French pressure cell and His-tagged proteins were purified by metal affinity chromatography or and cleaved according to published protocols 37. The GB1 fusion protein was removed by metal affinity chromatography and the column flow through/washes containing purified MZF1 were pooled and dialyzed into the appropriate buffer for further experiments. The GST-MZF1(37-128) protein was purified by glutathione-agarose affinity chromatography according to the manufacturer’s protocol (GE Healthcare).
Glutathione-S-transferase pull-down assay
GST or GST fused MZF1 (75 μg) was incubated overnight in the presence or absence of His-tagged MZF1 (50 μg) at 37° C in binding buffer (50mM Tris-HCl pH 7.5, 100mM NaCl, 0.1% β-mercaptoethanol, 0.1% Triton X-100). A 200 μL aliquot of prepared glutathione-agarose beads (BD Biosciences) was added to the reaction and incubation continued overnight at 4° C. The beads were collected by centrifugation at 1,000 × g for 1 minute and washed twice with a large excess of binding buffer. GST fusions and bound proteins were eluted in 40 μL Laemmli buffer and analyzed by SDS-PAGE and Coomassie stain or western blot analysis using α-RGSHis antibody (Qiagen).
Fluorescence polarization
Intrinsic tryptophan fluorescence polarization (FP) values were measured for serial dilutions of MZF1 ranging in concentration from 0.01-70 μM in 20 mM sodium phosphate pH 7.4 and 50 mM sodium phosphate. All measurements were performed at 25 °C on a PTI QM-4 spectrofluorometer using excitation at 290 nm, emission at 335 nm and slit widths of 6 and 8 nm, respectively. Non-linear fitting of FP values to an equation describing a monomer-dimer equilibrium was used to determine the apparent MZF1 dimer dissociation constant as previously described 18.
NMR spectroscopy
NMR samples were prepared in buffers containing 20 mM sodium phosphate, pH 7.4, 50 mM sodium chloride, 0.02% sodium azide and 10% 2H2O at a protein concentration of ∼2 mM. All NMR data were acquired at 30 °C on a Bruker 600 MHz spectrometer equipped with a triple-resonance CryoProbe™ and processed with NMRPipe software 38. Backbone 1H, 15N and 13C resonance assignments were obtained in an automated manner using the program Garant 39, with peaklists from 3D HNCO, HNCACO, HNCA, HNCOCA, HNCACB, CCONH and 2D 1H/15N HSQC spectra generated manually with XEASY 40 or automatically with SPSCAN. Sidechain assignments were completed manually from 3D HBHACONH, HCCONH, HCCH-TOCSY and 13C(aromatic)-edited NOESY-HSQC spectra.
Structure determination
Distance constraints were obtained from 3D 15N-edited NOESY-HSQC, 13C-edited NOESY-HSQC, and 13C(aromatic)-edited NOESY-HSQC spectra (τmix = 80 ms). Intermonomer distance constraints were obtained from a 3D F1-13C-filtered/F3-13C-edited NOESY-HSQC spectrum (τmix = 120 ms). Backbone ψ and φ dihedral angle constraints were generated from secondary shifts of the 1Hα, 13Cα, 13Cβ, 13C’, and 15N nuclei using the program TALOS 41. Initial structures were generated in an automated manner using the NOEASSIGN module of the torsion angle dynamics program CYANA 42, followed by iterative manual refinement to eliminate constraint violations. The 20 conformers with the lowest target function were chosen for further refinement by X-PLOR, in which physical force field terms and explicit water solvent molecules were added to the experimental constraints 43. The final 20 conformers were validated by Procheck-NMR, and the statistics for these are listed in Table 1. The coordinates for these structural models, along with the restraints employed, have been deposited in the Protein Data Bank (PDB) under accession number 2FI2.
Sequence analysis of human SCAN domains
The predicted amino acid sequence for sixty-three human SCAN domains, identified as previously described 8, were aligned by Clustal W sequence alignment using MacVector 7.2 with an open gap penalty setting of 100.0 and extend gap penalty of 0.1. For each SCAN domain, the Official Symbol and GeneID assigned on or before January 16, 2006, at The National Center for Biotechnology Information (NCBI) were given. In some cases, the original gene record was discontinued at NCBI, but the genomic sequence remains available. Only SCAN domain sequences contained in complete open frames were included in the analysis. To evaluate sequence variability, we utilized the SCORECONS server (http://www.ebi.ac.uk/thornton-srv/databases/cgi-bin/valdar/scorecons_server.pl) to calculate normalized Shannon entropies using the following equation 44; 45:
where N is the number of aligned sequences, K is the number of possible residues types (K=21, 20 amino acids + 1 for gaps), na is the number of residues of type a in a particular position and pa is equal to na/N. Values were normalized such that a score of 100 corresponds to maximal diversity and 0 represents absolute identity.
Solvent accessible surface area was calculated in Molmol 46 using a water probe with a radius of 1.4 Å. Briefly, solvent accessible surface area was calculated on a per residue basis in the context of an intact dimer or an individual monomer. Contributions to the dimer interface were then calculated as the difference in solvent accessible surface area between the monomer and the dimer.
ACKNOWLEDGMENTS
This work was supported in part by an American Cancer Society Institutional Research Grant (TS), an award from the Research Affairs Committee at the Medical College of Wisconsin (TS), and NIH grants P50 GM64598 and 1 U54 GM074901-01 (BFV and FCP).
Footnotes
Coordinates and related data have been deposited at PDB (2FI2) and NMR data at BMRB (6957).
Publisher's Disclaimer: This is a PDF file of an unedited manuscript that has been accepted for publication. As a service to our customers we are providing this early version of the manuscript. The manuscript will undergo copyediting, typesetting, and review of the resulting proof before it is published in its final citable form. Please note that during the production process errorsmaybe discovered which could affect the content, and all legal disclaimers that apply to the journal pertain.
REFERENCES
- 1.Pengue G, Calabro V, Bartoli PC, Pagliuca A, Lania L. Repression of transcriptional activity at a distance by the evolutionarily conserved KRAB domain present in a subfamily of zinc finger proteins. Nucleic Acids Res. 1994;22:2908–14. doi: 10.1093/nar/22.15.2908. [DOI] [PMC free article] [PubMed] [Google Scholar]
- 2.Williams AJ, Khachigian LM, Shows T, Collins T. Isolation and characterization of a novel zinc-finger protein with transcription repressor activity. J Biol Chem. 1995;270:22143–52. doi: 10.1074/jbc.270.38.22143. [DOI] [PubMed] [Google Scholar]
- 3.Williams AJ, Blacklow SC, Collins T. The zinc finger-associated SCAN box is a conserved oligomerization domain. Mol Cell Biol. 1999;19:8526–35. doi: 10.1128/mcb.19.12.8526. [DOI] [PMC free article] [PubMed] [Google Scholar]
- 4.Sander TL, Haas AL, Peterson MJ, Morris JF. Identification of a novel SCAN box-related protein that interacts with MZF1B. The leucine-rich SCAN box mediates hetero- and homoprotein associations. J Biol Chem. 2000;275:12857–67. doi: 10.1074/jbc.275.17.12857. [DOI] [PubMed] [Google Scholar]
- 5.Schumacher C, Wang H, Honer C, Ding W, Koehn J, Lawrence Q, Coulis CM, Wang LL, Ballinger D, Bowen BR, Wagner S. The SCAN domain mediates selective oligomerization. J Biol Chem. 2000;275:17173–9. doi: 10.1074/jbc.M000119200. [DOI] [PubMed] [Google Scholar]
- 6.Stone JR, Maki JL, Blacklow SC, Collins T. The SCAN domain of ZNF174 is a dimer. J Biol Chem. 2002;277:5448–52. doi: 10.1074/jbc.M109815200. [DOI] [PMC free article] [PubMed] [Google Scholar]
- 7.Collins T, Sander TL. The superfamily of SCAN domain containing zinc finger transcription factors. In: Iuchi S, Kuldell N, editors. Zinc Finger Proteins: From Atomic Contact to Cellular Function. Vol. 22. Landes Bioscience; 2004. pp. 154–165. [Google Scholar]
- 8.Sander TL, Stringer KF, Maki JL, Szauter P, Stone JR, Collins T. The SCAN domain defines a large family of zinc finger transcription factors. Gene. 2003;310:29–38. doi: 10.1016/s0378-1119(03)00509-2. [DOI] [PubMed] [Google Scholar]
- 9.Nam K, Honer C, Schumacher C. Structural components of SCAN-domain dimerizations. Proteins. 2004;56:685–92. doi: 10.1002/prot.20170. [DOI] [PubMed] [Google Scholar]
- 10.Ivanov D, Stone JR, Maki JL, Collins T, Wagner G. Mammalian SCAN domain dimer is a domain-swapped homolog of the HIV capsid C-terminal domain. Mol Cell. 2005;17:137–43. doi: 10.1016/j.molcel.2004.12.015. [DOI] [PubMed] [Google Scholar]
- 11.Hromas R, Collins SJ, Hickstein D, Raskind W, Deaven LL, O’Hara P, Hagen FS, Kaushansky K. A retinoic acid-responsive human zinc finger gene, MZF-1, preferentially expressed in myeloid cells. J Biol Chem. 1991;266:14183–7. [PubMed] [Google Scholar]
- 12.Peterson MJ, Morris JF. Human myeloid zinc finger gene MZF produces multiple transcripts and encodes a SCAN box protein. Gene. 2000;254:105–18. doi: 10.1016/s0378-1119(00)00281-x. [DOI] [PubMed] [Google Scholar]
- 13.Bavisotto L, Kaushansky K, Lin N, Hromas R. Antisense oligonucleotides from the stage-specific myeloid zinc finger gene MZF-1 inhibit granulopoiesis in vitro. J Exp Med. 1991;174:1097–101. doi: 10.1084/jem.174.5.1097. [DOI] [PMC free article] [PubMed] [Google Scholar]
- 14.Gaboli M, Kotsi PA, Gurrieri C, Cattoretti G, Ronchetti S, Cordon-Cardo C, Broxmeyer HE, Hromas R, Pandolfi PP. Mzf1 controls cell proliferation and tumorigenesis. Genes Dev. 2001;15:1625–30. doi: 10.1101/gad.902301. [DOI] [PMC free article] [PubMed] [Google Scholar]
- 15.Gamble TR, Yoo S, Vajdos FF, von Schwedler UK, Worthylake DK, Wang H, McCutcheon JP, Sundquist WI, Hill CP. Structure of the carboxyl-terminal dimerization domain of the HIV-1 capsid protein. Science. 1997;278:849–53. doi: 10.1126/science.278.5339.849. [DOI] [PubMed] [Google Scholar]
- 16.Sampson DA, Wang M, Matunis MJ. The small ubiquitin-like modifier-1 (SUMO-1) consensus sequence mediates Ubc9 binding and is essential for SUMO-1 modification. J Biol Chem. 2001;276:21664–9. doi: 10.1074/jbc.M100006200. [DOI] [PubMed] [Google Scholar]
- 17.Altieri AS, Hinton DP, Byrd RA. Association of Biomolecular Systems via Pulsed Field Gradient NMR Self-Diffusion Measurements. J. Am. Chem. Soc. 1995;117:7566–7567. [Google Scholar]
- 18.Veldkamp CT, Peterson FC, Pelzek AJ, Volkman BF. The monomerdimer equilibrium of stromal cell-derived factor-1 (CXCL 12) is altered by pH, phosphate, sulfate, and heparin. Protein Sci. 2005;14:1071–81. doi: 10.1110/ps.041219505. [DOI] [PMC free article] [PubMed] [Google Scholar]
- 19.Walters KJ, Ferentz AE, Hare BJ, Hidalgo P, Jasanoff A, Matsuo H, Wagner G. Characterizing protein-protein complexes and oligomers by nuclear magnetic resonance spectroscopy. Methods Enzymol. 2001;339:238–58. doi: 10.1016/s0076-6879(01)39316-3. [DOI] [PubMed] [Google Scholar]
- 20.Stuart AC, Borzilleri KA, Withka JM, Palmer AG., 3rd Compensating for Variations in 1H-13C Scalar Coupling Constants in Isotope-Filtered NMR experiments. J Am Chem Soc. 1999;121:5346–5347. [Google Scholar]
- 21.Ye Y, Godzik A. Flexible structure alignment by chaining aligned fragment pairs allowing twists. Bioinformatics. 2003;19:ii246–ii255. doi: 10.1093/bioinformatics/btg1086. [DOI] [PubMed] [Google Scholar]
- 22.Krissinel E, Henrick K. Detection of Protein Assemblies in Crystals. Lecture Notes in Computer Science; 2005. [Google Scholar]
- 23.Ding F, Prutzman KC, Campbell SL, Dokholyan NV. Topological determinants of protein domain swapping. Structure. 2006;14:5–14. doi: 10.1016/j.str.2005.09.008. [DOI] [PubMed] [Google Scholar]
- 24.Lamb P, McKnight SL. Diversity and specificity in transcriptional regulation: the benefits of heterotypic dimerization. Trends Biochem Sci. 1991;16:417–22. doi: 10.1016/0968-0004(91)90167-t. [DOI] [PubMed] [Google Scholar]
- 25.Vinson C, Myakishev M, Acharya A, Mir AA, Moll JR, Bonovich M. Classification of human B-ZIP proteins based on dimerization properties. Mol Cell Biol. 2002;22:6321–35. doi: 10.1128/MCB.22.18.6321-6335.2002. [DOI] [PMC free article] [PubMed] [Google Scholar]
- 26.Halazonetis TD, Georgopoulos K, Greenberg ME, Leder P. c-Jun dimerizes with itself and with c-Fos, forming complexes of different DNA binding affinities. Cell. 1988;55:917–24. doi: 10.1016/0092-8674(88)90147-x. [DOI] [PubMed] [Google Scholar]
- 27.Ogawa H, Ueda T, Aoyama T, Aronheim A, Nagata S, Fukunaga R. A SWI2/SNF2-type ATPase/helicase protein, mDomino, interacts with myeloid zinc finger protein 2A (MZF-2A) to regulate its transcriptional activity. Genes Cells. 2003;8:325–39. doi: 10.1046/j.1365-2443.2003.00636.x. [DOI] [PubMed] [Google Scholar]
- 28.Murai K, Murakami H, Nagata S. Myeloid-specific transcriptional activation by murine myeloid zinc-finger protein 2. Proc Natl Acad Sci U S A. 1998;95:3461–6. doi: 10.1073/pnas.95.7.3461. [DOI] [PMC free article] [PubMed] [Google Scholar]
- 29.Ogawa H, Murayama A, Nagata S, Fukunaga R. Regulation of myeloid zinc finger protein 2A transactivation activity through phosphorylation by mitogen-activated protein kinases. J Biol Chem. 2003;278:2921–7. doi: 10.1074/jbc.M207615200. [DOI] [PubMed] [Google Scholar]
- 30.Sander TL, Morris JF. Characterization of the SCAN box encoding RAZ1 gene: analysis of cDNA transcripts, expression, and cellular localization. Gene. 2002;296:53–64. doi: 10.1016/s0378-1119(02)00792-8. [DOI] [PubMed] [Google Scholar]
- 31.Porsch-Ozcurumez M, Langmann T, Heimerl S, Borsukova H, Kaminski WE, Drobnik W, Honer C, Schumacher C, Schmitz G. The zinc finger protein 202 (ZNF202) is a transcriptional repressor of ATP binding cassette transporter A1 (ABCA1) and ABCG1 gene expression and a modulator of cellular lipid efflux. J Biol Chem. 2001;276:12427–33. doi: 10.1074/jbc.M100218200. [DOI] [PubMed] [Google Scholar]
- 32.Castillo G, Brun RP, Rosenfield JK, Hauser S, Park CW, Troy AE, Wright ME, Spiegelman BM. An adipogenic cofactor bound by the differentiation domain of PPARgamma. Embo J. 1999;18:3676–87. doi: 10.1093/emboj/18.13.3676. [DOI] [PMC free article] [PubMed] [Google Scholar]
- 33.Babb R, Bowen BR. SDP1 is a peroxisome-proliferator-activated receptor gamma 2 co-activator that binds through its SCAN domain. Biochem J. 2003;370:719–27. doi: 10.1042/BJ20021378. [DOI] [PMC free article] [PubMed] [Google Scholar]
- 34.Suzawa M, Takada I, Yanagisawa J, Ohtake F, Ogawa S, Yamauchi T, Kadowaki T, Takeuchi Y, Shibuya H, Gotoh Y, Matsumoto K, Kato S. Cytokines suppress adipogenesis and PPAR-gamma function through the TAK1/TAB1/NIK cascade. Nat Cell Biol. 2003;5:224–30. doi: 10.1038/ncb942. [DOI] [PubMed] [Google Scholar]
- 35.Waltner JK, Peterson FC, Lytle BL, Volkman BF. Structure of the B3 domain from Arabidopsis thaliana protein At1g16640. Protein Sci. 2005;14:2478–83. doi: 10.1110/ps.051606305. [DOI] [PMC free article] [PubMed] [Google Scholar]
- 36.Maniatis T, Fritsch EF, Sambrook J. Molecular Cloning: A Laboratory Manual. Cold Spring Harbor Laboratory; Cold Spring Harbor, NY: 1986. [Google Scholar]
- 37.Lytle BL, Peterson FC, Qiu SH, Luo M, Zhao Q, Markley JL, Volkman BF. Solution structure of a ubiquitin-like domain from tubulin-binding cofactor B. J Biol Chem. 2004;279:46787–93. doi: 10.1074/jbc.M409422200. [DOI] [PubMed] [Google Scholar]
- 38.Delaglio F, Grzesiek S, Vuister GW, Zhu G, Pfeifer J, Bax A. NMRPipe: a multidimensional spectral processing system based on UNIX pipes. J. Biomol. NMR. 1995;6:277–293. doi: 10.1007/BF00197809. [DOI] [PubMed] [Google Scholar]
- 39.Bartels C, Billeter M, Güntert P, Wüthrich K. Automated Sequence-specific NMR Assignments of Homologous Proteins using the program GARANT. J. Biomol. NMR. 1996;7:207–213. doi: 10.1007/BF00202037. [DOI] [PubMed] [Google Scholar]
- 40.Bartels C, Xia T-H, Billeter M, Güntert P, Wüthrich K. The Program XEASY for Computer-Supported NMR Spectral Analysis of Biological Macromolecules. J. Biomol. NMR. 1995;5:1–10. doi: 10.1007/BF00417486. [DOI] [PubMed] [Google Scholar]
- 41.Cornilescu G, Delaglio F, Bax A. Protein backbone angle restraints from searching a database for chemical shift and sequence homology. J Biomol NMR. 1999;13:289–302. doi: 10.1023/a:1008392405740. [DOI] [PubMed] [Google Scholar]
- 42.Herrmann T, Guntert P, Wuthrich K. Protein NMR structure determination with automated NOE assignment using the new software CANDID and the torsion angle dynamics algorithm DYANA. J Mol Biol. 2002;319:209–27. doi: 10.1016/s0022-2836(02)00241-3. [DOI] [PubMed] [Google Scholar]
- 43.Linge JP, Williams MA, Spronk CA, Bonvin AM, Nilges M. Refinement of protein structures in explicit solvent. Proteins. 2003;50:496–506. doi: 10.1002/prot.10299. [DOI] [PubMed] [Google Scholar]
- 44.Strait BJ, Dewey TG. The Shannon information entropy of protein sequences. Biophys J. 1996;71:148–55. doi: 10.1016/S0006-3495(96)79210-X. [DOI] [PMC free article] [PubMed] [Google Scholar]
- 45.Valdar WS. Scoring residue conservation. Proteins. 2002;48:227–41. doi: 10.1002/prot.10146. [DOI] [PubMed] [Google Scholar]
- 46.Koradi R, Billeter M, Wüthrich K. MOLMOL: a program for display and analysis of macromolecular structures. J. Mol. Graphics. 1996;14:51–55. doi: 10.1016/0263-7855(96)00009-4. [DOI] [PubMed] [Google Scholar]